www.hydrol-earth-syst-sci.net/15/3383/2011/ doi:10.5194/hess-15-3383-2011
© Author(s) 2011. CC Attribution 3.0 License.
Earth System
Sciences
Regional-scale identification of groundwater-surface water
interaction using hydrochemistry and multivariate statistical
methods, Wairarapa Valley, New Zealand
M. R. Guggenmos1, C. J. Daughney2, B. M. Jackson1, and U. Morgenstern2
1School of Geography, Environment and Earth Sciences, Victoria University of Wellington, Wellington, New Zealand 2GNS Science, Lower Hutt, New Zealand
Received: 26 June 2011 – Published in Hydrol. Earth Syst. Sci. Discuss.: 6 July 2011 Revised: 22 October 2011 – Accepted: 27 October 2011 – Published: 15 November 2011
Abstract. Identifying areas of interaction between ground-water and surface ground-water is crucial for effective environmen-tal management, because this interaction is known to influ-ence water quantity and quality. This paper applies hydro-chemistry and multivariate statistics to identify locations and mechanisms of groundwater-surface water interaction in the pastorally dominated Wairarapa Valley, New Zealand. Hier-archical Cluster Analysis (HCA) and Principal Components Analysis (PCA) were conducted using site-specific median values of Ca, Mg, Na, K, HCO3, Cl, SO4 and electrical conductivity from 22 surface water sites and 246 groundwa-ter sites. Surface wagroundwa-ter and groundwagroundwa-ter monitoring sites were grouped together in three of the seven clusters identi-fied by HCA, with the inference made that similarities in hy-drochemistry indicate groundwater-surface water interaction. PCA indicated that the clusters were largely differentiated by total dissolved solids concentration, redox condition and ratio of major ions. Shallow aerobic groundwaters, located in close proximity to losing reaches of rivers, were grouped with similar Ca-HCO3type surface waters, indicating poten-tial recharge to aquifers from these river systems. Ground-waters that displayed a rainfall-recharged chemical signature with higher Na relative to Ca, higher Cl relative to HCO3 and an accumulation of NO3were grouped with neighbour-ing surface waters, suggestneighbour-ing the provision of groundwater base flow to these river systems and the transfer of this chem-ical signature from underlying aquifers. The hydrochemchem-ical techniques used in this study did not reveal groundwater-surface water interaction in some parts of the study area, specifically where deep anoxic groundwaters, high in total dissolved solids with a distinct Na-Cl signature, showed no
Correspondence to:C. J. Daughney ([email protected])
apparent link to surface water. The drivers of hydrochemistry inferred from HCA and PCA are consistent with previous measurements of18O, water age and excess air. Overall, this study has shown that multivariate statistics can be used as a rapid method to identify groundwater-surface water interac-tion at a regional scale using existing hydrochemical datasets.
1 Introduction
It is widely acknowledged that groundwaters and surface wa-ters interact at a variety of spatial and temporal scales, the de-gree to which is highly dependent on meteorological, fluvial, anthropogenic and geological processes (Winter et al., 1998). Such interactions play a significant role in determining the quantity and hydrochemical composition of water bodies at both local and regional scales. Therefore, identifying loca-tions and understanding mechanisms of groundwater-surface water interaction is vital for effective environmental manage-ment (Dahm et al., 1998).
appropriateness of each method is highly dependent on the study’s desired outcomes and available resources.
In this study, our focus is on extending the hydrochem-ical methods for identifying groundwater-surface water in-teraction. The hydrochemical composition of fluvial sys-tems is largely influenced by precipitation, regional geology, aquifer-stream transfers and, increasingly, also by anthro-pogenic contamination. Subsequently, water quality data of-fer insight into the various flow pathways, geological settings and physical and chemical processes which water experience (Freeze and Cherry, 1979; G¨uler and Thyne, 2004; Kumar et al., 2009). Numerous studies suggest that similarities in water composition between neighbouring groundwater and surface water bodies, such as ion ratios or the concentration of total dissolved solids (TDS), can be used to qualitatively or statistically infer potential groundwater-surface water in-teraction (e.g. Burden, 1982; Kumar et al., 2009; Taylor et al., 1989) or, if water flux data are available, to quantitatively estimate fractions of water derived from different sources or end-members with distinct hydrochemistry (Schmidt et al., 2010; V´asquez-Su˜n´e et al., 2010; de Louw et al. 2011).
Multivariate methods such as Hierarchical Cluster Analy-sis (HCA) and Principal Components AnalyAnaly-sis (PCA) have become increasingly popular in the qualitative and statistical analysis and interpretation of environmental datasets, espe-cially where water flux data are not available. These tech-niques enable the simplification of large datasets by group-ing data into components or clusters based on the relationship between specified variables (Kumar et al., 2009; Mencio and Mas-Pla, 2008). These components or clusters can then be related to the processes that create variability in the dataset, to gain a greater understanding of natural earth systems and their operations. Both HCA and PCA have been extensively applied in hydrogeology to identify groundwater facies that merit further exploration in relation to natural groundwater evolution (e.g. Banoeng-Yakubo et al., 2009; Cloutier et al., 2008; Demlie et al., 2007; G¨uler and Thyne, 2004; Koh et al., 2009; Delgado-Outeri˜no et al., 2011), contamination from salt water intrusion (e.g. Kim et al., 2003; Ritzi et al., 1993) and contamination from anthropogenic sources (e.g. Demlie et al., 2007; Koh et al., 2009). Several studies have also utilized multivariate statistics in the classification of sur-face waters (e.g. Alther, 1989; McNeil et al., 2005; Panda et al., 2006), while G¨uler and Thyne (2004) and Thyne et al. (2004) classified both groundwater and surface water bod-ies simultaneously at a multi-watershed and single watershed scale, respectively, to characterize the hydrogeology of an area and identify localised areas of groundwater recharge and discharge. Recent work by Kumar et al. (2009) utilised sim-ilar statistical methodologies to specifically identify the pro-vision of contaminated groundwater base flow to an urban reach of the Yumana River in India, classifying groundwater and surface water bodies together based on hydrochemical similarities. Lautz and Finelli (2008) applied similar multi-variate statistical techniques to evaluate groundwater-surface
water interaction at a more localised scale. Studies by the likes of these authors demonstrate significant chemical corre-lation between groundwater and surface water and highlight the use of multivariate statistical methods as an investigative tool to identify potential areas of groundwater-surface water interaction.
To date this methodology of inferring potential sites of groundwater-surface water interaction using existing hydro-chemical data and multivariate statistical methods has been neglected at a regional or multi-watershed scale, despite the availability of extensive regional hydrochemical datasets from both groundwater and surface water bodies (e.g. State of Environment monitoring in New Zealand, US Environ-mental Protection Agency monitoring data, European-wide national infrastructure monitoring programmes in place to satisfy the legislative demands of the recent European Wa-ter Framework Directive). Such datasets have been utilised to classify ground water and surface waters individually at a regional scale (e.g. McNeil et al., 2005; Thyne et al., 2004), but to our knowledge, few studies have attempted to simulta-neously classify both groundwaters and surface waters into similar hydrochemical facies to determine their interrela-tionships and degree of interaction. Identification of areas of groundwater-surface water interaction using existing data would greatly assist in the selection of key areas or specific watersheds that are sensitive to environmental change and so may require future monitoring and investigation.
Fig. 1.Location of Wairarapa Valley and major river systems, North Island, New Zealand.
2 Site description: Wairarapa Valley
The Wairarapa valley is a 3000 km2 geological depression located in the south-east corner of the North Island of New Zealand (Fig. 1). The valley extends approximately 80 km north-east to south-west and largely overlies the locked sub-duction interface of the Australian and Pacific plates (Mc-Conchie, 2000). The valley is bounded by a series of axial Torlesse greywacke ranges on its western periphery with the Rimutaka and Tararua Ranges and similarly on the south-east periphery with the Aorangi ranges (Fig. 2a). These hard, heavily vegetated, Triassic-Jurassic greywackes form the highest relief in the area (ca. 1500 m) and are at times dissected by sheared blocks of basalt, chert, limestone and mudstone (Kamp, 1992). The north-east boundary of the val-ley is bounded by soft, early Pleistocene/Late Tertiary marine sandstone, siltstone, mudstone and limestone ranges (Mc-Conchie, 2000). The valley itself is filled with successive layers of well sorted to poorly sorted Quaternary glacial-fluvial sedimentary fans, dissected and reworked by glacial-fluvial systems (Fig. 2b). Substantial marine, estuarine and lacus-trine depositional layers have accumulated in the lower
sub-siding 25 km of the valley due to global climate cycles and subsequent sea level fluctuations (Begg et al., 2005). As a result the lower basin contains 40–50 m thickness of post-glacial estuarine mud, underlain by a sequence of lacustrine deposits that houses at least six thin artesian gravel layers.
The complex mosaic of sedimentary layers within the Wairarapa basin has resulted in a dynamic regional ground-water system that overrides a low permeability deposit of middle Quaternary clay and silt sediments (Begg et al., 2005). This groundwater system is compartmentalized into various sub-regional flow systems by the Mokonui, Master-ton and CarterMaster-ton faults that traverse the upper Wairarapa val-ley (Jones and Gyopari, 2006). Along these faults, older, less permeable sedimentary layers have been pushed towards the surface, creating barriers that locally restrict the movement of groundwater. Localised regions of subsidence and uplift, the result of tectonic fault movement, have also resulted in elevated basement and Quaternary sediments such as Tiffen Hill and Fernhill, and localised depressions such as the Te Ore Ore Basin (Fig. 2c).
Groundwaters within the Wairarapa valley generally flow down valley in a south-easterly direction (Fig. 2c). The po-tentiometric surface largely follows changes in topography but is also heavily influenced by the presence of imperme-able barriers such as Tiffen Hill, Fernhill and the Te Maire Ridge that redirect groundwater flow (Fig. 2c). In the lower valley the piezometric gradient is reduced as groundwaters flow into the subsiding valley and are directed toward the area beneath Lake Wairarapa (Begg et al., 2005). In gen-eral, aquifers located within the upper and middle Wairarapa valley are largely unconfined and hosted within mid- to well-sorted alluvial gravels. In contrast, aquifers located within the lower valley are typically confined (Fig. 2c). Recharge of the Wairarapa groundwater system is largely determined by Quaternary surface sediments and the location of river sys-tems. Rainfall recharge dominates the majority of the valley, whereas groundwaters underlying permeable Q1 river grav-els are thought to receive recharge primarily from overly-ing river systems (Morgenstern, 2005). A large proportion of groundwaters within Q1, Q2 and Q4 sediments receive recharge from both mechanisms.
Fig. 2. Catchment characteristics of the Wairarapa Valley, New Zealand;(a)simplified regional geology,(b)quaternary (Q) alluvial surface sediment units(c)groundwater flow direction and potentio-metric surface map. Only major fault lines in the Wairarapa Valley are named in Fig. 2a.
months November to March (ca. 16.6◦C) and can be affected
by summer drought conditions (Hawke et al., 2000). A number of river systems flow across the Wairarapa Val-ley, with their headwaters in the low to mid altitude Rimu-taka, Tararua and Eastern Wairarapa hills (Figs. 1 and 2a). Water is largely provided to these systems by rainfall and snowmelt, however a significant proportion is also supplied to these rivers from underlying groundwater systems, sub-surface and soil flows. As a result of the numerous input sources, flow displays significant seasonal variability, with high flows generally experienced during the winter months May to August. In general, these rivers lose water to under-lying groundwater systems as they exit the surrounding hills and cross historic permeable outwash plains. Further down-stream these same rivers usually switch to gaining systems in which a proportion of base flow is provided by ground-water systems (Jones and Gyopari, 2006). Concurrent flow gauging surveys conducted by the Greater Wellington Re-gional Council (GWRC) in 2006 resulted in the classification of river systems within the valley into three interacting cate-gories; rivers that lose significant volumes of water to under-lying groundwaters, rivers that gain significant volumes of water from underlying groundwaters and neutral rivers that do not gain or lose significant volumes of water from ground-water.
Land use in the Wairarapa Valley is dominated by pastoral agriculture, which covers approximately 76 % of the valley floor and includes viticulture and market gardening. These activities are known to add additional nutrients and chemi-cals (e.g. NO3, NH4, K, Cl) to the land through fertilizers, soil cultivation and the discharge of effluents (Watts, 2005). Further, these land use activities place significant pressure on groundwater and surface water systems for water abstraction. In 1999, groundwater allocation was 48 million m3yr−1, the majority of which was abstracted for irrigation during the warmer months of October to March (Jones and Baker, 2005). Groundwater and surface water abstraction has con-tinued to increase substantially since the last decade in re-sponse to rising agriculture and horticulture needs (Jones and Baker, 2005). In December 2004, there were over 150 individual surface water and 318 groundwater extrac-tion permits, a number which is likely to have increased in recent years. The extent to which abstraction influences groundwater-surface water interaction in the area is not well understood.
3 Methodology
3.1 The hydrochemical database
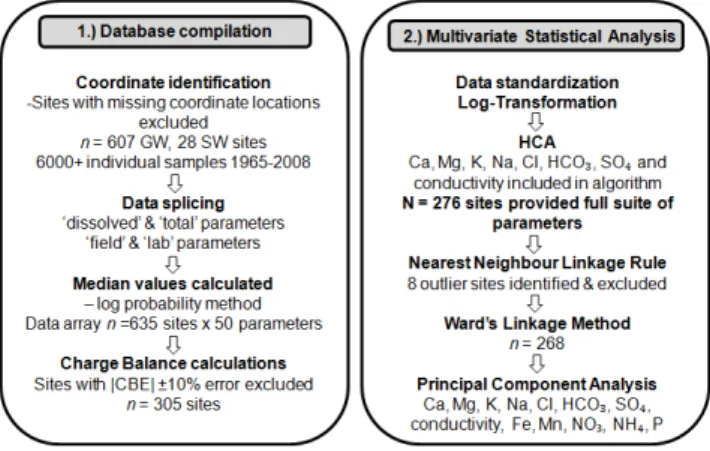
Fig. 3. Schematic representation of the methodologies used for compiling and analyzing the hydrochemical database. “SW” de-notes surface water monitoring sites, “GW” dede-notes groundwater monitoring sites and “n” denotes sample size.
monitoring sites. The dataset included results for 50 differ-ent parameters (not all analysed for every sample), includ-ing both “dissolved” and “total” concentrations of Na, K, Ca, Mg, B, Fe, P, Mn, SO4, Cl and SiO2. These referred to analyses conducted on field-filtered (dissolved) and unfil-tered (total) water samples, respectively. Dissolved concen-trations were selected for use, when available, as they were deemed less likely to be affected by post sampling chemi-cal processes. For samples that had not been analysed for dissolved concentrations, total concentrations were used in-stead. Likewise both “field” and “lab” measurements of pH and conductivity were available for some samples. Prefer-ence was given to field measurements as post sampling re-actions (e.g. degassing) can influence pH, but lab measure-ments were used if field measuremeasure-ments were not available. These substitutions aimed to maximize the amount of data included in subsequent statistical analysis.
Although multivariate statistical methods such as HCA can process datasets of significant size, it was not feasible to process every individual sample from each monitoring site. Therefore, in order to improve the practical size of the work-able database, a representative value was determined for each parameter at each site, based on all of the available samples. 250 of the groundwater sites had been sampled only once, and results from these samples were therefore used in sub-sequent statistical analysis. For the remaining groundwater sites and all of the river sites, the log-probability method, based on the underlying theory of Helsel and Cohn (1988), was employed to calculate representative median values for each analyte at each site, using an automatic water quality processing program developed by Daughney (2005, 2007). Median values were chosen, as opposed to means, in order to reduce the influence of outliers and provide a more ac-curate snapshot of water quality (Helsel and Hirsch, 1992). The log-probability method was deemed appropriate as it can
account for up to 70 % of the dataset being below a known detection limit (censored values) (Helsel and Cohn, 1988). This is a common occurrence in hydrochemical datasets and would usually reduce the number of input variables used in the calculation of the medians using other techniques. Me-dian parameter values calculated in this manner were based on at least twelve samples for all 28 of the river water sites and 79 of the groundwater sites; median parameter values for the remaining 278 groundwater sites were based on between two and eleven samples. The resulting output was a 50 pa-rameter×635 site data array; if data were not available for a given parameter at a given site, it was left blank in the array. It is acknowledged that biases may have been created in this array, i.e. where representative parameter values are based on just one sample at some sites, or are calculated medi-ans based on two to more than twelve samples at other sites. Thus three different QA/QC procedures were applied to en-sure that meaningful results would be obtained from sub-sequent statistical analysis: assessment of temporal trends, calculation of charge balance error (both described below in this section), and identification of sites/samples with unusual chemistry (Sect. 3.2).
The dataset was screened for the presence of temporal trends on a per-parameter basis for all sites that had been sampled at least twelve times (79 groundwater sites and 28 river water sites). This was intended to determine whether the calculated median parameter values based on samples collected in different years might be biased by temporal changes in water quality, and whether data from single sam-ples collected at different sites years apart could be meaning-fully compared. Identification of temporal trends was based on the seasonal Mann-Kendall trend test (α=0.05), with the magnitude of significant trends quantified using Sen’s slope estimator (Helsel and Hirsch, 1992; Daughney, 2005, 2007). Significant parameter-specific temporal trends could be de-tected for roughly 25 % of the sites considered, but rates of change were typically less than 2 % per year. It is assumed that the same mangnitude and frequency of occurrence of trends applies at the other sites for which insufficient data were available to conduct the Mann-Kendall test. Hence, we conclude that the use of the 50 parameter×635 site data ar-ray derived as described above is not strongly biased by ex-isting temporal trends, because the trends are generally slow and occur at a minority of sites.
The dataset was also screened based on charge balance error (CBE), calculated after Freeze and Cherry (1979), to identify samples that were electrically unbalanced (Eq. 1). CBE=
P
vmc−Pvma P
vmc+Pvma
×100% (1)
NH4, NO3, Fe) were excluded from the CBE calculations because they had not been analysed at a significant number of sites. For sites at which these other parameters had been analysed, their concentrations are low and so their inclusion in the calculations affected CBE values by less than 0.5 %, and hence CBE values based on major ion concentrations are considered meaningful for this study. For sites that had been sampled only once, calculation of CBE as described above is conventional. However, sites that had been sampled more than once, CBE values were calculated for each monitoring location using site-specific median concentrations rather than results for individual samples. This approach was followed because a large number of individual samples did not have available the full suite of individual parameters required to calculate CBE. Although unconventional, this approach was reasonable for this study because temporal trends are slow or non-detectable for most parameters at most sites. In to-tal, CBE values were calculated for 383 sites, with the re-maining 252 sites excluded because median values for two or more major ions were missing due to incomplete datasets. Of the 383 sites at which CBE could be calculated as de-scribed above, 56 sites had CBE above +10 %, and 22 sites had CBE below−10 %. All sites for which CBE could not be calculated or where CBE was above 10 % or below−10 % were excluded from subsequent statistical analysis. The CBE threshold of±10 % was selected (G¨uler et al., 2002), as op-posed to the industry standard threshold of±5 % (Freeze and Cherry, 1979), to exclude only those sites with severe charge imbalances indicative of sampling, analytical or data entry errors. The resulting output was thus a 50 parameter×305 site data array. 239 of these 305 sites were groundwater bores ranging from 2.0 to 113.0 m depth (25th, 50th and 75th per-centiles of 7.8, 16.0 and 35.8 m respectively).
3.2 Multivariate statistical methods
In order to infer locations of potential groundwater-surface water interaction, the 50 parameter×305 site data array was subjected to HCA. This and other statistical procedures discussed in this paper were conducted using the statisti-cal package STATGRAPHICS Centurion (Version 15.2.12). HCA is a data reduction tool that works by partitioning a set of observations (e.g. monitoring sites) into a distinct num-ber of clusters based on the statistical similarity of a given set of parameters (e.g. median values of water quality pa-rameters) (Timm, 2002; Kumar et al., 2009). Observations grouped together within the same clusters are statistically similar (at a 95 % confidence level), while observations in different groups show little statistical similarity. Following previous studies, HCA was conducted using site-specific me-dian values of selected parameters (e.g. Reiley et al., 1990; G¨uler et al., 2002). In this study, HCA was conducted us-ing Ca, Mg, K, Na, HCO3, Cl, SO4 and electrical conduc-tivity. These analytes were selected as they were deemed likely to reflect changes in regional lithology and are most
likely to indicate groundwater-surface water interaction be-cause they are known to differ substantially between ground-water and surface ground-water bodies. Further, these parameters were the most commonly analysed across all sites, whereas many additional parameters (e.g. nutrients, pH) were missing from individual samples and monitoring sites. If these addi-tional parameters were included in the clustering processes they would have substantially reduced the number of sites analysed. In total 276 individual monitoring sites provided a full suite of these eight parameters and satisfied the CBE test, and so were included in the clustering algorithm. Prior to this process, data were log-transformed to meet the assumptions of homoscedasticity and normal distribution that are required for the cluster analysis procedure and then standardized ac-cording to their z-scores (Venugopal et al., 2008; Woocay and Walton, 2008):
z=x−x
s (2)
wherezrepresents thez-score for the site and analyte of in-terest,x represents the median of that analyte at that site,x represents the mean of the medians of that analyte over all surface water and groundwater monitoring sites, ands rep-resents the standard deviation of the medians of the analyte over all monitoring sites.
The statistical similarity between individual monitoring sites was measured by the Squared Euclidian Distance (SED) between thez-score of the medians of the water quality pa-rameters at sitesi andk, as given in Eq. (3). The SED is the geometric distance in multidimensional space between two sitesiandk, based on the difference in thej-th hydro-chemical parameter, and summed over allnhydrochemical parameters considered in the HCA algorithm (Kumar et al., 2009). The SED has been found to produce the most distinc-tive sample groupings (e.g. Adar et al., 1992; Cloutier et al., 2008; Daughney and Reeves, 2005, 2006; G¨uler et al., 2002). SED(i,k)=
n X
j=1
(zij−zkj)2 (3)
Following the calculation of the distance (similarity) between monitoring sites, each observation is placed automatically into an individual cluster. Clusters are then combined in a stepwise fashion, two at a time, based on their similarity measurement. This agglomerative process continues until all clusters have been joined and the user specifies an end target number of clusters (e.g. seven clusters) (Hair et al., 2006).
priori how many outlier sites might exist in the dataset, and so they were identified by a two-step process. First, poten-tial outlier sites were identified by a sharp change in slope on the agglomeration-distance plot, as is typical in many applications of HCA (Timm, 2002). Second, following a standard approach for outlier detection (Helsel and Hirsch, 1992), sites were confirmed as outliers if, for each parameter considered in HCA, their concentrations were more than two times the median absolute deviation greater or less than the median across all non-outlier sites. Outlier sites identified in this way were removed to prevent them biasing further sta-tistical analysis, but their hydrochemistry is discussed sepa-rately in Sect. 4.1.
Following the exclusion of outlier sites, the remaining sites were subjected to further clustering using Ward’s link-age method. Ward’s linklink-age method evaluates the distance between clusters using an analysis of variance procedure and has been found by other studies to create smaller and more distinct clusters than other linkage rules (Cloutier et al., 2008; Daughney and Reeves, 2005).
PCA was also employed to evaluate the water chemistry dataset. PCA is a statistical method that reduces data sets without removing underlying patterns or variance of the orig-inal data (Wackernagel, 2003). PCA achieves this by iden-tifying components that statistically explain variance in the original data set (Hagg and Westrich, 2002). PCA was con-ducted using site specific median values for the eight param-eters included in HCA, plus log-transformed median con-centrations for the analytes Fe, total reactive phosphorous, NO3 and NH4. All input variables were standardised by z-scoring according to Eq. (2) prior to PCA. In order to reduce the overlap of water quality parameters over the principal components, a varimax rotation was conducted to produce either extreme negative, extreme positive, or near-zero load-ings (Davis, 1986). Following the established Kaiser crite-rion, only components with an eigenvalue greater than 1 were retained.
4 Results and discussion 4.1 Hierarchical cluster analysis
Eight monitoring sites with unusual hydrochemistry were identified using the Nearest Neighbour linkage rule and were excluded from further HCA. The hydrochemistry of these outlier sites is summarised in Table 1. There are no obvi-ous spatial correlations of these sites within the Wairarapa valley. This suggests that the unusual chemistry displayed at these sites is not influenced by a spatially distributed set of processes such as lithology or land use. All but one of these outlier sites had been sampled only once. It is therefore likely that analytical results from these outlier sites are biased by sampling or data reporting errors, despite having CBE within the acceptable range. One outlier site, S27/0442, had
Fig. 4.Dendrogram for the 246 groundwater (GW) and 22 surface water (SW) monitoring sites from the Wairarapa Valley classified into seven clusters. Based on the format of Cloutier et al. (2008).
been sampled more than twelve times and is shown to display hydrochemistry that is consistent with extremely evolved groundwaters. Because this investigation aims to identify areas of groundwater-surface water interaction, which is ex-pected to involve relatively fresh waters, the exclusion of this site is not considered an issue. Although further analysis of these outliers is not warranted in this paper, it should be noted that the outlier sites can still provide important information for understanding the water resources of the study area.
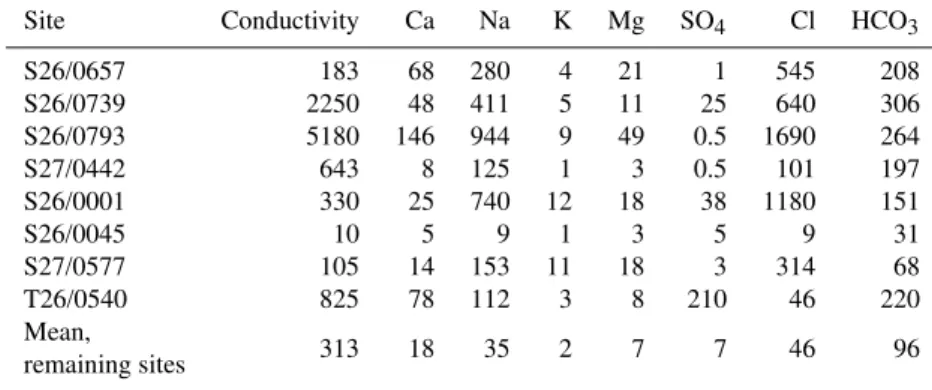
Table 1.Median values of chemical parameters for the eight outlier sites (µS cm−1for conductivity, mg l−1for other parameters). Mean of site-specific median values from the remaining 268 monitoring sites are presented for comparison.
Site Conductivity Ca Na K Mg SO4 Cl HCO3
S26/0657 183 68 280 4 21 1 545 208
S26/0739 2250 48 411 5 11 25 640 306
S26/0793 5180 146 944 9 49 0.5 1690 264
S27/0442 643 8 125 1 3 0.5 101 197
S26/0001 330 25 740 12 18 38 1180 151
S26/0045 10 5 9 1 3 5 9 31
S27/0577 105 14 153 11 18 3 314 68
T26/0540 825 78 112 3 8 210 46 220
Mean,
313 18 35 2 7 7 46 96
remaining sites
4.2 Hydrochemical differences between clusters
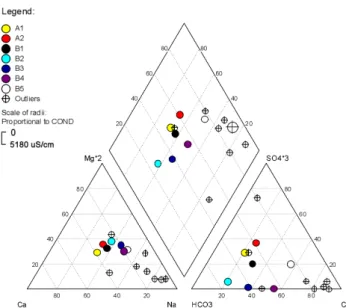
Although HCA can assign monitoring sites to individual clusters based on similarity in their hydrochemical param-eters, information on the specific water quality parameters that distinguish and differentiate each cluster cannot be ex-tracted from a dendrogram (Daughney and Reeves, 2005, 2006). Thus, we examined the hydrochemical characteris-tics of each cluster with the aid of Piper diagrams, Box and Whisker plots and Principal Components Analysis (PCA) (Table 2 and Figs. 5 and 6). Note that the Piper diagram employs exaggerated scales for Mg and SO4; this is simply to aid visual interpretation by increasing separation of points on the diagram, but it means that care must be exercised when evaluating ion ratios based on the position of points in the triangular fields. Selections of additional parameters (e.g. nutrients), not included in the original HCA, were also compared between clusters because they offered further sight into chemical pathways and potential processes that in-fluence groundwater and surface water bodies (Dahm et al., 1998; Freeze and Cherry, 1979).
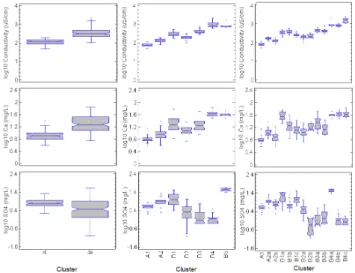
The seven clusters identified by HCA were largely differ-entiated by their TDS concentrations (determined by summa-tion of major ion concentrasumma-tions), redox condisumma-tion (inferred from measured concentrations of Fe, Mn, NO3, NH4 and SO4)and major ion ratios (Fig. 7). Concentrations of ma-jor ions, TDS and electrical conductivity progressively in-creased in the following cluster sequence A1-A2-B1-B2-B3-B5-B4 (Table 2 and Fig. 5). This indicates waters assigned to clusters A1–B1 are generally dilute and can be inter-preted as young whereas those assigned to the latter clus-ters most likely reflect older waclus-ters (see Daughney et al., 2010 and further discussion below). Concentrations of SO4 and NO3 showed an inverse sequence to that of the other ions, with SO4 concentrations statistically highest in clus-ters B1 and B5 and NO3concentrations highest in cluster A2 (Fig. 5). Groundwaters assigned to clusters B3 and B4
dis-played low concentrations of SO4, indicating highly reduced waters. The deepest groundwater sites tended to be assigned to clusters B3 and B4, with shallow wells assigned to clus-ters A1 and A2. The descriptive statistics and Piper diagrams indicate the ratio of major ions varied between clusters, with clusters A1, B1 and B2 largely dominated by Ca and HCO3 (Fig. 6). Waters assigned to the remaining clusters tended to display higher Na to Ca and higher Cl to HCO3, reflecting the importance of sedimentary lithology, evaporative concentra-tion, ion exchange processes and/or older evolved groundwa-ters higher in Na and Cl.
Table 2.Assignment of surface water (SW) and groundwater (GW) monitoring sites to hydrochemical clusters and mean values of chemical parameters for each cluster.
Cluster SW GW EC Ca HCO3 Na Cl Mg K SO4 TDS*
µS cm−1 mg l−1 mg l−1 mg l−1 mg l−1 mg l−1 mg l−1 mg l−1 mg l−1
A1 8 26 77.1 6.5 26.6 6.1 6.5 1.5 0.7 4.1 51.9
A2 10 65 135.5 9.0 29.8 10.7 11.0 3.1 1.3 7.5 72.5
B1 4 50 300.9 19.8 93.5 27.7 33.3 6.5 2.1 10.1 193
B2 0 44 198.0 12.0 90.7 20.9 15.3 5.7 1.2 2.0 147.9
B3 0 30 421.2 18.0 149.3 46.9 52.2 9.6 2.8 1.0 279.8
B4 0 26 979.4 42.7 251.6 119.3 176.2 19.2 5.8 0.8 605.4
B5 0 5 911.1 40.2 156.3 136.2 214.6 22.2 3.0 34.4 450.6
* TDS column determined by summation of major cations and anions (Ca, HCO3, Na, Cl, K, Mg and SO4).
Fig. 5. Box-Whisker plots showing the variations across the seven clusters (A1–B5) for selected water quality parameters and bore depth (m). Parameters include both those used as input to HCA and additional parameters not included in HCA but considered in later analysis.
the lowest separation threshold. Figure 8 shows little sta-tistical difference for a range of parameters across the var-ious sub-clusters (e.g. Ca cannot be statistically differenti-ated amongst clusters B4b–c, B1a–c, B2a–b, B3a–b). This highlights the over-sensitivity of a threshold that yields 13 clusters, and the lack of additional insight provided. It is therefore deemed appropriate to remain with seven clusters, due to the statistically significant differences in most param-eters between these clusters and the feasible presentation of results.
Fig. 6. Piper diagram showing the variation of mean values for major ions (see Table 2) amongst the seven defined clusters and eight outlier sites. Mg and SO4scales are exaggerated to increase separation of points on the diagram; circles in center diamond are proportional to conductivity.
Table 3. Principal component weightings and explained variance for the two significant components. Component scores presented in bold show the highest weighting for each component.
Component 1 Component 2 (Water-rock interaction) (Oxidation-reduction)
log10(NH4) 0.491 0.729
log10(HCO3) 0.769 0.456
log10(Ca ) 0.863 0.096
log10(Cl) 0.907 0.223
log10(Conductivity) 0.934 0.222
log10(Fe) 0.300 0.798
log10(Mg) 0.896 0.277
log10(Mn) 0.406 0.722
log10(NO3) −0.148 −0.775
log10(P) 0.113 0.584
log10(K) 0.835 0.073
log10(Na) 0.903 0.303
log10(SO4) 0.028 −0.730
Explained Variance (%) 57.5 15.8 Cumulative % of variance 57.5 73.3
dataset and displays strong positive weightings of NH4, Fe and Mn and strong negative weightings of NO3 and SO4, highlighting the importance of different redox conditions. The third component is not considered to be significant be-cause it has an eigenvalue of 0.8 and explains only 6.9 % of the variation in the dataset.
Figure 9 shows the principal component scores for all sites assigned to each of the hydrochemical clusters. Waters as-signed to clusters A1 and A2 showed negative loadings for both Components 1 and 2, suggesting these waters are fresh, low in solutes and oxic with the presence of NO3and SO4. In
contrast, sites assigned to clusters B1–B5 tend to show a pos-itive loading for Component 2, suggesting a shift to anoxic conditions and the presence of Fe, Mn and NH4 as redox condition decreases. An inverse relationship exists between TDS and redox condition, with highly evolved waters with high TDS tending to lack NO3and SO4, which is be expected for many groundwater systems (e.g. cluster B4) (Freeze and Cherry, 1979).
Fig. 7.Simplified schematic representation of differences amongst the seven clusters (A1–B5) in relation to their TDS, aquifer depth and redox condition. Scales of axes are simplified representations of increase only.
Fig. 8.Box-Whisker plots showing the variations in electrical con-ductivity, Ca and SO4across the two, seven or thirteen clusters de-fined at different separation thresholds shown in Fig. 4.
4.3 Identifying areas of groundwater-surface water interaction
From the areal distribution of sites assigned to each clus-ter, the groundwater and surface water bodies within the Wairarapa valley can be separated into two main areas based on hydrochemistry: (1) the upper and middle valley and (2) the lower valley (Fig. 11). Surface water and groundwater monitoring sites assigned to clusters A1, A2, B1 and B2 are largely located within the upper and middle valley whereas groundwater sites assigned to clusters B3–B5 are located al-most entirely in the lower Wairarapa valley. These two ar-eas largely reflect the level of aquifer confinement, which may in turn influence the degree of groundwater-surface wa-ter inwa-teraction. In the following discussion, we aim to test
Fig. 9. Plot of principal component scores for Components 1 and 2 for all sites assigned to each of the seven clusters identified by HCA.
the hypothesis that similarities in hydrochemistry between groundwater and surface water may be the result of interac-tion between them for at least some types of hydrochemical signatures observed in the study area.
Groundwaters are inferred to provide base flow to some river systems in the upper and middle Wairarapa valley, based on hydrochemical similarities of sites assigned to clus-ter A2. There are 65 groundwaclus-ter monitoring sites assigned to cluster A2, most of which are 10–30 m deep and lo-cated within Q2 alluvial fan deposits. When compared to monitoring sites assigned to cluster A1, sites assigned to cluster A2 have slightly higher median values of all major ions, higher electrical conductivity, higher NO3, higher Na relative to Ca, and higher Cl relative to HCO3. This hy-drochemistry could suggest that groundwaters assigned to cluster A2 receive recharge from rainfall, because Na, Cl, and NO3 accumulate as rainwater moves through the soil column (Rozemeijer and Broers, 2007; Whittemore et al., 1989). This inferred source of recharge is supported by mea-sured concentrations of excess air, which also imply rain-fall recharge, although the availableδ18O data suggest that A2-type groundwaters receive at least some recharge from rivers (Fig. 10). Groundwater-surface water interaction can be inferred from monitoring sites in gaining reaches of rivers such as the Mangatarere, lower Whangaehu and Ruama-hanga, which have the same Na-Cl-NO3 signature and are also assigned to cluster A2. Hiscock (2005) reported a sim-ilar transfer of chemical signature from rainfall-recharged groundwaters into stream base flow.
The rivers that drain the eastern Wairarapa foothills (e.g. Whangaehu, Huangarua and Taueru Rivers) may also pro-vide recharge to underlying groundwater systems. Moni-toring sites on these rivers near their emergence from the eastern foothills are assigned to cluster B1. B1-type waters display a considerably higher TDS and major ion concen-trations in comparison to those rivers that drain the west-ern ranges (e.g. cluster A1). This increased concentration of solutes in B1-type rivers likely derives from the easily eroded Pliocene marine sedimentary lithology of the eastern hills, relative to the chemically more resistant Mesozoic Tor-lesse greywacke that forms the western ranges. There are 50 groundwater monitoring sites also assigned to cluster B1. Many of the B1-type groundwater sites are in Q1 and Q2 al-luvial gravels along the eastern periphery of the Wairarapa valley, near the river systems that drain the eastern foothills; other B1-type groundwater sites occur as small groupings lo-cated in the Parkvale and Te Ore Ore Basins (Fig. 11). These groundwater sites show a greater average well depth relative to A1 and A2 groundwaters, and elevated concentrations of Mn, Fe and NH4, which suggest anoxic conditions. Values of δ18O and excess air indicate that B1-type groundwaters may be sourced from river recharge, rainfall recharge or a mixture of the two (Fig. 10). Hence the similarity of hy-drochemistry between groundwaters and rivers assigned to cluster B1 does not necessarily indicate groundwater-surface water interaction. In some locations, groundwaters may be recharged from neighbouring B1 surface waters, and/or in other locations these aquifers may be hosted by chemically reactive aquifer materials, including alluvium derived from
-8 -7 -6 -5
δ δδ
δ18O (per mil)
-6 -4 -2 0 2 4 6 8 10 E x c e s s A ir ( m L a t S T P /k g ) 1 40 1 1.5 40 32 2 1 1.5 45 60 >150 55 >150 40 >150 40 40 >150 A1 A2 B1 B2 B3 B4
Fig. 10. Relationships between the hydrochemical clusters defined in this study and previous measurements ofδ18O, excess air (based on measured concentrations of dissolved nitrogen and argon) and mean residence time (in years, shown by the data point labels, and based on measured concentrations of tritium, chlorofluorocarbons and sulfur hexafluoride).
the Miocene-Pliocene marine deposits in the eastern hills. Interaction between groundwater and surface water is not clearly indicated among the sites assigned to cluster B2. Groundwater sites assigned to cluster B2 may receive some recharge from the easterly draining river systems, because they share a similar hydrochemistry as those surface wa-ters assigned to cluster B1. However, these groundwater sites typically have slightly lower concentrations of major ions and higher concentrations of NH4, Fe and Mn. These higher concentrations, coupled with the observed low SO4 concentrations, suggest that B2-type waters are anoxic, with sulphate reduction occurring at some sites. Groundwaters assigned to cluster B2 are of shallow to moderate depth and show considerable spatial agglomeration in the Park-vale basin (Fig. 11). The sequence of Q3, Q5, Q6 and Q8 sediments in the basin may present various confining layers of silty gravels and clay that reduce oxygen supply to these deeper groundwaters.
Fig. 11. Spatial distribution of groundwater and surface water monitoring sites assigned to seven hydrochemical clusters in the Wairarapa Valley, New Zealand. Distribution is shown in regards to pre-determined river interacting properties; losing, gaining and neutral (Jones and Gyopari, 2006).
6) (Daughney et al. 2010), consistent with the results of Mor-genstern (2005) (Fig. 10). This is further supported by clus-ter B3-B5 monitoring sites showing high loadings for Com-ponent 1 (Fig. 9). Concentrations of all analytes are higher in B4-type waters, and the increased concentrations of Mn, NH4and Fe coupled with reduced NO3and SO4 indicate a heavily reduced anoxic environment with little connection to the atmosphere or overlying surface water systems (Taylor et al., 1989). This is likely due to the deep confining layers of marine and estuarine sediment. Values ofδ18O and excess air suggest that recharge to these groundwater sites is pro-vided rainfall recharge that has percolated through overlying groundwater units.
Five groundwater sites located at the outlet and east of Lake Wairarapa are assigned to cluster B5 and display a Na-Cl water type with high TDS and conductivity. However, these wells are shallow to moderate in depth, and low con-centrations of K, HCO3, Mn, Fe, coupled with high NO3 and SO4suggest these sites are oxygen rich, a phenomenon
unlikely to occur in older chemically evolved groundwaters. Saltwater intrusion is the likely cause of high Na, Cl, SO4 and subsequent conductivity at sites located by Lake Onoke. Other relatively shallow B5 groundwaters further inland may be influenced by some degree of groundwater-surface wa-ter inwa-teraction. For example, leaching from fertilizer inputs may have caused elevated SO4exhibited in these groundwa-ters. The hydrochemistry of these groundwaters might also be affected by interaction with localised volcanic deposits (McLaren and Cameron, 1996; Stanton, 1972). There are no δ18O or excess air measurements that can constrain recharge source for these B5-type groundwaters.
5 Conclusions and implications
Identifying areas of groundwater-surface water interaction is crucial for effective environmental management because this interaction is known to influence the quantity and quality of both groundwater and surface water. This study utilised well-established multivariate statistical methods in a novel manner, to uniquely group surface water and groundwater monitoring sites from the Wairarapa valley of New Zealand into seven hydrochemical clusters, and identify potential ar-eas and mechanisms of interaction based on hydrochemical similarities.
A two-stage HCA linkage approach was employed to firstly identify sites with unusual hydrochemistry (Nearest Neighbour Linkage rule) and group the remaining 268 sur-face water and groundwater sites into seven clusters, based on similarities in their hydrochemistry (Ward’s Linkage method). Surface water and groundwater monitoring sites were grouped together in three (A1, A2 and B1) of the seven clusters with the inference made that similarities in hydro-chemistry may indicate potential interaction. PCA and Box and Whisker plots were used to determine the hydrochemical differences between the seven clusters. Clusters were largely differentiated by their concentrations of TDS, redox condi-tion and ratio of major ions. PCA revealed two components, which explained a combined 73.3 % of the variability in the dataset. Component 1, characterized by high loadings for the major ions, was related to natural mineral dissolution and the degree of water evolution or concentration of TDS. Compo-nent 2 had high loadings for NH4, Fe and Mn and negative loadings for NO3and SO4, indicating the importance of re-dox reactions and the presence of both aerobic and anaerobic waters in the Wairarapa valley.
groundwater and surface water. Likewise, surface waters such as the Whangaehu and Taueru Rivers that drain the Pleistocene sedimentary geology of the eastern hills were grouped with similar Ca-HCO3groundwaters in cluster B1. These surface water sites had slightly elevated concentrations of TDS in comparison to other surface waters in the area, a phenomenon that likely reflects the marine sedimentary lithology of the eastern hills. B1-type groundwaters were located in close proximity to losing reaches of these river systems on the eastern side of the valley and showed in an in-crease in concentrations of Mn, Fe and NH4concentrations, suggesting the onset of slightly anoxic conditions. It is pos-sible that recharge is provided to these groundwaters from overlying B1-type surface waters. Groundwater monitoring sites that displayed a rainfall recharged chemical signature with higher Na relative to Ca, higher Cl relative to HCO3 and an accumulation of NO3were grouped with gaining river reaches such as the Mangatarere stream in cluster A2. This grouping suggests the provision of groundwater base flow to these river systems and the transfer of this chemical signature from underlying A2-type groundwater systems. The drivers of hydrochemistry inferred from major and minor element data are consistent with previous measurements of recharge source and water age (Morgenstern, 2005).
The hydrochemical techniques used in this study did not reveal surface water and groundwater interaction in the lower Wairarapa valley. Here, deep anoxic aquifers, high in TDS with a distinct Na-Cl signature, were grouped together in clusters B3–B5, but showed no apparent link to surface wa-ter sites. These groundwawa-ters were largely restricted to the lower Wairarapa valley, an area dominated by various mud and estuarine confining layers. Five groundwater sites were assigned to cluster B5 and showed a similar hydrochemical signature to those sites assigned to clusters B3 and B4. How-ever, B5-type groundwaters were relatively shallow, and high concentrations of SO4 suggest seawater intrusion, anthro-pogenic contamination and/or a localised volcanic lithology as sources of Na and Cl.
The main assumption upon which this study is based is that similarities in hydrochemistry can be used to infer groundwater-surface water interaction. Although this as-sumption is extensively made in the literature (e.g. Burden, 1982; Kumar et al., 2009; Taylor et al., 1989), it is possible that hydrochemical similarities are due to other phenomena such as similar flow paths, similar regional geology or similar episodes and styles of contamination. It is therefore useful to support findings from this method with other investiga-tive approaches such as the quantification of flow loss/gain on river systems, or measurement ofδ18O, excess air, water age and temperature. In terms of this paper, findings support existing classification of river systems determined using con-current surface water flow gaugings (e.g. Jones and Gyopari, 2006).
This investigation and the grouping of groundwater and surface water bodies was entirely based on a historic dataset
from the Wairarapa valley, a dataset that encapsulated sig-nificant timescales and a variety of water quality parame-ters. It is important to note the limitations of our dataset, in particular the variability of parameters collected at each monitoring site, data quality issues surrounding the collec-tion and maintenance of the original dataset and the use of median values to simplify temporal timescales. Despite these limitations, HCA was still able to extract meaningful relationships between the site-specific median values of the eight parameters included in the clustering algorithm. When coupled with Box and Whisker plots and PCA, which anal-ysed a range of additional parameters, HCA results were successfully able to identify distinct hydrochemical clusters that were used to infer potential areas and mechanisms of groundwater-surface water interaction. This highlights the potential of these methodologies as a preliminarily tool to explore groundwater-surface water interaction at a regional scale using existing datasets that may be of poor quality or resolution. However, in order to establish the extent to which these methodologies are applicable in various hydro-climatic regimes and watersheds, and with data of various quality lev-els, continued cluster attempts need to be undertaken. Fur-ther, HCA outputs and interpretations of hydrochemical clus-ters and potential areas of groundwater-surface water inter-action should be supplemented with findings from other in-vestigative techniques such as measurement ofδ18O, excess air, water age, stream temperature and stage quantification. As noted by Kalbus et al. (2006), in order to reduce the limitations and uncertainties that surround the investigation of groundwater-surface water interaction, a multi-scale ap-proach that utilises various methods should be employed.
This paper does not attempt to investigate temporal vari-ability in water quality, hence the use of site specific medi-ans, and therefore encourages those wishing to employ a sim-ilar methodology to undertake multiple clustering attempts with data from different timescales (e.g. base flow and storm flow). Similar approaches in local scale studies have been executed by Kumar et al. (2009) and Thyne et al. (2004), which demonstrate that monitoring sites can show temporal variability in water quality and shift between cluster group-ings. It is essential for future research to determine the im-pact that this temporal shift in cluster assignment is likely to have on the interpretation of surface water and groundwater interaction.
evo-lution and anthropogenic contamination at a regional scale as has been demonstrated by G¨uler and Thyne (2004) and Thyne et al. (2004). From a water management perspective, our study presents a rapid and cost-effective starting means by which the interaction between groundwater and surface water could be identified and investigated using water qual-ity data alone.
Acknowledgements. This project was supported by a grant from the
New Zealand Foundation for Research, Science and Technology (Contract C05X0906). The authors are grateful to the Greater Wellington Regional Council, which provided additional funding, logistical support and the initial dataset for this project. The authors thank Editor Jes´us Carrera and five anonymous reviewers for helpful comments that improved this manuscript.
Edited by: J. Carrera
References
Adar, E. M., Rosenthal, E., Issar, A. S., and Batelaan, O.: Quantita-tive assessment of the flow pattern in the southern Arava Valley by environmental tracers and a mixing cell model, J. Hydrol., 136, 333–352, 1992.
Alther, G. A.: A simplified statistical sequence applied to routine water quality analysis: A case history, Ground Water, 17, 556– 561, 1989.
Banoeng-Yakubo, B., Yidana, S. M., and Nti, E.: Hydrochemical analysis of groundwater using multivariate statistical methods – The Volta Region, Ghana, J. Civ. Eng., 13, 55–63, 2009. Begg, J. G., Brown, L. J., Gyopari, M., and Jones, A.: A review
of Wairarapa geology – with a groundwater bias, Institute of Ge-ological and Nuclear Science Report CR2005/159, Wellington, New Zealand, 2005.
Berner, E. K. and Berner, R. A.: Global environment: Water, air and geochemical cycles, Prentice-Hall, New Jersey, 1996. Burden, R. J.: Hydrochemical variation in a water-table aquifer
be-neath grazed pastureland, J. Hydrol., 21, 61–75, 1982.
Cloutier, V., Lefebvre, R., Therrien, R., and Savard, M. M.: Mul-tivariate statistical analysis of geochemical data as indicative of the hydrogeochemical evolution of groundwater in a sedimentary rock aquifer system, J. Hydrol., 353, 294–313, 2008.
Dahm, C. N., Grimm, N. B., Marmonier, P., Valette, H. M., and Vervier, P.: Nutrient dynamics at the interface between sur-face waters and groundwaters, Freshwater Biology, 40, 427–451, 1998.
Daughney, C. J.: Spreadsheet for automatic processing of water quality data: Theory, use and implementation in Excel, Institute of Geological and Nuclear Science Report SR2005/35, Welling-ton, New Zealand, 2005.
Daughney, C. J.: Spreadsheet for automatic processing of water quality data: 2007 update, Institute of Geological and Nuclear Science Report SR2007/17, Wellington, New Zealand, 2007. Daughney, C. J.: Multivariate statistical methods for assessment
of groundwater chemistry between the Waingawa and Waiohine Rivers, Wairarapa Valley, Institute of Geological and Nuclear Science Report SR2007/19, Wellington, New Zealand, 2007. Daughney, C. J.: Hydrochemical classification of groundwater and
river state of the environment monitoring sites in the Greater
Wellington region. Institute of Geological and Nuclear Science Report SR2009/68, Wellington, New Zealand, 2010.
Daughney, C. J. and Reeves, R. R.: Definition of hydrochemical fa-cies in the New Zealand National Groundwater Monitoring Pro-gramme, J. Hydrol., 44, 104–130, 2005.
Daughney, C. J. and Reeves, R. R.: Analysis of temporal trends in New Zealand’s groundwater quality based on data from the National Groundwater Monitoring Programme, J. Hydrol., 45, 41–62, 2006.
Daughney, C. J., Morgenstern, U., van der Raaij, R., and Reeves, R. R.: Discriminant analysis for estimation of groundwater age from hydrochemistry and well construction: Application to New Zealand aquifers, Hydrogeol. J., 18, 417–428, 2010.
Davis, J. C.: Statistics and data analysis in geology, John Wiley & Sons, New York, 1986.
Delgado-Outeiri˜no, I., Araujo-Nespereira, P., Cid-Fern´andez, J. A., Mejuto, J. C., Mart´ınez-Carballo, E., and Simal-G´andara, J.: Classification of thermal waters based on their inorganic finger-print and hydrogeothermal modelling, Hydrol. Earth Syst. Sci. Discuss., 8, 4559–4581, doi:10.5194/hessd-8-4559-2011, 2011. de Louw, P. G. B., van der Velde, Y., and van der Zee, S. E. A. T.
M.: Quantifying water and salt fluxes in a lowland polder catch-ment dominated by boil seepage: a probabilistic end-member mixing approach, Hydrol. Earth Syst. Sci., 15, 2101–2117, doi:10.5194/hess-15-2101-2011, 2011.
Demlie, M., Wohnlich, S., Wisotzky, F., and Gizaw, B.: Ground-water recharge, flow and hydrogeochemical evolution in a com-plex volcanic aquifer system, central Ethiopia, Hydrogeol. J., 15, 1169–1181, 2007.
Freeze, R. A. and Cherry, J. A.: Groundwater, Prentice-Hall, New Jersey, 1979.
G¨uler, C. and Thyne, G. D.: Delineation of hydrochemical facies distribution in a regional groundwater system by means of fuzzy c-means clustering, Water Resour. Res., 40, 1–11, 2004. G¨uler, C., Thyne, G. D., and McCray, J. E.: Evaluation of
graphi-cal and multivariate statistigraphi-cal methods for classification of water chemistry data, Hydrogeol. J., 10, 455–474, 2002.
Haag, I. and Westrich, B.: Processes governing river water quality identified by principal component analysis, Hydrol. Process., 16, 3113–3130, 2002.
Hair, J. F., Black, W. C., Babin, B. J., Anderson, R. E., and Tatham, R. L.: Multivariate data analysis, Prentice Hall, New Jersey, 2006.
Hawke, R., McConchie, J., and Trueman, T.: Wairarapa irrigation study: Moisture availability as a result of the climate. School of Earth Sciences Research Report, Victoria University of Welling-ton, WellingWelling-ton, New Zealand, 2000.
Heaton, T. H. E. and Vogel, J. C.: “Excess air” in groundwater, J. Hydrol., 50, 201–216, 1981.
Helsel, D. R. and Cohn, T. A.: Estimation of descriptive statistics for multiply censored water quality data, Water Resour. Res., 24, 1997–2004, 1988.
Helsel, D. R. and Hirsch, R. M.: Statistical methods in water re-sources, Studies in Environmental Science, 49, Elsevier, Ams-terdam, 1992.
Scientific Investigations Report 2010–5229, United States Geo-logical Survey, Reston, Virginia, 2010.
Hiscock, K.: Hydrogeology: Principles and practice, Blackwell Science, Oxford, 2005.
Hugenschmidt, C., Ingwersen, J., Sangchan, W., Sukvanachaikul, Y., Uhlenbrook, S., and Streck, T.: Hydrochemical analysis of stream water in a tropical, mountainous headwater catchment in northern Thailand, Hydrol. Earth Syst. Sci. Discuss., 7, 2187– 2220, doi:10.5194/hessd-7-2187-2010, 2010.
Jones, A. and Baker, T.: Groundwater monitoring technical report, Greater Wellington Regional Council, Wellington, New Zealand, 2005.
Jones, A. and Gyopari, M.: Regional conceptual and numerical modelling of the Wairarapa groundwater basin, Greater Welling-ton Regional Council, WellingWelling-ton, New Zealand, 2006. Kalbus, E., Reinstorf, F., and Schirmer, M.: Measuring methods for
groundwater surface water interactions: a review, Hydrol. Earth Syst. Sci., 10, 873–887, doi:10.5194/hess-10-873-2006, 2006. Kamp, P. J. J.: Landforms of Wairarapa, in: A geological
perspec-tive, edited by: Soons, J. M. and Selby, M. J., Landforms of New Zealand, Longman Paul, Auckland, New Zealand, 1992. Kim, J. H., Kim, R. H., Lee, J., and Chang, H. W.:
Hydrogeo-chemical characterization of major factors affecting the quality of shallow groundwater in the coastal area at Kimje in South Ko-rea, Environmental Geology, 44, 478–489, 2003.
Koh, D.-C., Chae, G.-T., Yoon, Y.-Y., Kang, B.-R., Koh, G.-W., and Park, K.-H.: Baseline geochemical characteristics of groundwa-ter in the mountainous area of Jeju Island, South Korea: Impli-cations for degree of mineralization and nitrate contamination, J. Hydrol., 376, 81–93, 2009.
Kumar, M., Ramanathan, A., and Keshari, A. K.: Understanding the extent of interactions between groundwater and surface wa-ter through major ion chemistry and multivariate statistical tech-niques, Hydrol. Process., 23, 297–310, 2009.
Laudon, H. and Slaymaker, O.: Hydrograph separation using stable isotopes, silica and electrical conductivity: An alpine example, J. Hydrol., 201, 82–101, 1997.
Lautz, L. K. and Fanelli, R. M.: Seasonal biogeochemical hotspots in the streambed around restoration structures, Biogeochemistry, 91, 85–104, 2008.
McConchie, J.: From shaky beginnings, in: Dynamic Wellington: A contemporary synthesis and explanation of Wellington, edited by: McConchie, J., Winchester, D. R., and Willis, R., Institute of Geography: Victoria University of Wellington, Wellington, New Zealand, 2000.
McLaren, R. G. and Cameron, K. C.: Soil science, Oxford Univer-sity Press, Oxford, 1996.
McNeil, V. H., Cox, M. E., and Preda, M.: Assessment of chemical water types and their spatial variation using multi-stage cluster analysis, Queensland, Australia, J. Hydrol., 310, 181–200, 2005. Mencio, A. and Mas-Pla, J.: Assessment by multivariate analysis of groundwater-surface water interactions in urbanized Mediter-ranean streams, J. Hydrol., 352, 355–366, 2008.
Morgenstern, U.: Wairarapa Valley groundwater – Residence time, flow pattern, and hydrochemistry trends, Institute of Geologi-cal and Nuclear Science Report SR2005/53, Wellington, New Zealand, 2005.
Panda, U. C., Sundaray, S. K., Rath, P., Nayak, B. B., and Bhatta, D.: Application of factor and cluster analysis for characterization
of river and estuarine water systems – A case study: Mahanadi River (India), J. Hydrol., 331, 434–445, 2006.
Reily, J. A., Steinhorst, R. K., Winter, G. V., and Williams, R. E.: Statistical analysis of the hydrochemistry of ground waters in Colombia River Basalts, J. Hydrol., 119, 245–262, 1990. Ritzi, R. W., Wright, S. L., Mann, B., and Chen, M.: Analysis of
temporal variability in hydrogeochemical data used for multivari-ate analyses, Ground Wmultivari-ater, 31, 221–229, 1993.
Rozemeijer, J. C. and Broers, H. P.: The groundwater contribution to surface water contamination in a region with intensive agri-cultural land use (Noord-Brabant, The Netherlands), Environm. Pollut., 148, 695–706, 2007.
Schmidt, A., Gibson, J. J., Santos, I. R., Schubert, M., Tattrie, K., and Weiss, H.: The contribution of groundwater discharge to the overall water budget of two typical Boreal lakes in Al-berta/Canada estimated from a radon mass balance, Hydrol. Earth Syst. Sci., 14, 79–89, doi:10.5194/hess-14-79-2010, 2010. Sophocleous, M.: Interactions between groundwater and surface
water: The state of science, Hydrogeol. J., 10, 52–67, 2002. Stanton, R. L.: Sulfides in sediments, in: The Encyclopedia of
Geo-chemistry and Environmental Sciences, edited by: Fairbridge, R. W., Van Nostrand Reinhold Company, New York, 1972. Taylor, C. B., Wilson, D. D., Brown, L. J., Stewart, M. K.,
Bur-den, R. J., and Brailsford, G. W.: Sources and flow of North Canterbury Plains groundwater, New Zealand, J. Hydrol., 106, 311–340, 1989.
Thyne, G. D., G¨uler, C., and Poeter, E.: Sequential analysis of hy-drochemical data for watershed characterization, Ground Water, 42, 711–723, 2004.
Timm, N. H.: Applied multivariate statistics, Springer-Verlag, New York, 2002.
V´azquez-Su˜n´e, E., Carrera, J., Tubau, I., S´anchez-Vila, X., and Soler, A.: An approach to identify urban groundwater recharge, Hydrol. Earth Syst. Sci., 14, 2085–2097, doi:10.5194/hess-14-2085-2010, 2010.
Venugopal, T., Giridharan, L., and Jayaprakash, M.: Groundwa-ter quality assessment using chemometric analysis in the Adyar River, South India, Arch. Environ. Contam. Toxicol., 55, 180– 190, 2008.
Wackernagel, H.: Multivariate geostatistics: An introduction with applications, Springer, New York, 2003.
Watts, L.: Hydrological monitoring technical report, Greater Wellington Regional Council, Wellington, New Zealand, 2005. Whittemore, D. O., McGregor, K. M., and Marotz, G. A.: Effects
of variations in recharge on groundwater quality, J. Hydrol., 106, 131–145, 1989.
Winter, T. C., Harvey, J. W., Franke, O. L., and Alley, W. M.: Groundwater and surface water, in: A single resource, edited by: Survey, U. G., US Government Printing Office, Denver, Col-orado, 1998.
Woocay, A. and Walton, J.: Multivariate analyses of water chem-istry: Surface and groundwater interactions, Ground Water, 46, 437–449, 2008.