Characterization of the sulphate mineral amarantite – Fe
3þ
2
ð
SO
4
Þ
O
7H
2
O
using infrared, Raman spectroscopy and thermogravimetry
Ray L. Frost
a,⇑, Andrés López
a, Ricardo Scholz
b, Yunfei Xi
a, Aléssio J. da Silveira
b,
Rosa Malena Fernandes Lima
caSchool of Chemistry, Physics and Mechanical Engineering, Science and Engineering Faculty, Queensland University of Technology, GPO Box 2434, Brisbane, Queensland 4001, Australia bGeology Department, School of Mines, Federal University of Ouro Preto, Campus Morro do Cruzeiro, Ouro Preto, MG 35,400-00, Brazil
cMining Engineering Department, School of Mines, Federal University of Ouro Preto, Campus Morro do Cruzeiro, Ouro Preto, MG 35,400-00, Brazil
h i g h l i g h t s
We have studied the mineral amarantite Fe3þ
2 ðSO4ÞO7H2O.
The Raman spectrum is dominated by an intense band at 1017 cm1.
Very intense Raman band observed at 409 cm1is assigned to them
2 bending modes.
Vibrational spectroscopy enables aspects of the molecular structure of amarantite to be ascertained.
g r a p h i c a l
a b s t r a c t
a r t i c l e
i n f o
Article history:
Received 4 February 2013
Received in revised form 18 April 2013 Accepted 24 April 2013
Available online 18 May 2013
Keywords:
Raman spectroscopy Amarantite Infrared spectroscopy Sulphate
Evaporite
a b s t r a c t
The mineral amarantite Fe3þ
2 ðSO4ÞO7H2O has been studied using a combination of techniques including
thermogravimetry, electron probe analyses and vibrational spectroscopy. Thermal analysis shows decomposition steps at 77.63, 192.2, 550 and 641.4°C. The Raman spectrum of amarantite is dominated by an intense band at 1017 cm1assigned to the SO2
4 m1symmetric stretching mode. Raman bands at 1039, 1054, 1098, 1131, 1195 and 1233 cm1are attributed to the SO2
4 m3antisymmetric stretching modes. Very intense Raman band is observed at 409 cm1 with shoulder bands at 399, 451 and 491 cm1are assigned to them
2bending modes. A series of low intensity Raman bands are found at 543, 602, 622 and 650 cm1are assigned to the m4 bending modes. A very sharp Raman band at
3529 cm1is assigned to the stretching vibration of OH units. A series of Raman bands observed at 3025, 3089, 3227, 3340, 3401 and 3480 cm1are assigned to water bands. Vibrational spectroscopy enables aspects of the molecular structure of the mineral amarantite to be ascertained.
Ó2013 Elsevier B.V. All rights reserved.
Introduction
The mineral amarantite Fe3þ
2 ðSO4ÞO7H2O[1–3]is a sulphate of iron found in arid climates. Amarantite is a very rare mineral and is
only found in very dry localities such as Carocoles, Chile[1,4]. The mineral has been identified in iron sulphate deposits in Iran[5]. The mineral is also known from Mutooroo, Pine Creek – Mutooroo area, Mingary, Olary Province, South Australia, Australia[6]. The mineral is found at Weelhamby Lake, Western Australia and in the Koolyanobbing Greenstone Belt, Western Australia. The reason why the mineral is found in these Australian sites is that these localities are very arid.
1386-1425/$ - see front matterÓ2013 Elsevier B.V. All rights reserved.
http://dx.doi.org/10.1016/j.saa.2013.04.111
⇑ Corresponding author. Tel.: +61 7 3138 2407; fax: +61 7 3138 1804.
E-mail address:r.frost@qut.edu.au(R.L. Frost).
Contents lists available atSciVerse ScienceDirect
Spectrochimica Acta Part A: Molecular and
Biomolecular Spectroscopy
Interest in the study of Fe(II) sulphates arises from at least two perspectives. Firstly the observation of sulphates of iron on Mars by recent exploration and secondly by the formation of Fe(II) and Fe(III) sulphates in evaporite deposits[7]. Studies of these minerals have been undertaken for some considerable time[8–12]. Interest in the chemistry of iron bearing sulphates stems from a number of reasons. Firstly, because of the discovery of jarosites on Mars [13,14]. Such a discovery implies the presence of water on Mars either at present or at some time in the planetary past[15,16]. Interest in such minerals and their thermal stability rests with the possible identification of these minerals and dehydrated para-genetically related minerals on planets and on Mars. There have been many studies on related minerals such as the Fe(II) and Fe(III) sulphate minerals[17–22]. The formation of these minerals can occur through microbiological reduction of pyrite[23,24]. Fe min-erals like Fe2+, Fe3+hydroxysulfate (copiapite); Fe3+oxyhydroxides (goethite); KFe3+hydroxysulfate (jarosite) and Fe3+hydroxysulfate (schwertmannite) that may form as weathering products in pyrite oxidation process. Oxidation rates are dependent on temperature, pH, Eh, relative humidity, and the surface area of reactant pyrite.
One of the difficulties associated with the analysis of Fe(III) sul-phates and related minerals is that they are often lack crystallinity, making detection using X-ray diffraction (XRD) techniques diffi-cult. Vibrational spectroscopic techniques are most useful in over-coming this difficulty. Raman spectroscopy enables the spectra of such minerals to be readily obtained. Most efflorescent minerals such as amarantite are poorly crystalline as the loss of water from the structure causes the materials to become powdered. Another problem associated with the study of Fe(III) and Fe(II) sulphates is their thermodynamic stability [25]. Often, the minerals are formed from acid–sulphate rich environments such as acid mine drainage and acid–sulphate soils and as such their solubility is con-trolled by the climatic conditions in particular temperature. The minerals can precipitate in the day time as the solution evaporates and then redissolves at night when the temperature decreases. Such phenomena results in very complex mineral systems which involve jarosites and other sulphates for example iron(II) sulphates and potassium sulphate. The ability to be able to easily and readily detect these iron sulphate minerals including amarantite is of importance[26,27].
Sulphate minerals are formed by the oxidation of sulphide min-erals by a combination of oxidation, dehydration, and neutraliza-tion reacneutraliza-tions. In sulphate efflorescent deposits gelatinous hydrated hydroxy sulphates such as the sulphate minerals includ-ing jarosites and halotrichites may be formed in solution and pre-cipitate from this solution as a function of the pH and temperature [28]. Such mixed sulphate species will depend upon the tempera-ture and pH of the crystallization[29,30]. A typical deposit is found in the El Jaroso ravine. A recent study characterized jarosites in terms of their UV–Visible and NIR spectroscopy[31]whereas other recent studies have characterized selected evaporate minerals by thermal analysis and Raman spectroscopic techniques [32–35]. Thus it is important to understand the NIR spectroscopy of the efflorescent sulphate minerals jarosites and halotrichites since these minerals are formed in mineral waste deposits, slag wastes and other environmental situations[36–38].
Amarantite is triclinic[2,39,40], which means crystallographi-cally, it has only one symmetry fold. It must be rotated 360°to
be exactly the same. Due to it being triclinic it falls into the biaxial optical class, the axis degrees do not equal 90°and the sides of each
axis are not the same length. Amarantite is anisotropic, which means, the velocity of light varies with crystallographic direction, and, thus, there is more than one refractive index. The objective of this research is to determine the molecular structure using vibrational spectroscopy and to ascertain the thermal stability of the mineral.
Experimental
Samples description and preparation
The amarantite sample studied in this work was obtained from the collection of the Geology Department of the Federal University of Ouro Preto, Minas Gerais, Brazil, with sample code SAB-099. The sample is from the type locality for the mineral, the Caracoles deposit, Sierra Gorda district, Chile. The sample was gently crushed and the associated minerals were removed under a stereomicro-scope Leica MZ4. Scanning electron microscopy (SEM) was applied to support the chemical characterization and ascertain the mor-phology of the mineral.
Scanning electron microscopy (SEM)
Experiments and analyses involving electron microscopy were performed in the Center of Microscopy of the Universidade Federal de Minas Gerais, Belo Horizonte, Minas Gerais, Brazil (http:// www.microscopia.ufmg.br). Amarantite crystals were coated with a 5 nm layer of evaporated Au. Secondary Electron and Backscat-tering Electron images were obtained using a JEOL JSM-6360LV equipment. Qualitative and semi-quantitative chemical analysis in the EDS mode were performed with a ThermoNORAN spectrom-eter model Quest and was applied to support the mineral characterization.
Thermogravimetric analysis – TG/DTG
Thermogravimetric analysis of the amarantite mineral were ob-tained by using TA Instruments Inc. Q50 high-resolution TGA oper-ating at a 10°C/min ramp with data sample interval of 0.50 s/pt
from room temperature to 1000°C in a high-purity flowing
nitro-gen atmosphere (100 cm3/min). A total mass of 36.3 mg of finely ground sample was heated in an open platinum crucible.
Raman microprobe spectroscopy
Crystals of amarantite were placed on a polished metal surface on the stage of an Olympus BHSM microscope, which is equipped with 10, 20, and 50 objectives. The microscope is part of a Renishaw 1000 Raman microscope system, which also includes a monochromator, a filter system and a CCD detector (1024 pixels). The Raman spectra were excited by a Spectra-Physics model 127 He–Ne laser producing highly polarized light at 633 nm and col-lected at a nominal resolution of 2 cm1 and a precision of ±1 cm1in the range between 200 and 4000 cm1. Repeated acqui-sitions on the crystals using the highest magnification (50) were accumulated to improve the signal to noise ratio of the spectra. Raman Spectra were calibrated using the 520.5 cm1line of a sili-con wafer. The Raman spectrum of at least 10 crystals was col-lected to ensure the consistency of the spectra.
Infrared spectroscopy
Infrared spectra were obtained using a Nicolet Nexus 870 FTIR spectrometer with a smart endurance single bounce diamond ATR cell. Spectra over the 4000–525 cm1 range were obtained by the co-addition of 128 scans with a resolution of 4 cm1and a mirror velocity of 0.6329 cm/s. Spectra were co-added to improve the signal to noise ratio.
software package that enabled the type of fitting function to be se-lected and allows specific parameters to be fixed or varied accord-ingly. Band fitting was done using a Lorentzian–Gaussian cross-product function with the minimum number of component bands used for the fitting process. The Gaussian–Lorentzian ratio was maintained at values greater than 0.7 and fitting was undertaken until reproducible results were obtained with squared correlations ofr2greater than 0.995.
Results and discussion
Chemical characterization
The SEM image of amarantite sample studied in this work is shown in the supplementary information as Fig. S1. The crystal shows a prismatic form, with perfect cleavage along (0 1 0). Qualitative chemical composition shows a homogeneous phase, composed by S and Fe. The EDS spectrum is shown in the supple-mentary information as Fig. S2.
To date, there have been no thermal analytical studies of ama-rantite and related minerals[3,41]. There have been some differen-tial thermal analysis studies of a very wide range of sulphates from some years past[42]. The pattern for the thermogravimetric anal-ysis is presented inFig. 1. The TG curve shows a total mass loss of about 61.3% on heating to 1000°C and is in agreement with the
stoichiometric content of H2O and SO3 that correspond to 64.0 wt%. In the temperature range of 25–100°C, is observed a
mass loss of about 5.2%.
The accepted formula by the IMA is Fe3þ
2 ðSO4ÞO7H2O. If the formula is written as per Fe atom, then it may be written as Fe3+(SO
4)(OH)3(H2O).
This mass loss is attributed to the loss of adsorbed water, according to the equation:
Fe3þ
ðSO4ÞðOHÞ 3ðH2OÞ !Fe3þðSO4ÞðOHÞ 2ðH2OÞ þH2O
The mass loss at 77.63°C is assigned to the loss of one water
molecule. The mass loss of 8.1% would be predicted from the for-mula Fe3+(SO
4)(OH) 3(H2O). The mass loss at 192.2 results in a mass loss of 16.66%. This mass loss is attributed to the following chemical reaction:
Fe3þ
ðSO4ÞðOHÞ 2ðH2OÞ !Fe3þðSO4ÞðOHÞ þ2H2O
The mass loss of 16.66% fits well with the predicted mass loss of 16.2%. A small DTG peak is found at 550°C which is assigned to the
loss of OH units according to the following equation:
2Fe3þ
ðSO4ÞðOHÞ !2Fe3þOðSO4Þ þH2O
In the temperature range of 500–650°C a mass loss of 30.43%. A
strong exothermic reaction is observed at 641.4°C. This mass loss
is attributed to the loss of sulphate.
2Fe3þO
ðSO4Þ !Fe2O3þ2SO3
According to this reaction the mass loss of 36% would be predicted based upon the formula Fe3+(SO
4)(OH)3(H2O). A mass loss of 30.43% is observed for this step. The final product of the thermal decomposition of amarantite is hematite.
Vibrational spectroscopy
Background spectroscopy of sulphate
The Raman spectroscopy of the aqueous sulphate tetrahedral oxyanion yields the symmetric stretching (
m
1) vibration at981 cm1, the in-plane bending (
m
2) mode at 451 cm1, the anti-symmetric stretching (
m
3) mode at 1104 cm1and the out-of-planebending (
m
4) mode at 613 cm1[43]. Ross reports theinterpreta-tion of the infrared spectra for potassium alum as
m
1, 981 cm1;m
2, 465 cm1;m
3, 1200, 1105 cm1;m
4, 618 and 600 cm1 [44].Water stretching modes were reported at 3400 and 3000 cm1, water bending modes at 1645 cm1, and water librational modes at 930 and 700 cm1 [45]. The Raman spectrum of the mineral chalcanthite shows a single symmetric stretching mode at 984.7 cm1. Two
m
2 modes are observed at 463 and 445 cm1 and threem
3modes at 1173, 1146 and 1100 cm1. Them
4modeis observed as a single band at 610 cm1. A complex set of overlap-ping bands is observed in the low wavenumber region at 257, 244, 210, 136 and 126 cm1. Recently, Raman spectra of four basic cop-per sulphate minerals, namely antlerite, brochiantite, posnjakite and langite, were published [46]. The SO symmetric stretching modes for the four basic copper sulphate minerals are observed at 985, 990, 972 and 974 cm1. Only the mineral brochantite showed a single band in this region. Multiple bands were observed for these minerals in the antisymmetric stretching region.
Ross also lists the infrared spectra of the pseudo-alums formed from one divalent and one trivalent cation. Halotrichite has
infra-Fig. 1.TG/DTG graphic of amarantite at temperature up to 1000°C.
red bands at
m
1, 1000 cm1;m
2, 480 cm1;m
3, 1121, 1085,1068 cm1;
m
4, 645, 600 cm1. Pickeringite the Mg end member of the halotrichite–pickeringite series has infrared bands at
m
1,1000 cm1;
m
2, 435 cm1;
m
3, 1085, 1025 cm1;m
4, 638, 600 cm1[44]. These minerals display infrared water bands in the OH stretching, 3400 and 3000 cm1 region; OH deformation, 1650 cm1region; OH libration, 725 cm1region. Ross also reports a weak band at960 cm1which is assigned to a second OH libra-tional vibration[44]. As with the infrared spectra, Raman spectra of alums are based on the combination of the spectra of the sulphate and water. Sulphate typically is a tetrahedral oxyanion with Raman bands at 981 (
m
1), 451 (m
2), 1104 (m
3) and 613 (m
4) cm1[47]. Somesulphates have their symmetry reduced through acting as mono-dentate and bimono-dentate ligands[47]. In the case of bidentate behav-ior both bridging and chelating ligands are known. This reduction in symmetry is observed by the splitting of the
m
3 andm
4 intotwo components under C3vsymmetry and three components under
C2vsymmetry. A complex set of overlapping bands is observed in
the low wavenumber region with broad bands observed at 257, 244, 210 136 and 126 cm1. Recently, Raman spectra of four basic copper sulphate minerals, namely antlerite, brochiantite, posnjak-ite and langposnjak-ite, were published[46]. The SO symmetric stretching modes for the four basic copper sulphate minerals are observed at 985, 990, 972 and 974 cm1. Only the mineral brochantite showed a single band in this region. Multiple bands were observed for these minerals in the antisymmetric stretching region.
Vibrational spectroscopy of amarantite
The Raman spectrum of amarantite over the complete wave-number range from 100 to 4000 cm1spectral range is displayed
inFig. 2a. This spectrum shows the position of the peaks and the relative intensities of the bands. It is apparent that there are large parts of the spectrum where no intensity is observed. Therefore the spectrum is subdivided into sections depending upon the type of vibration being studied. The infrared spectrum over the 500– 4000 cm1 spectral range is reported in Fig. 2b. This spectrum shows the relative intensity of the infrared bands and their posi-tion. There are also large parts of the infrared spectrum where no intensity is observed. Hence, the spectrum is subdivided into sec-tions as a function of the type of vibration being examined.
Raman spectroscopy in the 800–1400 cm1spectral range
The Raman spectrum of amarantite in the 800–1400 cm1 spec-tral range is shown inFig. 3a. The spectrum shows a very intense band at 1017 cm1 with a low intensity shoulder band at 1006 cm1
. This band is assigned to the SO2
4
m
1symmetric stretch-ing mode. A series of bands are observed at 1039, 1054, 1098, 1131, 1195 and 1233 cm1. These bands are assigned to the SO24
m
3 anti-symmetric stretching modes. The observation of more than one band in the symmetric stretching region together with multiple antisymmetric stretching vibrations supports the concept of the non-equivalence of the sulphate units in the structure of amaran-tite. The low intensity Raman band at 831 cm1 is probably due to water librational modes. The Raman spectrum of devilline shows a single SO4symmetric stretching band at 1007 cm1. The band is sharp with a bandwidth of 3.1 cm1. The antisymmetric stretching band for devilline is observed at 1134 cm1. In contrast, the Raman spectrum of cyanotrichite shows a single intense band at 976 cm1with a broad low intensity band at 960 cm1. Three antisymmetric stretching bands are observed at 1137, 1101 and 1057 cm1. For glaucocerinite bands are observed at 1007 andFig. 2.(a) Raman spectrum of amarantite over the 100–4000 cm1spectral range
and (b) infrared spectrum of amarantite over the 500–4000 cm1spectral range.
Fig. 3.(a) Raman spectrum of amarantite over the 800–1400 cm1spectral range
981 cm1 for the symmetric stretching bands and at 1129 and 1059 cm1for the antisymmetric stretching vibrations. For serpie-rite a single symmetric stretching mode at 988 cm1is observed and three antisymmetric stretching bands are observed at 1131, 1122 and 1077 cm1. For ktenasite, multiple symmetric stretching bands are observed at 994, 981 and 973 cm1.
Infrared spectroscopy in the 500–1300 cm1spectral range
The infrared spectrum of amarantite in the 500–1300 cm1 spectral range is displayed inFig. 3b. The spectrum consists of a broad spectral profile and is made up of a series of overlapping bands as shown. An intense sharp band is observed at 1000 cm1 with a shoulder band at 986 cm1. These bands are assigned to the
m
1 SO24 symmetric stretching mode. The infrared bandsob-served at 1039, 1080, 1107, 1139 and 1196 cm1are assigned to the
m
3SO24 antisymmetric stretching vibrations. It is noted the Ra-man and infrared bands are almost in the same position. Some low intensity infrared bands are observed at 724, 768, 825 and 845 cm1 and are assigned to water vibrational modes. The two infrared bands at 655 and 661 cm1are SO2
4
m
4bending modes.Raman spectroscopy in the 300–800 cm1and in 100–300 cm1
spectral ranges
The Raman spectrum in the 300–800 cm1and 100–300 cm1 spectral range is reported inFig. 4a and b. The complexity of the antisymmetric stretching region is reflected in the spectra of the
m
2 bending region. A very intense Raman band is observed at409 cm1 with shoulder bands at 399, 451 and 491 cm1. These bands are assigned to the
m
2bending modes. Multiple bands areobserved in the 400–500 cm1region for many minerals and are attributed to the
m
2 bending modes. The observation of severalbending modes is in agreement with the number of antisymmetric stretching vibrations. Bands are observed at 479, 443 and 408 cm1 for cyanotrichite, at 450 and 430 cm1 for devilline, 498 and 471 cm1for glaucocerinite, at 475, 445 and 421 cm1for serpie-rite and at 475 and 449 for ktenasite.
The spectra of antlerite and brochantite are similar as are those for posnjakite and langite in this spectral region [46,48]. The antlerite Raman spectrum shows bands at 485, 469, 440 and 415 cm1 with the latter band having the highest intensity. Bouchard–Abouchacra reported bands for antlerite at 483, 470, 444 and 416 cm1 in excellent agreement with our data [49]. Raman spectra of brochantite are similar except that additional bands at 517 and 501 cm1are observed. The Raman spectra of posnjakite show bands at 511, 482, 447, 422, 386 and 363 cm1. This complex set of bands in this region is also observed for langite with bands observed at 507, 481, 449, 420, 391 cm1. The Raman spectrum of wroewulfeite shows a complex set of overlapping bands at 472, 457, 443 and 415 cm1. The observation of additional bands over and above that which would be predicted for the sul-phate anion (a single band at 451 cm1), may be attributed to a number of factors including symmetry reduction, local stress in the crystals and crystal orientation effects.
A series of low intensity Raman bands are found at 543, 602, 622 and 650 cm1are assigned to the
m
4bending modes. The Ra-man spectrum of ktenasite shows a single peak in the
m
4 regionat 604 cm1. The Raman spectrum of devilline shows two low intensity bands at 668 and 617 cm1; cynaotrichite two overlap-ping bands at 594 and 530 cm1; the Raman spectrum of glauco-cerinite shows two bands at 694, 613 and 555 cm1. The complexity of the symmetric and antisymmetric bending region shows a reduction in symmetry for these complex sulphate
miner-Fig. 4.(a) Raman spectrum of amarantite over the 300–800 cm1spectral range
and (b) Raman spectrum of amarantite over the 100–300 cm1spectral range.
Fig. 5.(a) Raman spectrum of amarantite over the 2600–4000 cm1spectral range
and (b) infrared spectrum of amarantite over the 2600–4000 cm1spectral range.
als. Raman spectra of the mineral phases for this region are differ-ent, and each phase has its own characteristic spectrum. For antle-rite four Raman bands are observed at 651, 629, 606 and 600 cm1. Bands at 630 and 604 cm1were found by Bouchard–Abouchacra for antlerite [49]. In contrast, chalcanthite showed only a single band at 610 cm1
. The Raman spectrum of brochantite shows bands at 629, 608 and 600 cm1. Bands were observed for brochan-tite by Bouchard at 621,611 and 599 cm1[49]. The Raman spec-trum of posnjakite shows bands at 621, 609 and 596 cm1 and langite at 621, 609 and 596 cm1. Whilst the bands for posnjakite and langite are in similar positions, the intensity of the bands var-ies considerably, although this may be a crystal orientation effect. The Raman spectrum of wroewulfeite shows two bands at 621 and 600 cm1.
The observation of multiple bands supports the concept of a reduction in symmetry of sulphate in the amarantite structure. Some sulphates have their symmetry reduced through the forma-tion of monodentate and bidentate ligands. In the case of bidentate formation both bridging and chelating ligands are known. This reduction in symmetry is observed by the splitting of the
m
3andm
4 into two components under C3vsymmetry and threecompo-nents under C2vsymmetry. The observation that 3 or 4 bands are
observed in the
m
4region of amarantite is attributed to thereduc-tion of symmetry to C2vor less.
Raman spectroscopy in the 2600–3800 cm1spectral range
The Raman spectrum of amarantite in the 2600–3800 cm1 spectral range is reported in Fig. 5a. Two features are observed: firstly a very sharp band at 3529 cm1and a broad spectral profile with Raman bands observed at 3025, 3089, 3227, 3340, 3401 and 3480 cm1. The sharp band is assigned to an OH stretching
vibra-tion, whereas the broad bands are attributed to water stretching vibrations. The infrared spectrum of amarantite in the 2600– 3800 cm1spectral range is displayed inFig. 5b. The spectral pro-file is similar to that in the Raman spectrum. The infrared band at 3519 cm1is attributed to the stretching vibration of the OH units. The infrared bands at 2944, 3058, 3272 and 3403 cm1 are assigned to the stretching vibrations of water.
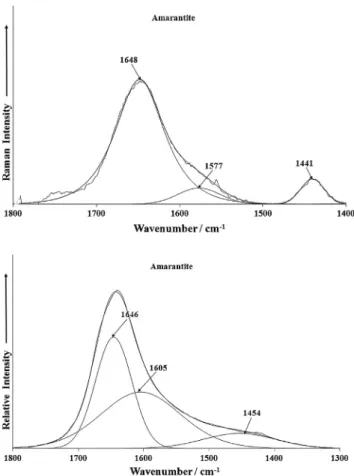
Raman spectroscopy in the 1400–1800 cm1spectral range
The Raman spectrum of amarantite in the 1400–1800 cm1 spectral range is shown inFig. 6a.A Raman band is observed at 1648 cm1and is attributed to the water bending mode. Two other bands are found at 1441 and 1577 cm1. The infrared spectrum in the 1300–1800 cm1 region, shows two bands at 1605 and 1646 cm1 attributed to the water bending modes (Fig. 6b). An-other broad band is also found at 1454 cm1.
Conclusions
The techniques of electron microscopy, thermogravimetry and vibrational spectroscopy have been combined to determine the chemistry of the mineral amarantite. Chemical analysis using an electron probe shows qualitatively that only Fe and S are present. Thermogravimetry proves the thermal decomposition of amaran-tite takes place in a series of four major steps at 77.63, 192.2, 550 and 641.4°C with a lesser mass loss step at 550°C.
Raman spectroscopy is a very powerful tool for the study of sul-phate minerals. In this work we have used vibrational spectroscopy to study the mineral amarantite, a mineral found in evaporate deposits and land surfaces with extreme aridity. Multiple antisym-metric stretching bands are observed as well as multiple bending modes suggesting a reduction in symmetry of the sulphate in the amarantite structure. The symmetry of the sulphate as observed by the number of bands in the
m
2,m
3andm
4modes is essentiallyre-duced to C2v.
Acknowledgements
The financial and infra-structure support of the Discipline of Nanotechnology and Molecular Science, Science and Engineering Faculty of the Queensland University of Technology, is gratefully acknowledged. The Australian Research Council (ARC) is thanked for funding the instrumentation. The authors would like to acknowledge the Center of Microscopy at the Universidade Federal de Minas Gerais (http://www.microscopia.ufmg.br) for providing the equipment and technical support for experiments involving electron microscopy. R. Scholz thanks to FAPEMIG – Fundação de Amparo à Pesquisa do Estado de Minas Gerais, (Grant No. CRA – APQ-03998-10).
Appendix A. Supplementary material
Supplementary data associated with this article can be found, in the online version, athttp://dx.doi.org/10.1016/j.saa.2013.04.111.
References
[1]L. Darapsky, Jahrb. f. Min. (1890) 49–70.
[2]C. Giacovazzo, S. Menchetti, Rendiconti della Soc, Ital. di Min. Petr. 25 (1969) 399–406.
[3]R. Scharizer, Zeit. f. Kristall. 65 (1927) 335–360. [4] J.B. Mackintosh, Am. J. Sci, vol. 38, pp. 242–245.
[5]P. Bariand, F. Cesbron, J.P. Berthelon, Memoire Hors-Serie de la Soc, Geol. de France 8 (1977) 77–85.
[6]R.J. Noble, J. Just, J.E. Johnson, Catalogue of South Australian Minerals, Govenment Printer, South Australia, 1983.
[7]T. Buckby, S. Black, M.L. Coleman, M.E. Hodson, Min. Mag. 67 (2003) 263–278. [8]F. Cesbron, Bull. Soc. Fr. Min. Crist. 87 (1964) 125–143.
Fig. 6.(a) Raman spectrum of amarantite over the 1300–1800 cm1spectral range
[9]W.H. Baur, Fortschritte der Min. 39 (1961) 333–334. [10]E.G. Ehlers, D.V. Stiles, Am. Min. 50 (1965) 1457–1461. [11]R. Scharizer, Zeitschrift f. Kristall. und Min. 43 (1907) 113–129. [12]R. Scharizer, Zeitschrift f. Krist. und Min. 46 (1909) 427–453. [13]M.E.E. Madden, R.J. Bodnar, J.D. Rimstidt, Nature 431 (2004) 821–823. [14]D.T. Vaniman, D.L. Bish, S.J. Chipera, C.I. Fialips, J. William Carey, W.C. Feldman,
Nature 431 (2004) 663–665.
[15]J.-P. Bibring, Y. Langevin, F. Poulet, A. Gendrin, B. Gondet, M. Berthe, A. Soufflot, P. Drossart, M. Combes, G. Bellucci, V. Moroz, N. Mangold, B. Schmitt, Nature 428 (2004) 627–630.
[16]B.M. Hynek, Nature 431 (2004) 156–159.
[17]M.S.R. Swamy, T.P. Prasad, B.R. Sant, J. Therm. Anal. 16 (1979) 471–478. [18]M.S.R. Swamy, T.P. Prasad, B.R. Sant, J. Therm. Anal. 15 (1979) 307–314. [19]S. Bhattacharyya, S.N. Bhattacharyya, J. Chem. Eng. Data 24 (1979) 93–96. [20]M.S.R. Swami, T.P. Prasad, J. Therm. Anal. 19 (1980) 297–304.
[21]M.S.R. Swamy, T.P. Prasad, J. Therm. Anal. 20 (1981) 107–114.
[22] A.C. Banerjee, S. Sood, Therm. Anal., Proc. Int. Conf. seventh, 1 (1982), pp. 769– 774.
[23]K. Sasaki, H. Konno, Can. Min. 38 (2000) 45–56.
[24]T.A.M. Bridge, D.B. Johnson, App. Environ. Microbiol. 64 (1998) 2181–2186. [25]R.E. Stoffregen, C.N. Alpers, J.L. Jambor, Rev. Min. Geochem. 40 (2000) 453–
479.
[26]G.R. Hunt, R.P. Ashley, Econo. Geol. 74 (1979) 1613–1629. [27]G.R. Hunt, R.C. Evarts, Geophysics 46 (1981) 316–321.
[28]N.V. Greben’ko, L.S. Eshchenko, V.V. Pechkovskii, Izvestiya Akademii Nauk SSSR, Neorganicheskie Materialy 14 (1978) 136–140.
[29]A.Y. Kudeyarova, A.I. Trubin, Agrokhim (1978) 18–24. [30]J. Griffioen, Environ. Sci. Technol. 28 (1994) 675–681. [31]J.L. Bishop, E. Murad, Am. Min. 90 (2005) 1100–1107.
[32]R.L. Frost, M.L. Weier, J.T. Kloprogge, F. Rull, J. Martinez-Frias, Spectrochimi. Acta 62A (2005) 176–180.
[33]R.L. Frost, M.L. Weier, W. Martens, S. Mills, J. Mol. Struct. 752 (2005) 178–185. [34]R.L. Frost, R.-A. Wills, M.L. Weier, A.W. Musumeci, W. Martens, Thermochim.
Acta 432 (2005) 30–35.
[35]R.L. Frost, R.-A. Wills, M.L. Weier, W. Martens, J. Raman Spectrosc. 36 (2005) 435–444.
[36]R.L. Frost, E. Mako, J. Kristof, E. Horvath, J.T. Kloprogge, Langmuir 17 (2001) 4731–4738.
[37]H.D. Ruan, R.L. Frost, J.T. Kloprogge, Appl. Spectrosc. 55 (2001) 190–196. [38]R.L. Frost, J.T. Kloprogge, Z. Ding, Spectrochim. Acta 58A (2002) 1657–1668. [39]C. Giacovazzo, S. Menchetti, Periodico di Mineralogia 37 (1968) 727–731. [40] P. Suesse, Zeitschrift für Kristallographie 127 (1968) 261–275.
[41]R. Scharizer, Zeit. Kristall. 56 (1921) 353–385. [42]G. Cocco, Periodico di Min. 21 (1952) 103–138.
[43]R.L. Frost, P.A. Williams, W. Martens, J.T. Kloprogge, P. Leverett, J. Raman Spectrosc. 33 (2002) 260–263.
[44] S.D. Ross, Ross Chapter 18 pp 423 in The infrared spectra of minerals, V.C. Farmer editor. The Mineralogical Society London (1974). in The infrared spectra of minerals, Chapter 18 pp 423 (1974) The Mineralogical Society London.
[45] S.D. Ross, Inorganic Infrared and Raman Spectra (European Chemistry Series), 1972.
[46]W. Martens, R.L. Frost, J.T. Kloprogge, P.A. Williams, J. Raman Spectrosc. 34 (2003) 145–151.
[47]R.L. Frost, J.T. Kloprogge, P.A. Williams, P. Leverett, J. Raman Spectrosc. 31 (2000) 1083–1087.
[48]R.L. Frost, J.T. Kloprogge, P.A. Williams, Neues Jahr. Min. (2003) 529–542. [49] M. Bouchard-Abouchacra, Evaluation des capacites de la Microscopie Raman
dans la caracterisation mineralogique et phsiochimique de materiaux archeologiques: metaux, vitraux & pigments., Ph. D thesis (2001).