A broad variety of sampling strategies and fishing gears have been developed to collect and record the presence and abundance of different fish species occurring in estuarine and coastal marine habitats (VAN MARLEN 2003, VIEIRAet al. 2006, ROTHERHAMetal. 2007, QUEIROLOetal. 2009). According to KING (1995) and VIEIRAetal. (2006), the beach seine net is the most effective fishing gear for sampling in shallow, non-vegetated surf zone areas. VIEIRAetal. (2006) recommended the use of a particular beach seine net (a beach seine with a codend) for sampling estuarine environments of the Brazilian coast (Fig. 1). A number of studies have used and approved on this beach seine in estuarine and freshwater habitats in southern Brazil (e.g., BURNSetal. 2006, GARCIAetal. 2006, ARTIOLIetal. 2009). However, only one record of the use of this type of gear exists for the marine surf zone in Brazil, for the southeast coast (MAZZEI etal. 2009).
Even when using the same sampling gear, the selected haul distance represent an important factor for comparing catch results. Several authors have used beach seines at surf zones, but different distances are generally applied. For example, LAY -MAN (2000) and MAZZEIetal. (2009) selected a haul length of 15 m, SILVAetal. (2004) selected a length of 30 m, and MONTEIRO -NETO & PRESTRELO (2013) selected 100 m hauls, hindering com-parisons among different data sets. Therefore, the present study was conducted to test the performance of a beach seine net with a bag (codend) in a marine surf zone area in southern
Brazil (Fig. 3), and to identify the most effective protocol for this net in a wave-dominated environment.
MATERIAL AND METHODS
The codend beach seine used in the current study is made from a multifilament net with the following dimensions: 9 m in length × 2.4 m high; each wing measured 3.25 m in length (Fig. 1), and the codend was 3 m in length; the mesh in the lateral wings was 13 mm, and the mesh in the codend was 5 mm (Fig. 1). The net was pulled by two people, with a third person hold-ing a rope tied to the codend to prevent the bag from rishold-ing in the waves, thus hindering the process of dragging.
Starting from a fixed distance perpendicular to the beach (Perdist = 40 m), each haul was performed on a transversal line to the beach, dragging the net in the direction of the current from a depth of 1.2 m up to the shoreline. Three different dis-tances parallel to the beach (Pardist) were previously established (30, 60, and 90 m; Fig. 2), and the haul distance (H) was calcu-lated using the Pythagorean Theorem (H2 = Par
dist 2 + Per
dist 2)
(Fig. 2). Since Perdist was fixed at 40 m and Pardist comprised 30, 60, and 90 m, the H estimates were 50.0, 72.1, and 98.5 m. For simplicity, the H values have been referred to as 50, 70, and 100 m in the text. However, the original H values were retained for the calculation of the area swept. The standard seine width of the net was estimated to be 6 m, and the swept area of the
Longer is not always better: The influence of beach seine net haul
distance on fish catchability
Pryscilla Moura Lombardi
1,2, Fábio Lameiro Rodrigues
1& João Paes Vieira
11 Laboratório de Ictiologia, Instituto de Oceanografia, Universidade Federal do Rio Grande. Avenida Itália km 8,
96203-900 Rio Grande, RS, Brazil.
2 Corresponding author. E-mail:[email protected]
ABSTRACT. The aim of this study was to compare the influence of different haul distances of a codend beach seine on the catchability of fish in a surf zone. Two different surf zone sites (A and B) at the Cassino Beach (Rio Grande do Sul, Brazil) were sampled at three different distances, parallel to the beach (30, 60, and 90 m). Starting 40 m from the beach line, diagonal distances of approximately 50, 70, and 100 m were swept. The total CPUE and CPUA haul distances are compatible with a declining trend in catch rates with increased haul distance at both sites. However, statistically signifi-cant differences were observed only for the short distance CPUA (50 m) in relation to the other haul distances at one of the sites sampled. Two fish size groups were observed (TL ⭐ 40 and > 40 mm), but only small individuals (⭐ 40 mm) captured in the shorter haul distance at site B showed significant differences in CPUA. This result indicates that size structure for hauls at different distances was equal and that smaller individuals determined the pattern of fish abun-dance. The net performance indicates that a short haul (⭐ 50 m) is the best strategy to reduce net avoidance and fish escape when using this type of sampling gear.
net was calculated by multiplying H by 6, which resulted in values of 300.0, 432.7, and 590.9 m2, respectively.
Sampling was conducted at two different sites (A and B) in the Cassino Beach surf zone (Fig. 3). Cassino Beach is a dis-sipative beach, exhibiting medium wave energy, a smooth slope with few and inexpressive beach cusps, and fine sandy sedi-ments (CALLIARI 1998, CALLIARIetal. 2005). Sites A (32°12’33.3"S, 052°10’45.3"W) and B (32°09’41.9"S, 052°06’21.8"W) are lo-cated 9 km and 500 m south of the west jetty of the Patos Lagoon, respectively. Despite the proximity of these two sites, LIMA & VIEIRA (2009) recorded more wave lines at site B than at site A. This variability was considered advantageous for test-ing the utility of this fishtest-ing gear under different conditions. Each site was visited three times between March and April of 2009. During each visit, three random hauls were carried out for every parallel distance (Pardist = 30, 60, and 90 m) at each site; thus, there were nine samples per site. Each seine haul was performed immediately adjacent to the end of the previous one, but the order of parallel distances was selected at random. All fish were identified to the lowest taxonomic level using the keys by FIGUEIREDO & MENEZES (1980, 2000) and; MENEZES & FIGUEIREDO (1980, 1985); the specimens captured were counted and measured to the nearest millimeter (total length – TL). For each site, the number of fish caught per haul were independently expressed as catch per unit effort (individuals per sample – CPUE), which represents the number of fish caught in a single seine haul, and as catch per unit area (individuals per square meter – CPUA), which represents the number of fish caught per unit area.
Fishes were classified by size classes of 10 mm intervals and separated into two size groups (⭐ 40 mm TL and > 40 mm TL). Based on VIEIRA (2006), CPUE and CPUA by size class (CPUA-SC) were calculated for individuals smaller or equal to 40 mm and larger than 40 mm TL.
Even after log transformation, the CPUE, CPUA, and CPUA-SC values did not meet the assumptions of Analyses of Variance (ANOVA) (normality and variance homogeneity); thus, a non-parametric analysis (Kruskal-Wallis test) was selected to compare the mean CPUE, CPUA, and CPUA-SC per Pardist for each site (at 0.05 signifficant level). The free statistics program PAST ver. 1.81 (HAMMERetal. 2001) was used for these analyses.
To compare the faunistic similarity between the differ-ent haul distances, we used the minimum percdiffer-entage of simi-larity (Pmin) based on CPUE% (ARTIOLIetal. 2009), which was described as Pmin = ⌺
i minimum (p1i and p2i), where p1i = the percentage of species i in sample 1 and p2 i = the percentage of species i in sample 2 (KREBS 1989). Based on the CPUE values, we calculated the numerical percentage (CPUE%) and fre-quency of occurrence (FO%) of each species, for each sampling day and each Pardist. Species that presented FO% ⭓ mean FO% in each haul distance were considered frequent, while species with FO% < mean FO% were considered rare. A similar method was used for CPUE%, in which species with CPUE% ⭓ mean
CPUE% in each seine distance were considered abundant, while species with CPUE% < mean CPUE% were considered not abun-dant. Finally, combinations of FO% and CPUE% allowed us to classify the species into 4 groups: abundant and frequent, fre-quent but not abundant, abundant but rare, and not abun-dant and rare (BURNSetal. 2006, GARCIAetal. 2006, ARTIOLIetal. 2009, CENI & VIEIRA 2013).
Vouchers for the species collected in this study are avai-lable in the “Coleção Ictiológica da FURG”.
RESULTS
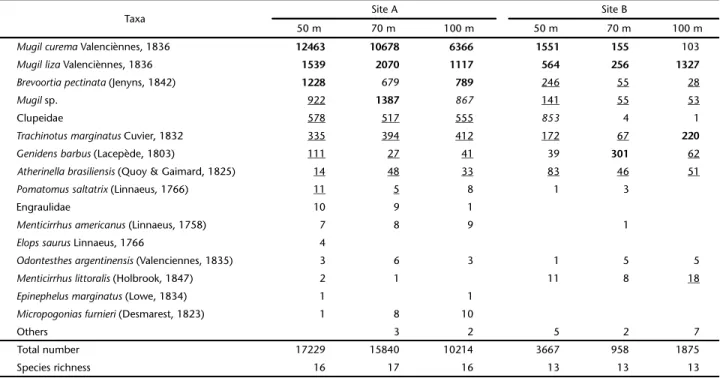
Table I. Total numbers of dominant taxa in each haul distance (50, 70 and 100 m). Taxa were classified as Abundant and Frequent (bold), Frequent and Not-Abundant ( underline), Abundant and rare (italic), and the other ones are present but not frequent or abundant.
Taxa Site A Site B
50 m 70 m 100 m 50 m 70 m 100 m
Mugil curema Valenciènnes, 1836 12463 10678 6366 1551 155 103
Mugil liza Valenciènnes, 1836 1539 2070 1117 564 256 1327
Brevoortia pectinata (Jenyns, 1842) 1228 679 789 246 55 28
Mugil sp. 922 1387 867 141 55 53
Clupeidae 578 517 555 853 4 1
Trachinotus marginatus Cuvier, 1832 335 394 412 172 67 220
Genidens barbus (Lacepède, 1803) 111 27 41 39 301 62
Atherinellabrasiliensis (Quoy & Gaimard, 1825) 14 48 33 83 46 51
Pomatomussaltatrix (Linnaeus, 1766) 11 5 8 1 3
Engraulidae 10 9 1
Menticirrhusamericanus(Linnaeus, 1758) 7 8 9 1
Elopssaurus Linnaeus, 1766 4
Odontesthesargentinensis (Valenciennes, 1835) 3 6 3 1 5 5
Menticirrhuslittoralis (Holbrook, 1847) 2 1 11 8 18
Epinephelusmarginatus(Lowe, 1834) 1 1
Micropogoniasfurnieri (Desmarest, 1823) 1 8 10
Others 3 2 5 2 7
Total number 17229 15840 10214 3667 958 1875
Species richness 16 17 16 13 13 13
rare are listed in Table I.
DISCUSSION
Contrary to expectations, more individuals were captured by the shorter haul distances (50 and 70 m) than the longer haul distances (100 m), even though this difference was statis-tically significant only at site B. The wave action, according to HAHNetal. (2007) may affect the shape of the seine and can temporarily lift lead lines or submerge float lines. Those diffi-culties may contribute to the differences found between the distances tested, considering that longer hauls passed through more waves than shorter hauls.
Our study showed that, while the three different haul distances (50, 70, and 100 m) caught nearly the same species, with similar abundance and frequencies at site A, species abun-dances and frequencies were different at site B. Evaluating the three haul distances, only CPUA and CPUA-SC for site B showed differences between the shorter haul distance and the two other for both abundance and size class. However the distribution pattern of individuals among species was similar among the efforts tested. LAYMAN (2000), using a codend seine similar to that used in the present work, but with even smaller haul dis-tances (15 m and 120 m2 of swept area), also reported low di-versity and few abundant but frequent species.
The same general pattern of size distribution was found at both sampling sites, with most individuals being smaller than or equal to 40 mm TL. The expressive dominance of the
⭐ 40 mm TL size group in all sampled areas indicates that the pattern of abundance in the surf zone is dominated by small individuals. Using a larger codend seine (26 m) with a smaller mesh (4 mm) in Japan, SUDAet al. (2002) found primarily small juveniles (mostly smaller than 50 mm TL), with a few species dominating the catches. These findings are consistent with studies that found that the marine surf zone has low diversity of fish and a few highly dominant species, which comprise small transient or resident individuals that use the surf zone as a nursery area (GODEFROIDetal. 2003, MONTEIRO-NETOetal. 2003, FELIXetal. 2007, LIMA & VIEIRA 2009, RODRIGUES & VIEIRA 2013).
The shorter haul distance we tested (i.e., 50 m) is similar to haul distances applied in different studies at surf zone areas,
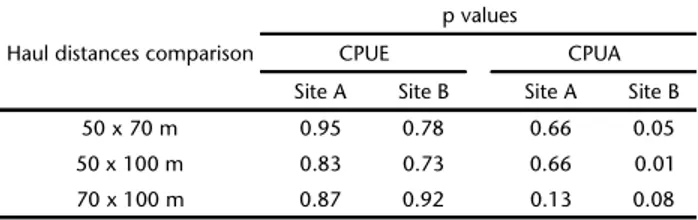
50 x 70 m 0.95 0.78 0.66 0.05
50 x 100 m 0.83 0.73 0.66 0.01
70 x 100 m 0.87 0.92 0.13 0.08
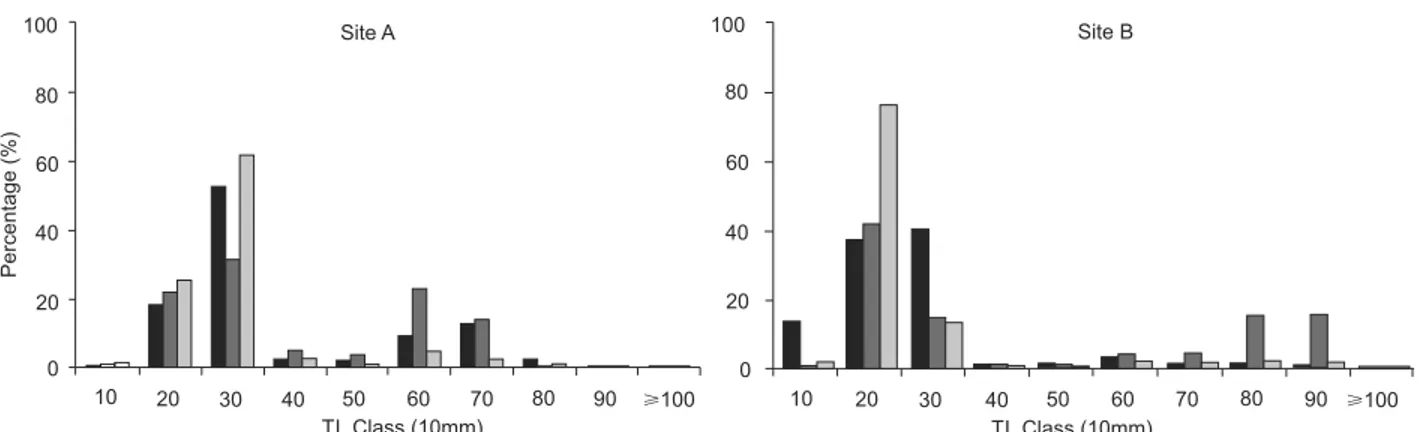
Size distribution was similar between different haul dis-tances at both sites, ranging from 10 mm to 100 mm, with peak abundance in length classes being lower than or equal to 40 mm TL (Fig. 5). At site A, the CPUA-SC of individuals from both size groups (⭐ 40 and > 40 mm TL) showed a tendency to
decrease with increasing haul distance (Fig. 6); however, the Kruskal-Wallis post-hoc test did not reveal any significant dif-ferences (p > 0.05) (Table III). At site B, the CPUA-SC of small individuals (⭐ 40 mm TL) was significantly higher at the 50 m haul distance when compared to 70 or 100 m haul distances, but there was no statistical difference between the 70 and 100 m haul distances. There was no significant difference in CPUA-SC for higher size class (> 40 mm TL) at site B (Table III).
Table III. The resulting p values from Kruskal-Wallis post-hoc test for CPUA between the different haul distances (50, 70 and 100 m), for individuals ⭐ 40 mm and > 40 mm in total length, for each sampling site.
Haul distances comparison p values site A p values site B
⭐ 40 mm > 40 mm ⭐ 40 mm > 40 mm
50 x 70 m 0.86 0.86 0.01 0.93
50 x 100 m 0.13 0.33 0.01 0.72
70 x 100 m 0.13 0.21 0.60 0.54
Figure 5. Percentage of individuals captured by length class for each haul distance (50, 70 and 100 m), for each sampling site (A and B). () 50 m, () 70 m, () 100 m.
Figure 6. Variations of mean LogCPUA-SC values per haul distance for groups ⭐ 40 mm and > 40 mm of total length (TL) in site A and site B. The vertical bars indicate the mean values and the lines indicate the standard deviation.
for instance: MONTEIRO-NETO & MUSICK (1994) also used 50 m haul distance perpendicular to the shoreline with a small beach seine; and KANOU etal. (2004) applied a 20 m haul distance parallel to the shoreline, using a small bag seine net. VIEIRAet al. (2006) suggested that this particular type of 9 m beach seine with codend should be used for short distance hauls, in order to improve the efficiency at the haul.
reg-e Treg-ecnológico (CNPq – Proc. 403805/2012-0; 563263/2010-5) and Fundação de Amparo à Pesquisa do Estado do Rio Grande do Sul (FAPERGS – Proc. 11/2262-7).
LITERATURE CITED
ARTIOLI, L.G.S.; J.P. VIEIRA; A.M. GARCIA & M.A. BEMVENUTI. 2009. Distribuição, dominância e estrutura de tamanhos da assem-bléia de peixes da lagoa Mangueira, sul do Brasil. Iheringia 99 (4): 409-418. doi: 10.1590/S0073-47212009000400011. BURNS, M.D.M.; A.M. GARCIA; J.P. VIEIRA; A.M. BEMVENUTI; D.M.L.M.
MARQUES & V. CONDINI. 2006. Evidence of habitat fragmentation affecting fish movement between the Patos and Mirim coastal lagoons in southern Brazil. Neotropical Ichthyology 4 (1): 69-72. doi: 10.1590/S1679-62252006000100006.
CALLIARI, L.J. 1998. Características Geomorfológicas, p. 101-104. In: U. SEELIGER; C. ODEBRECHT & J.P. CASTELLO (Eds). Os ecossistemas costeiro e marinho do extremo sul do Bra-sil. Rio Grande, Ed. Ecoscientia.
CALLIARI, L.J.; T. HOLAND; M.S. DIAS; S. VINZON; E.B. THORTON & T.P. STANTON. 2005. Experimento Cassino 2005: Uma síntese dos levantamentos efetuados na ante-praia e zona de arre-bentação. In: Anais do Congresso da Associação Brasilei-ra de Estudos do Quaternário. Vitória, ABEQUA, [CD]. CENI, G. & J.P. VIEIRA. 2013. Looking through a dirty glass: how
different can the characterization of a fish fauna be when distinct nets are used for sampling. Zoologia 30 (5): 499-505. doi: 10.1590/S1984-46702013000500005.
FÉLIX, F.C.; H.L. SPACH; P.S. MORO & C.W. HACKRADT. 2007. Ichthyofauna composition across a wave – energy gradient on southern Brazil beaches. Brazilian Journal of Oceanography 55 (4): 281-292. doi: 10.1590/S1679-87592007000400005. FIGUEIREDO, J.L. & N.A. MENEZES. 1980. Manual de peixes
mari-nhos do sudeste do Brasil III. Teleostei (2). São Paulo, Museu de Zoologia Universidade de São Paulo, 93p. FIGUEIREDO, J. L. & N.A. MENEZES. 2000. Manual de peixes
mari-nhos do sudeste do Brasil VI. Teleostei (5). São Paulo, Museu de Zoologia Universidade de São Paulo, 54p. GARCIA, A.M.; M.A. BEMVENUTI; J.P. VIEIRA; D.M.L.M. MARQUES;
M.D.M. BURNS; A. MORESCO & M.V. CONDINI. 2006. Checklist comparison and dominance patterns of the fish fauna at
HAMMER, Ø.; D.A.T. HARPER & P.D. RYAN. 2001. Past: Paleontological Statistics Software Package for Education and Data Analysis. Palaeontologia Electronica 4 (1): 9p. Available online at: http://palaeo-electronica.org/2001_1/past/past.pdf [Accessed: February 2013].
KANOU, K.; M. SANO & H. KOHNO. 2004. Catch efficiency of small seine for benthic juveniles of the yellowfin goby Acanthogobius flavimanus on a tidal mudflat. Ichthyological Research 51: 374-376. doi: 10.1007/s10228-004-0231-9.
KING, M. 1995. Fisheries biology, assessment and management. Oxford, Fishing News Books, Blackwell Science, 341p. KREBS, C.J. 1989. Ecological Methodology. New York, Harper
and Row Publishers, 654p.
LAYMAN, C.A. 2000. Fish Assemblage Structure of the Shallow Ocean Surf-Zone on the Eastern Shore of Virginia Barrier Islands. Estuarine and Coastal Shelf Science 51 (2): 201-213. doi: 10.1006/ecss.2000.0636.
LIMA, M.S.P. & J.P. VIEIRA. 2009. Variação espaço-temporal da ictiofauna da zona de arrebentação da Praia do Cassino, Rio Grande do Sul, Brasil. Zoologia 26 (3): 499-510. doi: 10.1590/S1984-46702009000300014.
MAZZEI, E.F.; C.R. PIMENTEL; R.M. MACIEIRA & J.C. JOYEUX. 2009. Re-sultados preliminares da variação espacial da ictiofauna de praias arenosas sobre influência do estuário dos rios Piraquê-Açê e Piraquê-Mirim, ES. IX Anais do Congresso de Ecolo-gia do Brasil. São Lourenço: Sociedade de EcoloEcolo-gia do Brasil. Available online at: http://www.seb-ecologia.org.br/ 2009/resumos_ixceb/892.pdf [Accessed: 22 January 2011]. MENEZES, N.A. & J.L. FIGUEIREDO. 1980. Manual de peixes
mari-nhos do sudeste do Brasil IV. Teleostei (3). São Paulo, Museu de Zoologia Universidade de São Paulo, 98p. MENEZES, N.A. & J.L. FIGUEIREDO. 1985. Manual de peixes
mari-nhos do sudeste do Brasil V. Teleostei (4). São Paulo, Mu-seu de Zoologia Universidade de São Paulo, 107p.
MONTEIRO-NETO, C. & J.A. MUSICK. 1994. Effects of beach seine on the assessment of surf-zone fish communities. Atlânti-ca 16: 23-29.
MONTEIRO-NETO, C. & L. PRESTRELO. 2013. Comparing sampling strategies for surf-zone fish communities. Marine and Freshwater Research 64, 102-107. doi: 10.1071/MF12070. QUEIROLO, D.; H. DELOUCHE & C. HURTADO. 2009. Comparison between dynamic simulation and physical model testing of a new trawl design for Chilean crustacean fisheries. Fisheries Research 97: 86-94. doi: 10.1016/j.fishres.2009.01.005. RODRIGUES, F.L. & J.P. VIEIRA. 2013. Surf zone fish abundance and
diversity at two sandy beaches separated by long rocky jetties. Journal of the Marine Biological of the United Kingdom 93(4): 867-875. doi: 10.1017/S0025315412001531.
ROTHERHAM, D.; A.J. UNDERWOOD; M.G. CHAPMAN & C.A. GRAY. 2007. A strategy for developing scientific sampling tools for fishery-independent surveys of estuarine fish in New South Wales, Australia. ICES Journal of Marine Science 64: 1512-1516. doi: 10.1093/icesjms/fsm096.
SILVA, M.A.; F.G. ARAÚJO; M.C.C. AZEVEDO & J.N.S. SANTOS. 2004. The nursery function of sandy beaches in a Brazilian tropical bay for 0-group anchovies (Teleostei: Engraulidae): diel, seasonal
Submitted: 29.VII.2013; Accepted: 02.XI.2013. Editorial responsibility: Cassiano Monteiro Neto
and spatial patterns. Journal of Marine Biology Assessment UK 84: 1229-1232. doi: 10.1017/S0025315404010719h. SUDA, Y.; T. INOUE & H. UCHIDA. 2002. Fish communities in the
surf zone of a protected sandy beach at Doigahama, Yamaguchi Prefecture, Japan. Estuarine and Coastal Shelf Science 55: 81-96. doi: 10.1006/ecss.2001.0888.
VAN MARLEN, B. 2003. Improving the selectivity of beam trawls in The Netherlands: The effect of large mesh top panels on the catch rates of sole, plaice, cod and whiting. Fisheries Research 63: 155-168. doi: 10.1016/S0165-7836(03)00075-4.
VIEIRA, J.P. 2006. Ecological analogies between estuarine bottom trawl fish assemblages from Patos Lagoon, Rio Grande do Sul, Brazil and York River, Virginia, USA. Revista Brasileira de Zoologia 23 (1): 234-247. doi: 10.1590/S0101-81752006000100017.