Bone maturity: estimation by means of Eklof and Ringertz
method simplifications*
Maturidade óssea: estimação por simplificações do método de Eklof e Ringertz
Celso Olivete Júnior1, Evandro Luis Linhari Rodrigues2
OBJECTIVE: The present study was aimed at presenting a process for estimating bone age by means of automatic simplifications of the Eklof & Ringertz method to provide reports as an aid to clinical diagnosis. MATERIALS AND METHODS: Carpal images from children and teenagers in the age range between 6 and 16 years were utilized for estimating their bone age based on simplifications ER5 and ER3, analyzing respec-tively 5 and 3 ossification centers. The automation of simplified methods utilizes specific procedures for processing radiographic images of the hand. RESULTS: The authors observed a high agreement with the average of medical reports based on the three classical methods (Greulich & Pyle, Tanner & Whitehouse, Eklof & Ringertz). The analysis of agreement with the proposed simplifications was performed with the paired Student’s t-test considering a significance level of 5% and, in most of cases, statistically significant differ-ences were not observed (p < 0.05). CONCLUSION: Based on the present results, it is concluded that sim-plifications of the Eklof & Ringertz method allow a reliable, fast and automated estimation of the bone age. Additionally, the proposed simplifications are appropriate for estimating bone age on extensive data bases without the subjectivity that is present in the classical methods.
Keywords: Bone age; Eklof and Ringertz; Carpal radiography.
OBJETIVO: Apresentar um processo para estimação da idade óssea utilizando simplificações do método de Eklof e Ringertz, que operam de forma automática, proporcionando laudos que auxiliam o diagnóstico médico. MATERIAIS E MÉTODOS: Foram utilizadas imagens carpais de crianças e adolescentes na faixa etária de 6 a 16 anos para a estimação da idade óssea, baseando-se nas simplificações ER5 e ER3 – análise de 5 e 3 centros de ossificação, respectivamente. A automatização dos métodos simplificados explora procedimen-tos específicos para o processamento de imagens radiográficas da mão. RESULTADOS: Os resultados al-cançaram elevada concordância com a média dos laudos médicos obtidos com os três métodos clássicos (Greulich e Pyle, Tanner e Whitehouse, Eklof e Ringertz). A análise de concordância das simplificações pro-postas foi realizada utilizando-se o teste t de Student pareado com faixa de significância de 5%, e na maioria dos casos não ocorreram diferenças estatisticamente significantes (p < 0,05). CONCLUSÃO: Analisando-se os resultados, conclui-se que é possível estimar com segurança a idade óssea utilizando simplificações do método de Eklof e Ringertz de forma rápida e automatizada. As simplificações propostas também são apro-priadas para estimação da idade óssea em grandes bases de dados e livre da subjetividade presente nos métodos clássicos.
Unitermos: Idade óssea; Eklof e Ringertz; Radiografia carpal.
Abstract
Resumo
* Study developed at Escola de Engenharia de São Carlos – Universidade de São Paulo (EESC-USP), São Carlos, SP, Brazil. 1. PhD in Electric Engineering, Escola de Engenharia de São Carlos – Universidade de São Paulo (EESC-USP), São Carlos, SP, Brazil.
2. PhD, Professor, Department of Electric Engineering, Es-cola de Engenharia de São Carlos – Universidade de São Paulo (EESC-USP), São Carlos, SP, Brazil.
Mailing address: Dr. Celso Olivete Júnior. Departamento de Engenharia Elétrica – EESC-USP. Avenida Trabalhador São-car-lense, 400, Centro. São Carlos, SP, Brazil, 13566-590. E-mail: [email protected]
The main clinical methods utilized for assessing the skeletal age are the following: Greulich & Pyle (GP) method that evalu-ates the hand bones by comparing radio-graphic images with an Atlas(1,2); Tanner &
Whitehouse (TW) method, that analyses a set of twenty hand and wrist bones which are given specific scores according to sex, and by adding such scores, an overall ma-turity score is obtained(3–5); and the Eklof
& Ringertz (ER) method based on mea-surements of ten ossification centers com-prising carpal bones, width of the distal radial epiphyses, length and width of the capitates and hamate, length of the 2nd, 3rd
Olivete CJ, Rodrigues ELL. Bone maturity: estimation by means of Eklof and Ringertz simplifications. Radiol Bras.2010; 43(1):13–18.
individual and environmental factors by means of mechanisms of growth and devel-opment. One may observe that the human body develops and grows according to its own sequences and rules whose different aspects have been studied(1).
One of the methods for studying the growth is analyzing radiographic images of determined parts of the body, particularly the hands, since they can be most fre-quently and easily x-rayed, with no radia-tion being delivered to vital organs(1).
INTRODUCTION
The human being is a dynamic biologi-cal species that, submitted to successive metabolic processes, evolves according to
and 4th metacarpal bones, and length of the 2nd and 3rd proximal phalanges(2,4). Such
method comprises two tables, one for each sex where each of the ossification centers is given a minimum and a maximum stan-dard measurement. The bone age is calcu-lated by means of the mean age for each ossification center. A more detailed de-scription of both these methods and estima-tion processes may be found at www. carpal.eesc.usp.br.
Some studies with similar approaches may be found in the literature; among them the one developed by Taffarel et al.(5), who
have developed a process for estimating bone age by means of the TW method au-tomation. The study developed by Haiter et al.(6) was aimed at evaluating the possibil-ity of applying the GP, TW and ER meth-ods to the Brazilian population, defining which would be the most reliable one by comparing their results with the chrono-logical age of the individuals.
Considering the characteristics of each of the mentioned estimation methods, the authors have opted for exploring and implementing the ER method in the present study, since it is based on dimensional measurements, allowing the utilization of computational data processing. The present study presents a process for estimating bone age by means of automatic simplifi-cations of the Eklof & Ringertz method denominated ER5 and ER3.
MATERIALS AND METHODS
Study images
Two sets of radiographic images of pa-tients in the age range between six and 16 years were selected. The first set included images of 685 (357 male and 328 female) patients (Figure 1). The images were ob-tained at the Department of Odontology of Faculdade de Odontologia de Piracicaba – Universidade Estadual de Campinas (Unicamp), SP, Brazil, and were classified according to the GP and TW methods un-der the supervision of Prof. Francisco Haiter Neto, and according to the ER method with the aid of the Anacarp soft-ware(7). The second set included of radio-graphic images of 234 (130 male and 104 female) patients of an institution in Bauru, SP, Brazil, given by Dr. Orivaldo Tavano(4).
This second set of images was included in the study to allow the investigation of re-sults considered as discrepant in relation to the mean values included in the clinical reports based on the ER, GP and TW meth-ods applied to the first set of images.
Methods
The implementation of the method was developed in a Borland-Builder C++ envi-ronment, and the statistical analyses were performed with the software BioEstat 3.0(8).
1 – Proposals for ER method simplifications
One of the difficulties found in the ER method is related to the overlapping be-tween the carpal and wrist bones,
hinder-ing an accurate measurement of the regions of interest and, consequently, yielding un-reliable results. In order to solve this prob-lem, those bones were excluded from the estimation process and, as a result an ER method simplification emerged, being de-nominated ER5.
a) The ER5 simplification
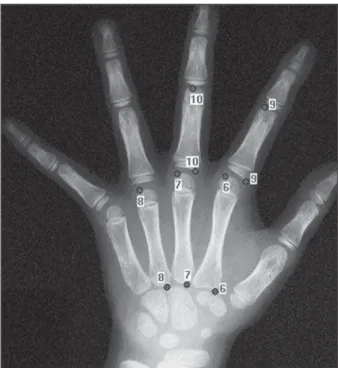
In this simplified method, the bone age estimation is based on the analysis of only five ossification centers (ER5), including two proximal phalanges and three metac-arpal bones, excluding the cmetac-arpal and wrist bones (Figure 2).
Later, a statistical analysis has led to a new simplification of the ER method re-sulting in the ER3 method.
Figure 2. Ossification centers utilized in the ER5 method: 6, 7 and 8 – length of the sec-ond, third and fourth metacar-pal bones; 9 and 10 – length of the second and third proxi-mal phalanges.
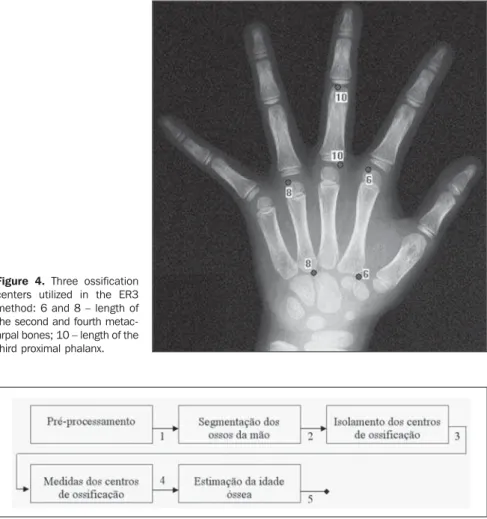
Figure 4. Three ossification centers utilized in the ER3 method: 6 and 8 – length of the second and fourth metac-arpal bones; 10 – length of the third proximal phalanx. b) The ER3 simplification
The authors aimed at finding the mini-mum number of ossification centers to achieve statistically significant results, i.e., similar to the mean values found on the clinical reports, establishing the highest possible number of combinations among the five bones (taken 2 by2, 3 by 3 and the mean value for the five bones) utilized in the ER5, and comparing them with the mean values found on the clinical reports. The denomination for the bones utilized in the combinations was the following: P1, P2 and P3 – 2nd, 3rd and 4th metacarpal bones length; P4 and P5 – 2nd and 3rd proximal phalanges length. Subsequently, charts were generated for each of the images of the set (Figure 3), analyzing which combi-nations were the most approximate to the value found on the clinical reports.
The dashed line with squares on the chart shown on Figure 3 corresponds to the mean value found on the clinical reports (ER, GP and TW). The points selected on the chart correspond to the combinations P1 P5 (circle marked with 1) and P1 P3 P5 (circle marked with 2). The mean value re-sulting from the combination (P1, P3 and P5 – formed by the bones highlighted on Figure 4) resulted in an excellent approxi-mation to the mean value found on the clinical reports, indicating a simplification for the ER method.
2 – Method for estimating the bone age
The steps of the bone age estimation process are shown on Figure 5.
1. Preprocessing – in order to eliminate
the variations resulting from the non-uni-formity of the image background inherent to the radiographic imaging process, the algorithm developed by Nascimento et al.(9)
and presented in the study developed by Olivete et al.(10) was applied for correction
of the heel effect with a low-pass filter to minimize the noises(11).
2. Bones segmentation – a simple way
to achieve hand bones segmentation is an efficient thresholding method(11). The fol-lowing methods were implemented: Otsu, Pun, Niblack and Rosenfeld(12–14).
3. Separation of the ossification centers
– In order to select the hand bones, the authors developed a process of scanning on the image, guided by the pixel with
inten-sity 255 (background color). Later, mark-ers were inserted to separate the 2nd, 3rd and 4th metacarpal bones and the 2nd and 3rd proximal phalanges.
4. Ossification centers measurements –
Upon markers insertion, the length in
pix-els was calculated for each bone utilizing the Euclidean distance. The resulting value was converted into millimeters to be uti-lized with the ER method.
5. Bone age estimation – For each
mea-surement found the table was searched for Figure 3. Chart demonstrating combinations as related to the mean value found on clinical reports.
identification of the value corresponding to the age. The final age is found through the mean age obtained for all the ossification centers.
3 – Data analysis
Bone ages were estimated with the aid of the Anacarp software(7); and later
ana-lyzed with the software BioEstat 3.0. Stan-dard deviation, mean, correlation coeffi-cient were calculated for the mean values of clinical reports (TW. GP and ER) and simplifications ER5 and ER3, and statisti-cally analyzed by the Student’s t-test. The Pearson’s correlation was utilized with the objective of evaluating the correlation be-tween the bone age calculated with the ER5 and ER3 methods and the mean values found on the clinical reports. The result of such analysis is the linear regression model
Y = aX + b, where X corresponds to the
mean value found on the clinical reports,
Y to the estimated bone age, and a and b
correspond to coefficients of this regres-sion. For the calculation of the rate of agreement with the mean value found on the clinical reports, the coefficient a must be equal to 1, and the coefficient i must be equal to zero; so Y = X. The statistical sig-nificance was evaluated with the paired Student’s t-test for the correlation coeffi-cient, with a significance level of 5%.
RESULTS
In order to improve the presentation and analysis of results, the images were classi-fied according to the mean value found on
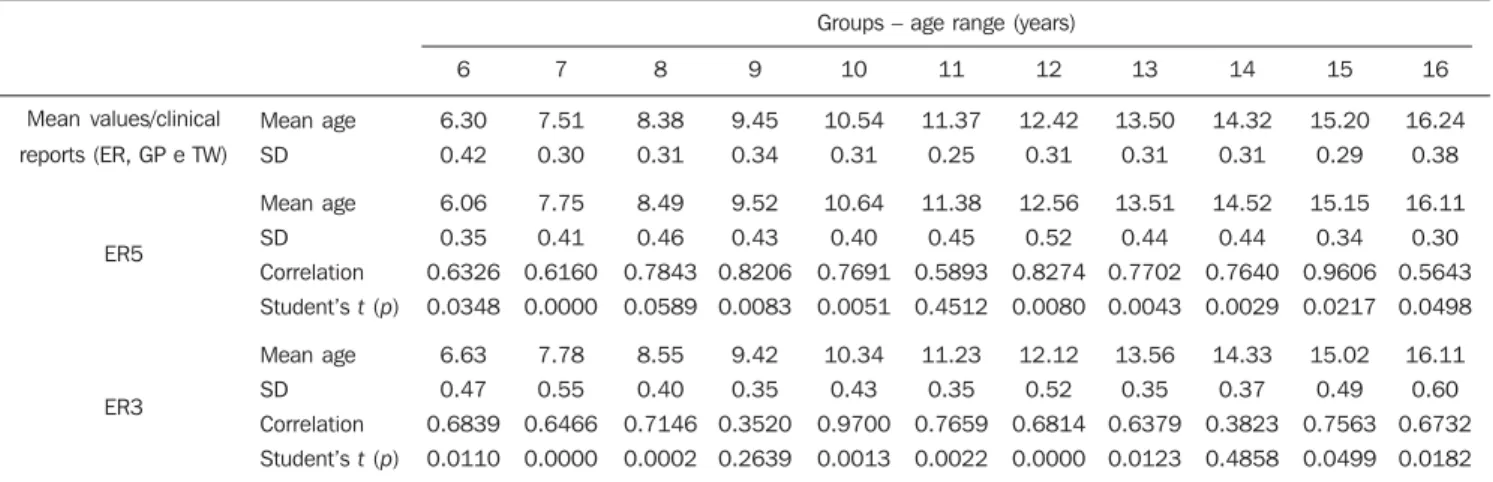
the clinical reports, considering groups in the age range between six and 16 years where each age range comprises a number of individuals; for example the 6-year range includes individuals aged from 6 years to 6 years and 11 months. Table 1 demon-strates the results for male individuals.
On Table 1, one can observe that the estimation performed for the male indi-viduals by the ER5 method, demonstrated a strong and positive correlation with the mean values found on the clinical reports, ranging between 0.58 and 0.96. Based on the Student’s t-test, only the results regard-ing the 11-year age group were not statis-tically significant, with p = 0.4512.
In order to evaluate the usefulness of the simplified method ER5 in the bone age estimation for the male 11-year age group, 32 individuals with another set of images coming from another region of the coun-try were selected, and the method was ap-plied. The results were statistically signifi-cant (paired Student’s t-test – p = 0.0076 and 72% correlation), demonstrating that the simplification can be applied to the 11-year age group.
In order to understand the discrepancy observed in the first image bank, the 44 images whose results were not statistically significant were individually analyzed. Considering a standard deviation corre-sponding to 6 months – an acceptable value, since the standards defined by the classical methods range from 6 months to one year, depending on the age range –, only three individuals (7%) remained with non-statistically significant values. Thus,
one may conclude that in the production of the clinical reports for the 11-year group of the first set of images, with two of the clas-sical methods (GP and TW) that are per-formed with comparison procedures, it is possible that there was inaccuracy enough to generate values different from those expected for the clinical reports.
Strong correlations were observed on the set of images of the male group, with the method ER5, with values achieving 97% and within the range of statistical sig-nificance (p < 0.05). Such sigsig-nificance was not observed only for the 9-year and 14-year groups. As the results of the 9-14-year group (a total of 28 images) are evaluated, two of them (7.14%) had ages estimates with differences of 7 and 8 months, respec-tively, in relation to the expected value (mean value found on the clinical reports). In the 14-year group, approximately 10% of the clinical reports presented values out of the 6-month standard deviation interval. The same comment on the 11-year group is also valid for the 14-year group, i.e., there is a high probability of inaccuracy in the production of the clinical reports with the classical methods (GP and TW) for the subjectivity implied in the interpretation of the images.
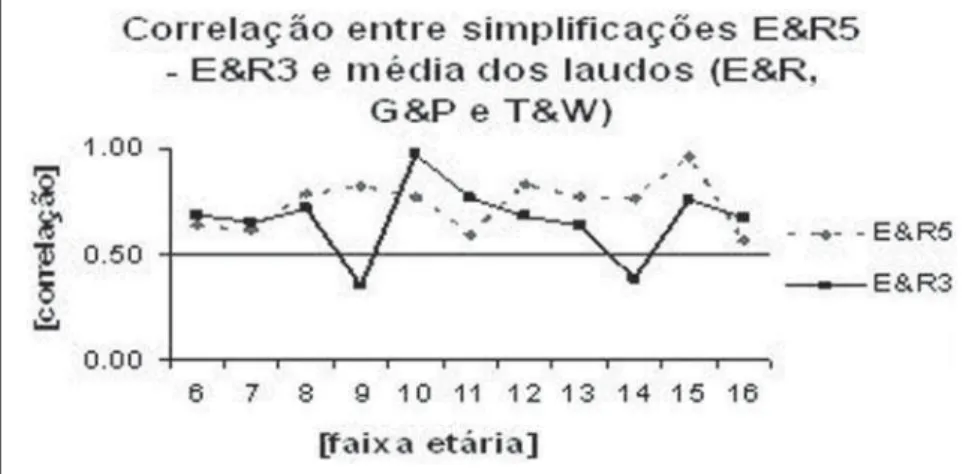
Figure 6 presents a chart illustrating the correlations between mean values found on clinical reports (TW, GP and ER) and the method simplifications (ER5 and ER3), considering the age ranges in the male group. One can observe that the method simplifications presented a strong correla-tion (values > 0.5) almost in all age groups.
Table 1 Results analysis – mean value/clinical reports and ER5 and ER3 methods simplification, male individuals grouped according to age range.
Mean values/clinical
reports (ER, GP e TW)
ER5 ER3 Mean age SD Mean age SD Correlation
Student’s t (p)
Mean age
SD
Correlation
Student’s t (p)
Groups – age range (years)
6 6.30 0.42 6.06 0.35 0.6326 0.0348 6.63 0.47 0.6839 0.0110 7 7.51 0.30 7.75 0.41 0.6160 0.0000 7.78 0.55 0.6466 0.0000 8 8.38 0.31 8.49 0.46 0.7843 0.0589 8.55 0.40 0.7146 0.0002 9 9.45 0.34 9.52 0.43 0.8206 0.0083 9.42 0.35 0.3520 0.2639 10 10.54 0.31 10.64 0.40 0.7691 0.0051 10.34 0.43 0.9700 0.0013 11 11.37 0.25 11.38 0.45 0.5893 0.4512 11.23 0.35 0.7659 0.0022 12 12.42 0.31 12.56 0.52 0.8274 0.0080 12.12 0.52 0.6814 0.0000 13 13.50 0.31 13.51 0.44 0.7702 0.0043 13.56 0.35 0.6379 0.0123 14 14.32 0.31 14.52 0.44 0.7640 0.0029 14.33 0.37 0.3823 0.4858 15 15.20 0.29 15.15 0.34 0.9606 0.0217 15.02 0.49 0.7563 0.0499 16 16.24 0.38 16.11 0.30 0.5643 0.0498 16.11 0.60 0.6732 0.0182
Figure 6. Correlation between mean value found on clinical reports and ER5 and ER3 method simplifi-cations. Male individuals.
A similar analysis was undertaken for the female group whose results are shown on Table 2, demonstrating high and posi-tive correlations with the mean value found on clinical reports, with values achieving approximately 91%. The worst result was observed for the 14-year group, with 0.5317 correlation and p = 0.2830 (higher than the 5% significance level). In this group, 31 images were evaluated and five bone age estimates (ranging between seven months and one year and two months) were different from the mean value found on the clinical reports, considering a standard deviation of 6 months.
Table 2 also demonstrates non-statisti-cally significant results for the 9-year and 10-year groups (p > 0.05). An individual analysis of the clinical reports of these age groups demonstrated that, for the 9-year group, 7.5% of the bone age estimates were
different from the mean value observed on the clinical reports. On the other hand, for the 10-year group differences were ob-served in 3.7% of bone age estimates. In order to evaluate the statistical differences within these age ranges, the bone age esti-mation was repeated for the individuals whose images were included in the second set (Database II) – same age groups –, with results from the Pearson’s correlation > 79% and p < 0.003 (Student’s t-test) within the significance level.
DISCUSSION
The methods traditionally utilized as reliable references in the process of bone age estimation are based on the analysis of carpal bone radiographs: GP, TW and ER. The first two methods require an inspec-tional comparative analysis, implying a
sig-nificant level of subjectivity in the process. The ER method is one of the most fre-quently adopted in specialized centers that utilize computerized tools as an aid in the diagnosis. The utilization of this method presents some difficulties, among them the manual process for measuring the ossifica-tion centers requiring the inserossifica-tion of 20 markers for identifying all the bones in-volved in the process(7,15).
The authors have opted for exploring the ER method, considering that it is a stan-dard method very frequently utilized the field of odontology(16). With the original
method parameters the Anacarp tool was developed(7) to perform the bone age
esti-mation in an automatic and simplified manner, differently from other softwares described in the literature that require manual operation(6,16), taking much time for
inserting the 20 markers to identify all the ossification centers. With the Anacarp tool, the identification process is automatically and easily developed, with a high rate of agreement between results and the mean values found on clinical reports by the methods GP, TW and ER.
The results were analyzed by means of the Pearson’s correlation and the paired Student’s t-test. The initial results were not statistically significant with p > 0.05 with the ER5 method for male individuals in the 11-year age group and female individuals in the 14-year age group, which has led to the utilization of a second image bank, al-lowing the conclusion that clinical reports generated with the GP and TW methods for the first image bank present values different
Table 2 Results analysis – mean value/clinical reports and ER5 and ER3 methods simplification, female individuals grouped according to age range.
Mean values/clinical
reports (ER, GP e TW)
ER5 ER3 Mean age SD Mean age SD Correlation
Student’s t (p)
Mean age
SD
Correlation
Student’s t (p)
Groups – age range (years)
6 6.23 0.68 6.45 0.70 0.9059 0.0141 6.48 0.59 0.7734 0.0376 7 7.35 0.32 7.28 0.47 0.9077 0.0407 7.26 0.47 0.8451 0.0312 8 8.38 0.33 8.22 0.45 0.7373 0.0012 8.22 0.74 0.7373 0.0408 9 9.45 0.38 9.37 0.44 0.8803 0.0100 9.48 0.44 0.4782 0.2811 10 10.41 0.33 10.56 0.49 0.8702 0.0343 10.38 0.42 0.3420 0.2744 11 11.39 0.26 11.53 0.50 0.4890 0.0476 11.52 0.43 0.5704 0.0381 12 12.44 0.33 12.54 0.52 0.8696 0.0288 12.32 0.30 0.4674 0.0220 13 13.46 0.29 13.65 0.45 0.6145 0.0024 13.18 0.48 0.7024 0.0000 14 14.66 0.24 14.61 0.55 0.5317 0.2830 14.51 0.50 0.7632 0.0401 15 15.36 0.31 15.53 0.55 0.8010 0.0043 15.12 0.43 0.8970 0.0003 16 16.00 0.01 16.38 0.48 0.8297 0.0100 15.75 0.45 0.9560 0.0383
from the ones expected for the clinical re-ports. The same observation is valid for the male individuals in the 9-year and 14-year age groups, and female individuals in the 9-year and 14-year age groups. The analy-ses for these age groups were repeated with individuals whose images were included in other image bank, and the reports generated by both methods for both male and female individuals were in agreement with the mean values found on clinical reports, con-sidering a significance level of 5%. Indi-vidual analyses were performed in the im-age sets whose im-age estimates were out of the significance range, considering a stan-dard deviation of 6 months as a reference in relation to the mean value found on clini-cal reports, with errors for both female and male groups ranging from 3.7% to 10%.
CONCLUSIONS
Based on the results achieved in the bone age estimation process with the ER5 and ER3 simplifications for both female and male individuals of all the age groups, the authors observed positive and high cor-relation with the mean values found on the clinical reports that may be observed on the item “Correlation” on Tables 1 and 2, with values > 0.5000 (50% agreement). By ob-serving the Student’s t-test results, one can note that they were statistically significant, with p = 0.05 (see the item Student’s t on Tables 1 and 2).
Therefore, one can conclude that the ER method simplifications can be safely uti-lized in the bone age estimation, with sig-nificant results as compared with the mean values found on clinical reports, addition-ally to the advantage of automatic opera-tion, contributing to the reduction of the subjectivity present in the classical meth-ods and also offering an appropriate solu-tion for bone age estimasolu-tion on large data-bases.
REFERENCES
1. Haiter Neto F, Almeida SM, Leite CC. Estudo comparativo dos métodos de estimativa da idade óssea de Greulich & Pyle e Tanner & Whitehouse. Pesqui Odontol Bras. 2000;14:378–84. 2. Oliveira HW, Veeck EB, Souza PHC, et al.
Ava-liação radiográfica da idade óssea em crianças in-fectadas pelo HIV por via vertical. Radiol Bras. 2006;39:27–31.
3. Tanner JM, Whitehouse RH, Healy MJR. A new system for estimating skeletal maturity from the hand and wrist, with standards derived from a study of 2,600 healthy British children. Part II: The Scoring System. Paris: International Children’s Centre; 1962.
4. Tavano O. Estudo das principais tabelas de ava-liação da idade biológica, através do desenvolvi-mento ósseo, visando sua aplicação em brasilei-ros leucodermas da região de Bauru [tese de dou-torado]. Bauru: Faculdade de Odontologia de Bauru – Universidade de São Paulo; 1976. 5. Taffarel B, Wangenhein AV, Silva PCA.
Proces-samento de imagens para análise e estimativa de problemas de crescimento ósseo em crianças. III Workshop de Informática Aplicada à Saúde – CBComp 2003; Florianópolis, SC, Brasil; 2003. 6. Haiter-Neto F, Kurita LM, Menezes AV, et al. Skeletal age assessment: a comparison of 3 meth-ods. Am J Orthod Dentofacial Orthop. 2006;130: 435.e15–20.
7. Olivete CJ. Estimativa da idade óssea através da análise carpal baseada na simplificação do mé-todo de Eklof & Ringertz [dissertação de mes-trado]. São Carlos: Departamento de Engenharia Elétrica – Universidade de São Paulo; 2005. 8. Ayres M. BioEstat. Versão 3.0. Belém: Sociedade
Civil Mamirauá, MCT – CNPq; 2005. [acessado em 10 de fevereiro de 2009]. Disponível em: www.mamiraua.org.br
9. Nascimento MZ, Frere AF, Marques MA, et al. Subtraction of images for automatic determina-tion of center of the radiadetermina-tion field. Engineering in Medicine and Biology Society. Proceedings of the 25th Annual International Conference of the IEEE. 2003;1:937–40.
10. Olivete CJ, Rodrigues ELL, Nascimento MZ. O efeito da correção do “efeito heel” em imagens radiográficas da mão. Rev Bras Fís Méd. 2005; 1:38–51.
11. Gonzalez RC, Woods RE. Digital image process-ing techniques. New York: Addison Wesley; 1993.
12. Otsu N. A threshold selection method from gray-level histograms. IEEE Trans Systems Man Cybernet. 1997;9:62–6.
13. Abutaleb AS. Automatic thresholding of gray-level pictures using two dimensional entropy. Comput Vision Graph Image Process. 1989;47: 22–32.
14. Kapur JN, Sahoo PK, Wong AKC. A new method for gray-level picture thresholding using the en-tropy of the histogram. Comput Vision Graph Image Process. 1985;29:273–85.
15. Olivete CJ, Rodrigues ELL. Software automático para determinação da idade óssea baseado no método de Eklof & Ringertz. Rev Bras Fís Méd. 2009;2:15–9. [acessado em 25 de março de 2009]. Disponível em: http://www.abfm.org.br/rbfm/ publicado/au_tra_72_p15-19.pdf