REVIEW ARTICLE DOI: 10.5007/1980-0037.2011v13n3p230
Abstract – Physical growth is one of the most important aspects of child and adolescent growth. Measurements of weight and height using speciic charts for each population are needed to adequately monitor growth. The aim of this study was to review the literature regarding growth curves for individuals with Down’s syndrome (DS). Sources of the pri-mary and secondary literature were reviewed searching the following databases: CREUSP, PubMed, Medline, and section libraries of UNICAMP. The results showed an approximate growth of -1.5 to -4 standard deviations in subjects with DS when compared to the ge-neral population, with this difference starting during the prenatal period and extending into adulthood. No major differences were found between studies conducted in different countries. In conclusion, patients with DS present growth retardation when compared to the general population, resulting in shorter inal height.
Key words: Growth charts; Children; Adolescents.
Resumo – O crescimento físico é um dos mais importantes aspectos a serem considerados na saúde de crianças e adolescentes. E para um adequado acompanhamento do crescimento são necessárias avaliações de peso e estatura, utilizando-se gráicos provenientes de cada população em questão. O objetivo do presente estudo foi realizar uma revisão da literatura sobre curvas de crescimento de sujeitos com Síndrome de Down (SD). Foram revisadas fontes de literatura primárias e secundárias, através das ferramentas de busca: CREUSP, PUBMED, MEDLINE e bibliotecas setoriais da UNICAMP. Os resultados demonstram um crescimento aproximado em -1.5 a -4 desvios padrão em sujeitos com SD, quando comparado à população típica, iniciada esta diferença durante a fase pré-natal e se estendendo até a idade adulta. Não ocorrendo alterações de grandes amplitudes entre estudos de diferentes nacionalidades. Com isso, conclui-se que o crescimento de sujeitos com SD apresenta valores menores quando comparados à população típica, resultando em uma estatura inal inferior.
1 Universidade Estadual de Campinas. Grupo de Pesquisa e Estudo em Avaliação Motora Adaptada. Campinas. SP. Brasil.
2 Bolsista de mestrado CNPq.
Received: 24 May 2010 Accepted: 16 January 2011
1 1 2 2
José Irineu Gorla Edison Duarte Leonardo Trevisan Costa Fábia Freire
Growth of children and adolescents with Down’s
syndrome. A brief review of the literature
Down’s syndrome (DS) is a genetic disorder that was described by John Langdon Down more than a century ago1. The disease is characterized
by the presence of an extra chromosome that alters motor, physical and intellectual development2-4. It
is one of the most frequent causes of intellectual disability, accounting for about 18% of all cases of intellectual deiciency seen at specialized educa-tional facilities and rehabilitation centers in Brazil5.
DS is identiied by fetal karyotyping performed in the irst months of pregnancy and can manifest in three ways: simple nondisjunction in 95% of cases, translocation of chromosome 21 in 4%, and mosaicism in 1%6. The nondisjunction that causes
trisomy 21 originates from the egg in 95% of cases and from the sperm in 5%7.
Epidemiological data show an incidence of DS of 1 in 600 live births in Brazil8,9 and the Brazilian
regular education system includes children with disabilities. The inclusive education movement has been gaining grounds worldwide as the result of the UNESCO World Conference on Special Needs Education held in 1994, when the Sala-manca Statement was adopted and education was discussed as a human rights issue10,11. In Brazil, this
movement also started in the 1990s and is sup-ported by the 1988 Federal Constitution and by the Law of Directives and Bases of National Education No. 9.394/96, which establish that everyone has the right to education and that individuals with dis-abilities should attend regular education classes11,12.
As a consequence, the participation of chil-dren with DS in the regular education system will become increasingly more common and physical education teachers will require appropriate and speciic parameters to evaluate these children. In this respect, considering the importance of anthropometric data for the assessment of health,
adolescents, we reviewed the literature regarding growth charts for subjects with DS in order to of-fer updated information to professionals working in this area.
METHODOLOGICAL PROCEDURES
The present study is a qualitative literature review, in which books, doctoral and Master’s theses and articles of the Pubmed (www.pubmed.com), Scopus (www.scopus.com) and CREUSP (bibliotecas-cruesp.usp.br) databases, and the section libraries of UNICAMP (libdigi.unicamp.br), comprising the period from 1920 to 2009, were searched. Health-related databases were chosen in view of the objective of the study. The following keywords were used for the search: Down syndrome, trisomy 21, mongolism, growth charts. The studies identi-ied were screened for investigations evaluating the growth of children and adolescents with DS and are shown in Table 1.
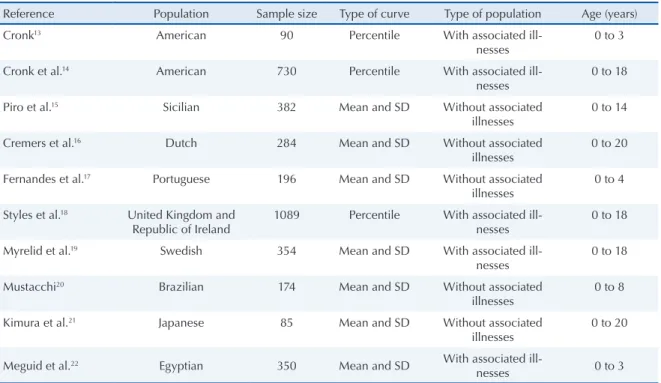
After identiication of the studies, the abstracts were read and studies considered to be relevant were read in full and iled. Theses, dissertations and monographs were also included because of the scarcity of studies on the subject. Thirty-seven studies were included in this review. Only 10 of these investigations were speciically dealing with growth charts, whereas the remaining ones inves-tigated variables that may inluence the physical growth of children and adolescents with DS. The following parameters were used for analysis of the studies: methodology, age group, sample size, place of data collection, and growth-associated vari-ables. The main characteristics of the studies that developed speciic growth charts for children and adolescents with DS are summarized in Table 2.
Table 3 shows the gestational age and mean birthweight of subjects with DS.
Table 1. Studies identified during the database search using combinations of the respective keywords.
DS DSG DSGC T21 T21G T21GC M MG MGC
Pubmed 19,323 921 17 3,557 227 0 23,356 39 0
Scopus 23,283 1,248 27 5,655 401 7 627 18 0
CRUESP 132 2 1 18 1 0 32 0 0
UNICAMP 41 2 2 6 0 0 0 0 0
Total 36,303 1,801 36 4,018 228 0 23,721 45 0
Growth of subjects with Down’s syndrome Gorla et al.
Table 3. Comparison of gestational age and mean birthweight between subjects with Down’s syndrome and the typical population.
Group No. of cases Gestational age (weeks)
Mean birth-weight (g)
Control 3,011 39.75 3,324
Down’s
syn-drome 180 38.78 3,007
Marcondes23.
RESULTS
With respect to studies identiied in books, Mar-condes23 investigated the growth of subjects with
DS from the prenatal period to adult age. The author reported that infants with DS present a lower mean weight and shorter stature at birth than newborns without DS. In addition, newborns with DS tend to be slightly premature (less than 37 weeks of gestation) and are born on average 7 to 10 days before the predicted date, with the body weight of these infants being lower than expected for their gestational age as shown in Table 3. Mar-condes23 also found that subjects with DS continue
to present a short stature throughout life. However, the degree of short stature varies according to age due to wide variations in growth velocity, with most of these subjects being -2 to -3 standard deviations below the reference population.
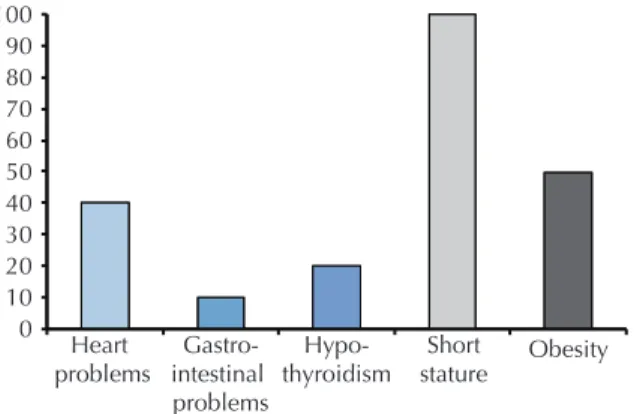
Batshaw and Perret24 described different
char-acteristics associated with DS, which are illustrated in Figure 1. The authors found a high incidence of factors that can inluence the growth of subjects with DS, such as hypothyroidism and heart prob-lems. An important fact indicated by the authors is the presence of short stature in 100% of subjects with DS and of obesity in 50%. One important study identiied among dissertations and theses retrieved from the section libraries of UNICAMP and from the CRUESP system is the investigation of Zan Mustacchi20, who developed weight-height
reference curves for children with DS from the urban region of the city of São Paulo. This is the irst growth chart for the Brazilian population with DS. For children from birth to 24 months of age, the author found a mean height of 83 cm for boys with DS compared to 87 cm for the control group. For girls with DS, the mean height was 81 cm versus 86 cm for the typical population. At 8 years, this difference was 10 cm for boys and 4 cm for girls. One limiting factor of that study was the age range of the subjects studied, which did not include the pubertal period.
Growth curves of children and adolescents with DS
The growth of subjects with DS has been stud-ied for more than 80 years, with the pioneering
Table 2. Characteristics of the studies that developed growth charts for children and adolescents with Down’s syndrome.
Reference Population Sample size Type of curve Type of population Age (years)
Cronk13 American 90 Percentile With associated
ill-nesses
0 to 3
Cronk et al.14 American 730 Percentile With associated
ill-nesses
0 to 18
Piro et al.15 Sicilian 382 Mean and SD Without associated
illnesses
0 to 14
Cremers et al.16 Dutch 284 Mean and SD Without associated
illnesses
0 to 20
Fernandes et al.17 Portuguese 196 Mean and SD Without associated
illnesses
0 to 4
Styles et al.18 United Kingdom and
Republic of Ireland
1089 Percentile With associated ill-nesses
0 to 18
Myrelid et al.19 Swedish 354 Mean and SD With associated
ill-nesses
0 to 18
Mustacchi20 Brazilian 174 Mean and SD Without associated
illnesses
0 to 8
Kimura et al.21 Japanese 85 Mean and SD Without associated
illnesses
0 to 20
Meguid et al.22 Egyptian 350 Mean and SD With associated
ill-nesses 0 to 3
studies of Brosseau and Brainerd25, Benda26 and
Oster27 who demonstrated a reduction in height of
approximately one standard deviation.
One of the irst growth charts for children with DS adopted worldwide was developed by Cronk et al.14 for the American population. The authors
collected body weight and height data for children aged 1 month to 18 years and demonstrated a reduc-tion of approximately 20% between the 3rd and 36th
month of life for both genders, of 5% between 3 and 10 years for girls, and of 10% between 3 and 12 years for boys. During puberty, a reduction of 27% was observed for girls aged 10 to 17 years and of 50% for boys aged 12 to 17 years. These indings suggest that the growth spurt during puberty (peak growth velocity) is less vigorous in subjects with DS when compared to those without DS. This phenomenon was observed by Rarick and Seefeldt28, who
demon-strated that peak growth velocity is slightly reduced in subjects with DS. Cronk et al.14 also found that
the increase in body weight exceeds height gain, resulting in an elevated body mass index. This fact may explain the high incidence of overweight and obesity among subjects with DS. With respect to DS subjects with heart problems, the authors showed a reduction in height and body weight of approximately 2 cm and 1 kg, respectively.
Since physical growth is one of the most im-portant child health indicators, after the proposal of Cronk et al.14, other studies developing growth
charts for children and adolescents with DS were conducted in different countries, such as Sweden, Japan, United Kingdom, Republic of Ireland, Sicily, The Netherlands, and Egypt, among others. For the development of growth charts for children and adolescents with DS in Sicily, Piro et al.15 evaluated
body weight, height and head circumference data obtained between 1977 and 1988 from 382 children
All children seen during the same period who had some associated disease, such as congenital heart disease, hypothyroidism and gastrointestinal malformation, were excluded. The results showed growth deicits in children with DS compared to those without DS.
In a study conducted in The Netherlands16,
growth charts were based on 2045 body weight and height records from 295 children with DS of both genders obtained from birth to 20 years of age. The authors obtained higher values than those reported in the American study conducted by Cronk et al.19. These differences may relect
genetic and environmental inluences and indicate the need for the development of growth charts for each country. However, comparison of the typi-cal Dutch population and with DS data showed a height deicit of -2.0 standard deviations. With respect to body weight, the weight/height ratio was above the 90th percentile after 10 years of age when
compared to children without DS.
The growth curve of Portuguese children with DS was developed based on the evaluation of 198 subjects with DS (107 boys and 91 girls aged 0 to 48 months, corresponding to approximately 32% of Portuguese children with DS17. The results
showed signiicant differences between children with DS and the typical population for all somatic parameters analyzed and for all age groups. Com-parison of mean body weight and height between Portuguese and American children revealed similar results until 24 months of age. After this age, Portuguese children presented slightly higher values than American children, probably because of secular trends in growth since the American study was conducted in 1988 and the Portuguese study in 2001.
In a study conducted in Sweden, Myrelid et al.19
evaluated body weight, height and head circumfer-ence in 354 children and adolescents with DS from birth to 18 years. The results showed a lower growth velocity when compared to the typical population from birth to adolescence, particularly during the period from 6 months to 3 years and during the pubertal period. Height after birth and inal height at 18 years corresponded to -1.5 and -2.5 standard deviations, respectively, when compared to the typical growth in Sweden. The authors observed that subjects with DS reached inal height early when compared to the control group (16 years for boys and 15 years for girls), in agreement with previous studies14,29. Regarding the pubertal period,
Growth of subjects with Down’s syndrome Gorla et al.
peak growth velocity was lower in subjects with DS, a fact contributing to a lower inal height.
Another study that developed growth charts for subjects with DS was conducted in the United Kingdom and Republic of Ireland16. The authors
analyzed the body weight, height and head cir-cumference of 1089 children and adolescents with DS from birth to 18 years of age, including 597 boys and 492 girls. With respect to body weight, 30% of the sample older than 10 years presented a body mass index above the 91st percentile and
20% above the 95th percentile when compared to
the typical population. The authors also observed a lower peak growth velocity in subjects with DS, resulting in lower height gains (cm/year) during puberty and in a lower inal height compared to the typical population.
For the Japanese population with DS, Kimura et al.21 evaluated 85 children (43 boys and 42 girls)
born between 1973 and 1985. Children diagnosed with mosaic DS and associated diseases were ex-cluded from the study. The results showed that inal height was lower in subjects with DS compared to the group without DS. The inal height was 1.53 m for boys and 1.41 m for girls versus 1.69 and 1.57 m for the control group.
Meguid et al.22 developed growth charts and
growth velocity curves based on 1700 body weight, height and head circumference records from 350 Egyptian children with DS aged 0 to 36 months, including 188 boys and 162 girls. Children with mosaic and translocation DS were excluded from the study. The assessments were performed at three
monthly intervals and the data were compared to those obtained for Egyptian children without DS of the same age during visits to Cairo hospitals. The children were divided into two groups: group 1 consisted of 260 children without congenital heart diseases (143 boys and 117 girls) and group 2 consisted of 90 children with mild to moderate congenital heart disease (45 subjects of each gen-der). Groups 1 and 2 presented a lower body weight, height and head circumference when compared to the population without DS. In boys of group 1, mean body weight was reduced by -1.5 standard deviations, height by -1.6 standard deviations, and head circumference by -1.8 standard deviations. In girls, these values were -1.6, -1.7 and -1.8 standard deviations, respectively. In contrast, much lower mean body weight, height and head circumference values were observed in boys of group 2 (associated congenital heart disease) when compared to group 1 and the control group, with a reduction of -2.8, -2.2 and -1.8 standard deviations, respectively. A similar trend was observed in girls, with a reduc-tion of -2.8, -2.9 and -1.9 standard deviareduc-tions for body weight, height and head circumference, respectively.
DISCUSSION
According to the theoretical framework reported, children with DS present a growth deicit that starts during the prenatal period and extends into adult life. This growth deicit shows similar in sub-jects with DS and no wide variations are observed
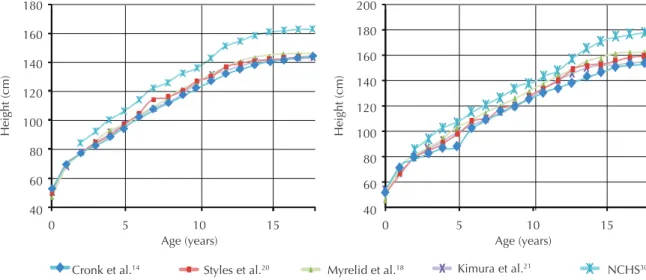
This fact is illustrated in Figure 2, which shows the growth of subjects with DS from birth to 18 years of age reported in different studies compared to the typical population.
The growth curves illustrated in Figure 2 dem-onstrate the inluence of puberty on the growth of children and adolescents with DS. As can be seen, the difference in height growth between subjects with DS and the typical population was relatively constant until the period of the growth spurt. When reaching the growth spurt, height gains (cm/year) were lower in the population with DS, increasing the difference to the typical population and resulting in a lower inal height.
One of the factors that possibly inluence the growth retardation of subjects with DS is a dei-ciency in insulin-like growth factor 1 (IGF-1), the main factor responsible for the actions of growth hormone (GH). IGF-1 is mainly produced by the liver and stimulates cell proliferation and somatic growth29. Another study31 analyzed the effects
of treatment with GH on the growth of subjects with DS. The 6-month growth rate increased from 2.3-2.8 cm to 3.3-5.8 cm. A higher concentration of IGF-1 was also observed after treatment with GH, but the gains were lower than those reported for the typical population. Similar results have been reported in a study following up 15 children with DS treated with GH for 3 years from the age of 6-9 months32. The mean height of children
treated with GH increased, with a reduction in the distance to the 50th percentile of the typical
population (-1.8 standard deviations before and -0.8 standard deviations after treatment compared to the Swedish standard). The low serum concentra-tions of IGF-1 became normal during treatment. However, the growth velocity declined after the discontinuation of treatment.
Zinc deiciency is another factor that may inlu-ence the growth and development of children with DS since this nutrient plays an important role in child development and growth. According to Wil-ke33, zinc supplementation in children with mild
deiciency increases appetite, growth velocity and GH, somatomedin and IGF-1 levels, and improves immunity. Zinc supplementation for 6 to 9 months was analyzed in 22 children with DS33. During this
period, the growth percentile increased in 68% of the sample. The growth velocity was practically twice as high and there was an increase in the plasma levels of GH and somatomedin. Similar
investigating zinc concentration in children with DS, which found a signiicant difference compared to the control group.
The growth deicit observed in children with DS can also be explained by the presence of heart problems37, upper airway obstruction during sleep38,
celiac disease39, thyroid deiciency40, and
inad-equate nutrition due to feeding problems generally observed in subjects with DS.
With respect to growth, there is consensus in the literature that children and adolescents with DS present a height deicit when compared to the typical population. This difference starts during the prenatal period and extends into adult life. This growth deicit is similar in subjects with DS and no wide variations are observed between studies conducted in different countries14-18,20,21.
CONCLUSIONS
The differences between studies investigating the growth of children and adolescents with DS im-pair the clinical characterization and assessment of weight-height development of these subjects. Some studies exclude subjects with mosaic or translocation DS, congenital heart diseases and associated diseases, whereas others do not adopt these exclusion criteria. Another limiting factor is the method adopted for the development of growth charts, with some studies using the mean and standard deviation, whereas others classify the subjects according to percentile. However, it is ac-cepted that the mean height of boys and girls with DS is reduced by approximately 1.5 to 4 standard deviations, i.e., less than the 5th percentile. The
largest growth deicits occur during the irst years of life and during puberty.
REFERENCES
1. Down JLH. Observations on an ethnic classiication of idiots. London Hospital Reports; 1866.
2. Jansson J, Johansson C. Down syndrome and celiac disease. J Pediatr Gastr Nutr 1995; 21:443-5
3. Rowland LPM. Tratado de Neurologia. Rio de Janeiro: Guanabara Koogan; 2000.
4. Sharav T, Collins RM, Baab PJ. Growth studies in in-fants and children with Down’s syndrome and elevated levels of thyrotropin. Am J Dis Child 1998; 142:1302-6.
Growth of subjects with Down’s syndrome Gorla et al.
6. Allt JE, Howell CJ. Down’s syndrome. Br J Anaesth 2003; 3(3):83–86.
7. Cooley WC, Graham JM. Common syndromes and management issues for primary care physicians – Down syndrome – An update and review for the primary pediatrician. Clin Pediatrics 1991; 233-253.
8. Garcias GL, Roth MGM, Mesko GE, Boff TA. Aspec-tos do desenvolvimento neuropsicomotor na síndrome de Down. Rev Bras Neurol 1995; 31:245-248.
9. Lima AS. Estado nutricional relativo ao zinco em pacientes com Síndrome de Down [Dissertação de Mestrado – Programa de Ciências Farmacêuticas]. São Paulo (SP): Universidade de São Paulo; 2002.
10. UNESCO. Declaração de Salamanca e linha de ação sobre necessidades educativas especiais. Brasília: Corde; 1994.
11. Oliveira-Menegotto LM, Martini FO, Lipp LK. Inclusão de alunos com Síndrome de Down: discurso dos profes-sores. Fractal Rev Psicol 2010; 22(1):155-168.
12. Mendes EG. A radicalização do debate sobre inclusão es-colar no Brasil. Rev Bras Educação 2006; 11(33):387-405.
13. Cronk CE. Growth of children with Down’s syndrome: birth to age 3 years. Pediatrics 1978; 61:564–8.
14. Cronk C, Crocker AC, Pueschel SM, Shea AM, Zackai E, Pickens G, Reed RB et al. Growth charts for children with Down syndrome: 1 month to 18 years of age. Pediatrics 1988; 81(1):102–110.
15. Piro E, Pennino C, Cammarata M, Corsello G, et al. Growth charts of Down syndrome in Sicily: evaluation of 382 children 0-14 years of age. Am J Med Gen Supp 1990; 7:66–70.
16. Cremers MJ, Van der Tweel I, Boersma B, Wit JM, Zonderland M, Lo Giudice C, et al. Growth curves of Dutch children with Down’s syndrome. J Intellect Disabil Res 1996; 40:412–420.
17. Fernandes A, Mourato AP, Xavier MJ, Andrade D, Fernandes C, Palha M. Characterisation of the so-matic evolution of Portuguese children with Trisomy 21 – Preliminary results. Down Syndrome Res Practice 2001; 6(3), 134-138.
18. Myrelid A, Gustafsson J, Ollars B, Annerén G. Growth charts for Down’s syndrome from birth to 18 years of age. Arch Dis Child 2002; 87:97–103.
19. Mustacchi, Z. Curvas padrão pôndero-estatural de portadores de Síndrome de Down procedentes da região urbana da cidade de São Paulo. [Tese de Doutorado – Programa de Pós-graduação em Farmacêuticas]. São Paulo (SP): Universidade de São Paulo; 2000.
20. Styles ME, Cole TJ, Dennis J, Preece MA. New cross sectional stature, weight, and head circumference refer-ences for Down’s syndrome in the UK and Republic of Ireland. Arch Dis Chil 2002; 87:104–108.
21. Kimura J, Tachibana K, Imaizumi K, Kurosawa K, Kuroki Y. Longitudinal growth and height velocity of Japanese children with Down’s Syndrome. Acta Paediatr 2003; 92(9):1039-1042.
22. Meguid NA, El-Kotoury AI, Abdel-Salam GM, El-Ruby MO, Aii HH. Growth charts of Egyptian children with Down syndrome (0-36 months). EMHJ 2004; 10:106-115.
23. Marcondes E. Crescimento normal e deiciente. São Paulo: Editora Sarvier; 1989.
24. Batshaw ML, Perret YM. Children with Disabilities – a medical primer. Baltimore: Paul H Brookes ;1992.
25. Brousseau K, Brainerd MG. A Study of the Physical and Mental Characteristics of Mongoloid Imbeciles. Baltimore: Williams and Wilkins; 1928.
26. Benda C. Studies in mongolism Growth and physical development. Arch Neural Psychiatry 1939; 1:83-95.
27. Oster J. Mongolism. Copenhagen: Danish Science Press Ltd; 1953.
28. Rarick GL, Seefeldt V. Observations from longitudinal data on growth in stature and sitting height of children with Down’s syndrome. J Ment Deic Res 1974; 18:63-78.
29. Arnell H, Gustafsson J, Ivarsson SA, Annerén G. Growth and pubertal development in Down syndrome. Acta Paediatr 1996; 9:1102-6.
30. National Center for Health Statistics (NCHS), Centers for Disease Control and Prevention (CDC). Clinical growth charts, 2000.
31. Anneren G, Sara VR, Hall K, Tuvemo T. Growth and somatomedin responses to growth hormone in Down’s syndrome. Arch Dis Child 1986; 1:48–52
32. Anneren G, Tuvemo T, Carlsson-Skwirut C, Lonner-holm P, Bang P, Sara V, Gustafsson J. Growth hormone treatment in young children with Down’s syndrome: effects on growth and psychomotor development. Arch Dis Child 1999; 80(4):334-338.
33. Wilke BC. Síndrome de Down. J Biomolec Me Free Rad 1998; 4(2): 39-43.
34. Napolitano G, Palka G, Lio S, Bucci I, Remigis P, Stup-pia L et al. Is zinc deiciency a cause of hypothyroidism in Down syndrome? Ann Genet 1990; 33(1):9-15.
35. Soto-Quintana M, Nava A, Atencio F, Granadillo A, Fernádez V, Ocando D, et al. Diminished zinc plasma concentrations and alterations in the number of lym-phocyte subpopulations in Down’s syndrome patients. Invest Clin 2003; 44(1):51-60
36. Yenigun A, Ozkinay F, Cogulu O, Coker C, Cetiner N, Ozzlen G, et al. Hair zinc level in Down syndrome. Downs Syndr Res Pract 2004; 9(2):53-7
Southall DP. Sleep related upper airway obstruction in a cohort with Down’s Syndrome. Arch Dis Child 1991; 66:1333-8.
39. Csizmadia CGDS, Mearin ML, Oren A, Krombout A, Crusius JB, Blomberg ME, et al. Accuracy and cost-effectiveness of a new strategy to screen celiac disease in children with down syndrome. J Pediatr 2000; 137:756-61
40. Karlsson B, Gustafsson J, Hedov G, Ivarsson S, An-neren G. Thyroid dysfunction in Down’s syndrome: relation to age and thyroid autoimmunity. Arch Dis Child 1998; 79:242-4.
Address for Correspondence
José Irineu Gorla
Rua General Osorio, n.39, apt. 123. Bairro Vila Martina.