ORIGINAL ARTICLE DOI: 10.5007/1980-0037.2011v13n3p216
1 2 1 1 1 1 1
Abstract – Physical growth and nutritional status are excellent health indicators since they permit the establishment of growth monitoring charts, especially for schoolchildren. The objective of this study was to compare the growth proile and nutritional status of schoolchildren between two samples (1997 and 2009). The data of physical growth and nutritional status obtained for the present sample of 645 schoolchildren (270 boys and 375 girls). The children were classiied according to the body mass index (BMI)-for-age refer-ence values of the WHO child growth standards. Although no signiicant differrefer-ences in height or body weight were observed between the children studied, these variables tended to increase from the irst to the second sample and in the two genders. With respect to the adequacy of BMI in boys, there was an increase in the percentage of children with low BMI-for-age, doubling of the percentage of obese children, and a reduction in the percentage of children with overweight. An increase in the number of subjects with low body weight, overweight and obesity and a decrease in the number of subjects with adequate BMI-for-age were noted among girls. In conclusion, there were no signiicant changes in the physical growth indicators (weight, height and BMI) over the period comprising the two samples (1997 and 2009). However, height, body weight and the number of subjects with risk of obesity and obesity tended to increase, especially among girls.
Key words: Growth; Nutritional status; Schoolchildren.
Resumo – O crescimento físico e estado nutricional são considerados excelentes indicadores de saúde, ao permitir o estabelecimento de padrões de monitoramento do desenvolvimento, principalmente de escolares. O estudo objetivou comparar o peril de crescimento e estado nutricional de escolares em dois momentos 1997 e 2009. Os dados do crescimento físico e do estado nutricional da amostra atual foram 645 escolares (270 do sexo masculino e 375 do sexo feminino). Foi utilizada a adequação IMC/Idade, utilizando-se como padrão de referência as curvas de crescimento da Organização Mundial da Saúde (OMS). Embora não tenham sido veriicadas diferenças estatisticamente signiicativas nos indicadores estatura e massa corporal dos escolares, foi possível observar uma tendência de aumento destas variáveis entre as duas amostras e em ambos os sexos.Em relação à adequação do IMC, observou-se um aumento no percentual de rapazes com IMC baixo para a idade, a duplicação do percentual de obesos e uma redução no percentual de sujeitos com sobrepeso. No grupo feminino, percebeu-se um aumento na quantidade de indivíduos com Baixo Peso, Sobrepeso e Obesidade e um decréscimo no número de escolares com IMC adequado para idade. Pode-se concluir que os indicadores de crescimento físico (peso, estatura e IMC) não apresentaram mudanças signiicativas no período de tempo compreendido entre as duas amostras (1997 e 2009). No entanto, foi possível veriicar uma tendência para incremento na estatura, na massa corporal e no número de sujeitos com Risco para Obesidade e Obesidade, principalmente no sexo feminino.
Palavras-chave: Crescimento físico; Estado nutricional; Escolares.
Comparative study of physical growth and nutritional
status of schoolchildren (1997 and 2009)
Crescimento físico e estado nutricional de escolares: estudo
comparativo – 1997 e 2009
Zenite Machado Ruy Jornada Krebs Joiana Dias Prestes Márcio Borgonovo dos Santos João Otacílio Libardoni dos Santos Glauber Carvalho Nobre Maria Helena da Silva Ramalho
1 Universidade do Estado de Santa Catarina. Cen-tro de Ciências da Saúde e do Esporte. Laboratório de Desenvolvimento e Aprendizagem Motora. Florianópolis. SC. Brasil.
2 “In memorian”
Received: 23 September 2010 Accepted: 10 December 2010
The World Health Organization (WHO)1 has
emphasized the need for studies investigating the growth rates and nutritional status of different populations, especially children and adolescents, from underdeveloped and developing countries. Detailed information about these variables is important to establish growth monitoring charts2.
In view of their close dependence on different environmental factors, these health indicators relect the past and present living conditions of children and adolescents3 since diseases and
nutrition disorders invariably affect child develop-ment, irrespective of their etiology4.
Although inadequate nutrition and low body weight continue to be a problem in many devel-oping countries, obesity now poses an equally serious threat to young people’s health5-7. For the
irst time in 200 years, the mean life expectancy of children and adolescents may decline due to this increase in obesity8. In Brazil, the growing
replacement of the food shortage problem by dietary excess, which is characterized by an im-portant reduction in malnutrition and an increase in the prevalence of obesity, has been observed for more than a decade. It is estimated that 13% of Brazilian children are currently obese and 20% are overweight. In relative terms, the rates of overweight and obesity have increased more than in other countries9.
In view of the complexity and variability of the nutritional proile in the Brazilian population, nutrition surveys of schoolchildren are an impor-tant tool to understand the growth dynamics and nutritional status of children and adolescents in Brazil10. In this respect, many studies have been
conducted in Brazil to identify and monitor the behavior of these variables11-23, especially in the
State of Santa Catarina13,15. In 1997, Machado and
Krebs12 investigated the physical growth proile
and nutritional status of schoolchildren aged 10 to 14 years from the Island of Santa Catarina and observed signiicant rates of overweight and obe-sity. In view of these indings and of the relevance of monitoring the development of schoolchildren, the objective of the present study was to identify possible changes in the physical growth proile and nutritional status of schoolchildren from the Island of Santa Catarina by comparing current data with those obtained for the sample investi-gated by Machado and Krebs12 in 1997.
This study compared the physical growth variables (height, body weight and body mass index [BMI]) of two distinct samples. The past sample (called 1997) consisted of 365 schoolchildren (168 boys and 197 girls). The data were collected in October 1997 in different districts of the Island of Santa Catarina12, except for the headquarter district.
The present sample (called 2009) consisted of 645 schoolchildren (270 boys and 375 girls). The data of this sample were collected between April and July 2009. For the purpose of comparison, the same age range (10 to 14 years) and geographic area were deined for collection of the data of the present sample.
A non-probability sampling procedure based on accessibility was used. Criteria for inclusion were place of residence in Florianopolis/SC/Brazil, age of 10 to 14 years, and absence of any physical deformity that could interfere with the height measurement. After approval of the study by Uni-versidade do Estado de Santa Catarina - UDESC (protocol 1740/2008), contact was made with the schools selected for data collection. Next, a free informed consent form was sent to the parents or legal guardians to authorize the participation of their children in the study.
The data of both samples (1997 and 2009) were collected in the schools by trained examiners. The protocol proposed by Gordon6 was adopted for the
measurement of body weight and height. For the evaluation of physical growth, the children were classiied according to the BMI-for-age values of the WHO child growth standards1. The following
Physical growth and nutritional status of schoolchildren Machado et al.
status (body weight, height, and BMI) accord-ing to gender, age and sample studied (1997 and 2009). The post hoc Newman-Keuls test was used to determine in which groups possible differences existed. In addition, chi-square adjustment was used to compare the frequency of observed values in the BMI-for-age classiication and the frequency of expected values between genders and samples. The level of signiicance was set at p<0.01 for all tests.
RESULTS
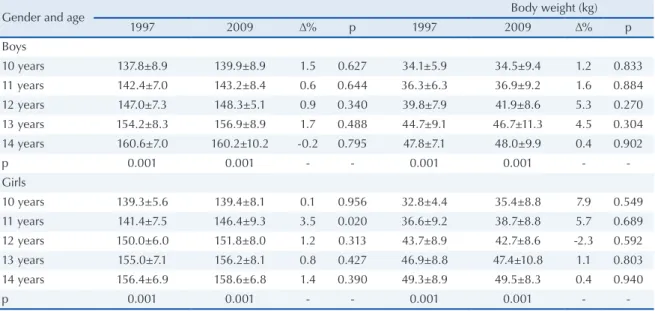
The mean height and body weight of the school-children are shown in Table 1. Boys of the 2009 sample were taller than boys of the 1997 sample at most ages, although the differences were not signiicant at the level of signiicance adopted for this study. Greater mean heights in the 2009 sam-ple were also observed for girls at most ages, but the differences were again not signiicant. Mean body weight values were also higher in the 2009 sample in both boys and girls at most ages, but no signiicant differences were observed between the two samples. Although this was not a longitudi-nal study, an increase of height and body weight with age was noted for the two genders and in the two samples (1997 and 2009), as indicated by the observation of signiicant differences at some ages. Figure 1 illustrates the dynamics of height according to age and gender in the two samples. In general, the subjects of this study presented an increase of height with age as expected. In the 1997 sample, girls began their growth spurt
(indi-cated by an increase in height) at about 11 years of age, with girls exceeding boys in height at 12 and 13 years (Figure 1). However, no signiicant differences between genders were observed at any age (10 years: p<0.897; 11 years: p<0.956; 12 years: p<0.894; 13 years: p<0.987; 14 years: p<0.892). In the 2009 sample, the onset of the growth spurt in girls tended to be earlier, possibly at 10 years of age. However, again no signiicant differences were observed between genders at the respective ages (10 years: p<0.757; 11 years: p<0.923; 12 years: p<0.856; 13 years: p<0.863; 14 years: p<0.838).
Figure 2 illustrates the dynamics of body weight according to gender and age in the two samples. As can be seen, in the 1997 samples girls were heavier than boys at about 11 years of age and continued to be until 14 years. However, a signiicant difference be-tween genders was only observed at 12 years (p<0.007). In the 2009 sample, girls also presented a higher body weight than boys. This fact was observed as early as at 10 years of age. However, again no signiicant differ-ences were observed between genders at the respective ages (10 years: p<0.899; 11 years: p<0.786; 12 years: p<0.899; 13 years: p<0.934; 14 years: p<0.892).
Analysis of the crude BMI values described in Table 2 showed lower mean values for boys of the 2009 sample at some ages (10 and 11 years) when compared to the 1997 sample. The opposite was observed at 12 and 13 years of age, with BMI being lower in the 1997 sample. Girls of the 2009 sample presented lower BMI than those of the 1997 sample at all ages, except for 10 years. However, no signiicant differences were observed at any age.
Table 1. Mean height and body weight of schoolchildren of the 1997 and 2009 samples according to age and gender.
Gender and age Body weight (kg)
1997 2009 ∆% p 1997 2009 ∆% p
Boys
10 years 137.8±8.9 139.9±8.9 1.5 0.627 34.1±5.9 34.5±9.4 1.2 0.833
11 years 142.4±7.0 143.2±8.4 0.6 0.644 36.3±6.3 36.9±9.2 1.6 0.884
12 years 147.0±7.3 148.3±5.1 0.9 0.340 39.8±7.9 41.9±8.6 5.3 0.270
13 years 154.2±8.3 156.9±8.9 1.7 0.488 44.7±9.1 46.7±11.3 4.5 0.304
14 years 160.6±7.0 160.2±10.2 -0.2 0.795 47.8±7.1 48.0±9.9 0.4 0.902
p 0.001 0.001 - - 0.001 0.001 -
-Girls
10 years 139.3±5.6 139.4±8.1 0.1 0.956 32.8±4.4 35.4±8.8 7.9 0.549
11 years 141.4±7.5 146.4±9.3 3.5 0.020 36.6±9.2 38.7±8.8 5.7 0.689
12 years 150.0±6.0 151.8±8.0 1.2 0.313 43.7±8.9 42.7±8.6 -2.3 0.592
13 years 155.0±7.1 156.2±8.1 0.8 0.427 46.9±8.8 47.4±10.8 1.1 0.803
14 years 156.4±6.9 158.6±6.8 1.4 0.390 49.3±8.9 49.5±8.3 0.4 0.940
-With respect to the adequacy of BMI (Ta-ble 3), significant differences were observed between the 1997 and 2009 samples for boys (
2
c
= 19.670; p<0.001). There was an increase inthe percentage of subjects with low BMI-for-age, doubling of the percentage of obese subjects, and reduction in the percentage of subjects at risk of obesity. For girls, comparison of the 1997 and 2009 samples showed a significant increase in the number of subjects with low BMI, risk of obesity and obesity, and a decrease in the num-ber of subjects with adequate BMI-for-age (
c
2 = 39.178; p<0.001).Comparison of the adequacy of BMI between genders showed significant differences (
c
2= 9.523; p<0.013). In the 1997 sample, the percent-age of schoolchildren with adequate BMI-for-percent-age and obesity was higher among girls and the percentage of children with low BMI and risk of obesity was higher among boys. In the 2009 sample, the percentage of subjects with risk of obesity and obesity was higher among girls, al-though no significant differences were observed between BMI categories (c
2= 5.025; p<0.170).Figura 2. Dynamics of body weight [according to age and gender in the two samples.
Table 2. Mean body mass index of schoolchildren of the 1997
and 2009 samples according to age and gender.
Gender and age
Body mass index (unidade ?)
1997 2009 ∆% p
Boys
10 years 17.9±2.17 17.5±3.74 -2.2 0.875 11 years 18.0±1.58 17.8±3.25 -1.1 0.992 12 years 18.3±2.88 19.0±3.68 3.8 0.968 13 years 18.6±2.33 18.7±3.11 0.5 0.855 14 years 18.5±2.51 18.5±2.55 0.0 0.934
p 0.895 0.798 -
-Girls
10 years 16.8±1.58 18.0±3.35 7.1 0.581 11 years 18.1±3.45 17.9±3.09 -1.1 0.994 12 years 19.3±3.20 18.3±3.49 -5.2 0.857 13 years 19.4±2.61 19.3±3.60 -0.5 0.938 14 years 20.1±3.12 19.6±3.31 -2.5 0.541
p 0.107 0.798 -
-Table 3. Adequacy of body mass index in schoolchildren of the
1997 and 2009 samples.
Adequacy of BMI
Boys Girls
1997 2009 1997 2009
N % N % N % N %
Low 4 2.4 11 4.1 3 1.5 9 2.4
Adequate 120 71.4 193 71.5 157 79.7 259 69.1 Risk of
obesity
37 22.0 43 15.9 28 14.2 68 18.1
Physical growth and nutritional status of schoolchildren Machado et al.
DISCUSSION
The present results showed no signiicant differ-ences in the height of boys or girls between the 1997 and 2009 samples. However, girls of the 1997 sample presented a greater height at ages 12 and 13, whereas girls of the 2009 sample achieved greater height at 11 and 12 years, a inding demonstrat-ing anticipation of the growth spurt. The greater heights at these ages observed for the 2009 sample agree with Pires and Lopes14, who evaluated the
physical growth of male and female schoolchil-dren from the city of Florianópolis and observed signiicant differences in height in favor of girls at ages 11 and 12. This anticipation might be ex-plained by factors related to the phenomenon of biopsychosocial stimulation, as well as by increased living standards, improved health conditions, and access to better quality food2,10,18.
Lower crude heights than those reported by Pires and Lopes14 were obtained in the present study
for girls and boys at all ages and in the two years of data collection. Fagundes26, investigating the
physi-cal growth of schoolchildren from different regions in the State of Santa Catarina between 2003 and 2004, also observed greater heights in girls than boys aged 11 to 13 years. Similar to the study of Pires and Lopes14, the height values reported by
Fagundes26 were also higher than those obtained in
the present study for boys and girls of all ages and for the two samples (1997 and 2009). This lower height of the present subjects might be explained by ethnic and cultural factors related to the dietary habits of the population studied. This suggestion is based on the trend of lower heights reported by Machado and Krebs12 who studied a sample from
the same geographic region, and is supported by the comparison of the height values obtained for the two samples with those of studies conducted in different regions of Brazil (Apucarana27, Rio de
Janeiro11, and northwestern Rio Grande do Sul28).
Another aspect is that the growth spurt may also be anticipated in boys as suggested by other studies18.
There were no signiicant differences in the body weight of boys or girls between 1997 and 2009. However, it should be noted that girls presented a higher body weight than boys at practically all ages in the two samples investigated (except at 10 years in the 1997 sample). As observed for height, the body weight values of the 1997 and 2009 samples tended to be lower than those reported in the cited studies.
Although the present study was not a lon-gitudinal investigation, a tendency towards a linear increase of height with age was observed, in agreement with other studies18,25. Like height,
body weight also tended to increase linearly with age despite the greater variability (unstable) of this variable. These indings suggest harmonious growth since increases in height were accompanied by body weight gains. Similar results have been reported in other studies14,18,24,25,28,29.
With respect to BMI adequacy, signiicant differences were observed between the 1997 and 2009 samples, with the observation of an increase in the frequency of obese individuals. In addition, with respect to gender, there was an increase in the number of obese subjects among boys and in the number of subjects with risk of obesity and obesity among girls. However, BMI values were lower in boys and girls of the 1997 and 2009 samples at all ages when compared to the study of Guedes et al27.
The same trend was observed for boys after age 11 and for girls aged 10 and 11 years when compared to the study of Anjos et al11. In general, the results
obtained indicate that malnutrition is not a mat-ter of concern for the population studied since the percentages of low BMI-for-age were low, despite a discrete increase of these percentages from 1997 to 2009, in agreement with the indings of national surveys10,11,30. However, the increase in the number
of subjects with risk of obesity and obesity par-ticularly among girls alerts to the need for a more effective monitoring of physical growth variables in children and adolescents in view of the global epidemic character of risk of obesity and obesity in adults.
CONCLUSION
1. World Health Organization. Child Growth Standards: Length/height-for-age, weight-forage,weight-for-length, weight-for-height and body mass index-for-age. Meth-ods and development. WHO (nonserial publication). Geneva, Switzerland: WHO, 2006. Disponível em: http :< //www.who.int/childgrowth/en/> [2009 jul 10]. 2. Saranga S, Maia J, Rocha J, Nhantumbo L, Prista A.
Crescimento somático na população africana em idade escolar. Estado actual do conhecimento. Rev Port Cien Desp 2006;6(1):81-93.
3. Reinehr T, Sousa G, Roth CL, Andler W. Androgens before and after Weight Loss in Obese Children. J Clin Endocrinol Metab 2005;90(10):5588-95.
4. Sigulem DM, Devincenzi MU, Lessa AC. Diagnóstico do estado nutricional da criança e do adolescente. J Pediatr 2000; 76 (Supl. 3):275-84.
5. Hossain P, Kawar B, Nahas M. Obesity and diabetes in the developing world—a growing challenge. N Engl J Med 2007;356(3):213-5.
6. Gordon CC, Chumlea WC, Roche, AF. Stature, re-cumbent length, and weight. In: Lohman TG, Roche AF, Martorell R, editors. Anthropometric Standardiza-tion Reference Manual. Champaign, Illinois: Human Kinetics Books; 1991. p. 3-8.
7. Mondini L, Levy, RB, Saldiva SRDM, Venância S, Aguiar JA, Stefanini MLR. Prevalência de sobrepeso e fatores associados em crianças ingressantes no ensino fundamental em um município da região metropolitana de São Paulo, Brasil. Cad Saúde Públ 2007;23(8):1825-34 8. Gouveia ER, Freitas DL, Maia JÁ, Beunen GP, Claes-sens AL, Marques A T et al. Atividade física, aptidão e sobrepeso em crianças e adolescentes:o estudo de crescimento da Madeira. Rev Bras Educ Fís Esp 2007;21(2):95-106.
9. Kohn M, Rees JM, Brill S, Fonseca H, Jacobson M, Katzman DK, et al. Preventing and treating adolescent obesity. J adolesc Health 2006;38(6):784-7.
10. Filho MB, Rissin A. A transição nutricional no Brasil: tendências regionais e temporais. Cad Saúde Públ. 2003;19 (supl 1):181-91.
11. Anjos LA, Castro IRR, Engstrom EM, Azevedo AMF. Crescimento e estado nutricional em amostra proba-bilística de escolares no Município do Rio de Janeiro, 1999. Cad. de Saúde Públ 2003;19(1):171-9.
12. Machado Z, Krebs RJ. Crescimento físico de escolares da ilha de Santa Catarina. Rev Bras Cineantropom Desempenho Hum 2001;3(1):7-19
13. Corso ACT, Buralli KO, Souza JMP. Crescimento físico de escolares de Florianópolis, Santa Catarina, Brasil: um estudo caso-controle. Cad Saúde Públ 2001;17(1):79-87.
14. Pires MC, Lopes AS. Crescimento físico e caracterís-ticas sóciodemográicas em escolares no município de Florianópolis, SC. Brasil. Rev Bras Cineantropom Desempenho Hum 2004;6(2):17-26.
alimentar de adolescentes de Teixeira de Freitas – Ba-hia. Rev Nutr 2005;18(5):623-32.
16. Torres AAL, Furumoto RAV, Alves ED. Avaliação Antropométrica de pré- escolares–comparação entre os referenciais: NCHS 2000 e OMS 2005. Rev Eletr Enferm 2007; 9(1):166-75.
17. Graup S, Pereira EF, Lopes AS, Araújo VC, Legnani RFS, Borgatto AF. Associação entre a percepção da imagem corporal e indicadores antropométricos de escolares. Rev bra. Educ Fis Esp 2008; 22(2):129-38. 18. Bergmann GG, Bergmann MLA, Pinheiro ES, Moreira
RB, Marques AC, Gaya ACA. Estudo longitudinal do crescimento corporal de escolares de 10 a 14 anos: dimorfismo sexual e pico de velocidade. Rev Bras Cineantropom Desempenho Hum 2008;10(3): 249-54. 19. Vanzelli AS, Castro CT, Pinto MS, Passos SD. Prevalência de sobrepeso e obesidade em escolares da rede pública do município de Jundiaí, São Paulo. Rev Paul Pediatr 2008;26(1):48-53.
20. Bojikian LP, Böhme MTS. Crescimento e composição corporal em jovens atletas de voleibol feminino. Rev bras Educ Fís Esp 2008;22(2):91-102.
21. Leone C, Bertoli CJ, Schoeps DO. Novas curvas de crescimento da Organização Mundial da Saúde: comparação com valores de crescimento de crianças pré-escolares das cidades de Taubaté e Santo André, São Paulo. Rev Paul Pediatr 2009;27(1):40-7.
22. Amorim STSP, Rodrigues AGM, Stolarski MC. Estatura de adolescentes matriculados em escolas da rede pública no estado do Paraná, Brasil. Rev Nutr 2009;22(2):195-205.
23. Silveira FJ, Lamounier JA. Avaliação nutricional de crianças do Vale do Alto Jequitinhonha com a utili-zação das novas curvas de crescimento do NCHS e da OMS. Rev Paul Pediatr 2009;27(2):133-8.
24. Glaner, MF. Crescimento físico em adolescentes do norte gaúcho e oeste catarinense. Rev Bras Cien Mov 2005;13(2):15-20.
25. Assis MAA, Rolland-Cachera MF, Vasconcelos FAG, Bellisle F, Calvo MCM, Luna MEP et al.Sobrepeso e baixo peso em crianças de 7 a 9 anos de idade de Florianópolis, Sul do Brasil: uma comparação com estudo francês usando protocolo similar. Rev Nutr 2006;19(3):299-308.
26. Fagundes TF. Crescimento e aptidão física de escolares do estado de Santa Catarina. [Dissertação de Mestrado – Programa de Pós Graduação em Ciências do Movi-mento Humano]. Florianópolis (SC): Universidade do Estado de Santa Catarina, 2005.
27. Guedes DP, Paula IG, Guedes JERP, Stanganelli LCR. Prevalência de sobrepeso e obesidade em crianças e adolescentes estimativas relacionadas ao sexo, à idade e à classe socioeconômica: Rev Bras Educ Fís Esp 2006;20(3):151-63.
Physical growth and nutritional status of schoolchildren Machado et al.
29. Januário RSB, Nascimento MA, Barazetti LK, Reichert FF, Mantoan JPB, Oliveira AR. Índice de massa cor-poral e dobras cutâneas como indicadores de obesidade em escolares de 8 a 10 anos. Rev Bras Cineantropom Desempenho Hum 2008;10(3): 266-70.
30. Monteiro CA, BenicioI MHA, KonnoI SC, SilvaI ACF, Lima ALL, CondeI WL et al. Causas do declínio da desnutrição infantil no Brasil,1996-2007. Rev Saúde Pública 2009;43(1):35-43.
Address for Correspondence
Zenite Machado.
Endereço: Rua João de Deus Machado, 74, apt 103, Trindade