Macrosegregation of Impurities in a Metallurgical Silicon Ingot After Transient Directional
Solidiication
Moyses Leite Limaa,b, Marcelo Aquino Martoranob*, João Batista Ferreira Netoa
Received: January 04, 2017; Revised: April 07, 2017; Accepted: May 25, 2017
Metallurgical grade silicon was melted and directionally solidiied in transient conditions by extracting heat from the base of a cylindrical ingot and inserting heat at the ingot top. A heat-transfer mathematical model was implemented to predict the solidiication velocity and temperature gradient using cooling curves measured directly in the silicon melt. Nearly 70% of the resulting ingot displays a region of columnar grains aligned with the ingot axis. In this region, the concentration of metallic impurities is usually below the quantiication limit of the analytical technique and intermetallic particles are absent, strongly indicating signiicant puriication. The transition from the puriied region of the ingot to the ingot top, where impurity concentrations increase and intermetallic particles are seen, is consistent with a change of the solid-liquid interface morphology from planar to cellular/dendritic, as similarly reported in the literature and as indicated by a preliminary analysis with the constitutional undercooling criterion.
Keywords: macrosegregation, metallurgical silicon, directional solidiication, silicon reining
* e-mail: [email protected]
1. Introduction
The demand for silicon in photovoltaic applications has increased in the past few decades, triggering the development of several metallurgical routes to produce solar grade silicon (SoG-Si) from metallurgical grade silicon (MG-Si)1. Directional solidiication is one of the most important steps in the metallurgical route2, because it causes macrosegregation of impurities and, consequently, puriication of the silicon ingot. Except for boron, phosphorus, and oxygen, most of the impurities existing in MG-Si segregate to one part of the ingot, decreasing impurity concentrations in the remaining part, which becomes puriied.
The macrosegregation of metallic impurities during MG-Si directional solidiication in Czochralski3, Bridgman4, and electron-beam furnaces5 has been investigated. Using the Czochralski method, Kuroda and Saitoh3 evaluated the
macrosegregation for constant pulling rates from 3 to 33 μm/s (0.2 to 2 mm/min) and observed an abrupt increase in the impurity concentration when a cellular structure began to form. Yuge et al.5 studied the solidiication of MG-Si in an electron beam furnace and found a sharp increase in the impurity concentration at the transition from a planar to a cellular/dendritic interface. In a Bridgman furnace, Martorano et al.4,6 observed that an increase in pulling velocity from 10 to 110 μm/s decreased macrosegregation signiicantly.
In these studies, the solid-liquid interface velocity and temperature gradient were kept approximately constant during each experiment, requiring a relatively complex experimental technique. A simpler and more convenient directional solidiication technique, referred to as transient solidiication, consists of extracting heat from the ingot base, while the other ingot faces remain thermally insulated. Similar techniques are used in industrial processes such as the HEM (“heat exchanger method”)7 to obtain polycrystalline silicon ingots from pure silicon feedstock. Despite the simplicity of this method, the temperature gradient and solidiication velocity are not constant during solidiication, evolving according to an uncontrolled and complex pattern. The efects of this speciic pattern on the solid-liquid interface morphology, grain structure, and macrosegregation of impurities have not been studied in the literature.
The simplicity of the transient solidiication method could be used to design a more economical directional solidiication step to purify MG-Si. Therefore, the objective of the present work is to investigate the macrosegregation of metallic impurities and the type of grain structure existing in an ingot obtained from a MG-Si melt solidiied directionally under transient conditions. To characterize the heat transfer conditions in the experiments, the temperature was measured in the silicon melt/ingot and was used to adjust a heat transfer mathematical model, which allowed calculations of the instantaneous solid-liquid interface velocity and temperature gradient.
a Laboratory of Metallurgical Processes, Institute for Technological Research, Avenida Professor
Almeida Prado, 532, 05508-901, São Paulo, SP, Brazil
b Department of Metallurgical and Materials Engineering, University of São Paulo, Avenida Professor
2. Transient Directional Solidiication
Experiments
A charge of 8 kg of MG-Si with composition obtained by ICP-OES (Table 1) was melted in a graphite-clay crucible coated with silicon nitride and located within an electric resistance (MoSi2) furnace (Figure 1). An argon atmosphere created with a low of 15 to 20 Nl/min was maintained over the melt surface to prevent excessive silicon oxidation. After the charge was melted, the furnace was held for 40 min at 1600 ºC to homogenize the molten silicon temperature at approximately 1550 ºC. A water-cooled copper block was brought in contact with the crucible base to extract heat from the melt and cause its transient directional solidiication upwards. There were heating resistance sets near the crucible lateral wall and crucible top to control the melt cooling and solidiication. The top heater set was programmed to a cooling rate of 0.3 ºC/min and the lateral heater set to 0.5 ºC/ min, leading to a decrease in solidiication velocity and an increase in temperature gradient during solidiication, which usually increase the macrosegregation of solute elements.
Two type-B (Pt-6 pct Rh / Pt-30 pct Rh) thermocouples were mounted inside alumina sheaths of 10 mm external diameter and inserted into the silicon melt, along the cylindrical crucible axis, to measure the cooling curves at two points during the experiment. The thermocouples were connected to a data acquisition system to register the cooling curves with a sampling rate of 2 Hz. One thermocouple cold-junction was located at the ingot base and the other, near the melt top, at 10 mm below the free surface of a silicon melt of 100 mm height.
A longitudinal slice 40 mm wide and 20 mm thick was cut of from the center of the cylindrical ingot (210 mm diameter) for macro and microstructure examination and for chemical analysis (Figure 2) to reveal macrosegregation. For the macrostructure examination, the longitudinal face of the slice was irst grinded with 200, 400, 600, and 1000 mesh sandpapers and then heated up to 90 ºC for etching in an aqueous solution of NaOH. To reveal the microstructure, this same face was polished using diamond paste (6, 3, and 1 μm)
Table 1. Partition coeicient between solid and liquid for solute element i (k0i), difusion coeicient of element i in the liquid (Dli),
solubility of element i in solid Si (SL)4; and the concentration of the main metallic impurities in the MG-Si (C
0i) used in the experiment.
Element (i) k0i Dli (m2/s) SL (ppmw) C
0i (ppmw)
Fe 8.0 x 10⁻⁶ 1.8 x 10⁻⁸ 0.3 1464
Ni 8.0 x 10⁻⁶ 1.8 x 10⁻⁸ 4.2 22
Ti 3.6 x 10⁻⁶ 1.5 x 10⁻⁸ 0.14 98
V 4.0 x 10⁻⁶ 1.6 x 10⁻⁸ 0.18 4
Mn 1.0 x 10⁻⁵ 1.6 x 10⁻⁸ 0.29 128
Cr 1.1 x 10⁻⁵ 1.6 x 10⁻⁸ 0.37 4
Cu 4.0 x 10⁻⁴ 1.7 x 10⁻⁸ 1.8 9
Al 2.0 x 10⁻³ 6.8 x 10⁻⁸ 20 534
Figure 1. Schematic view of the furnace showing the crucible,
water-cooled cooper block, thermocouples to control the heating sets and to measure the temperature in the molten/solid silicon.
Figure 2. Scheme of sample deinition for macro and microstructure
examination and for chemical analysis (dimensions in mm).
3. Mathematical Model Description
A mathematical model is proposed and implemented to calculate the solid-liquid interface velocity and temperature gradient in the transient directional solidiication experiment described in section 2. The following unidirectional heat conduction equation written for a reference system at the ingot base was solved
transition. Examples of microstructures from above and below this transition are illustrated in Figure 4. Details of one particle found in a region at 75 mm from the ingot base (Figure 4c) is shown in Figure 4f. Four EDS (energy dispersive spectroscopy) microanalyses were carried out in the spots shown within this particle, indicating the presence of mainly Si, Fe, Mn, and Ti.
In Figure 5, the macrosegregation proiles of Fe, Al, Mn, and Ti measured by ICP-MS as a function of the relative position in the axial direction, x/L (x is the distance from ingot base and L is the ingot length), are given. The solubility limit (SL) of each element in solid Si (Table 1) and the quantiication limits (QL) of the chemical analyses are indicated for each impurity. The concentration proiles show a macrosegregation of impurity elements towards the ingot top (x/L = 1), which was the last region to solidify. This type of macrosegregation proile is usually observed after solidiication with a planar solid-liquid interface, because when solidiication occurs with a dendritic/cellular interface, solute transport from the mushy zone into the bulk liquid is hindered, decreasing or even eliminating macrosegregation. Note that the relative concentration of the impurities are signiicantly below the initial composition of the MG-Si melt (Ci /C0i = 1) along 70% of the ingot height, indicating
an important puriication efect achieved with the transient solidiication conditions.
The position where the irst intermetallic compounds were found in the microstructure (Figure 4c) coincides with the abrupt increase in impurity concentrations above the solubility limit seen in Figure 5. Moreover, it also coincides with the transition in grain structure indicated by the dashed line in Figure 4a. Therefore, the increase in impurity concentration, the formation of intermetallic particles, and the change in grain morphology are all related. These observations are consistent with the results of Yuge et al.5, who associated the macrostructure transition and
the appearance of intermetallic particles with the interface morphology transition from planar to cellular/dendritic.
( )
C Tt x K xT H ts 1
P 2 f
2 2 2 2 2 2 2
t =
S
X
+tDf
where T is temperature; ρ is density; Cp is the heat capacity; K is thermal conductivity; ΔHf is latent heat per unit mass; and ԐS is the solid fraction, which was assumed to change linearly from 0 to 1 in a narrow temperature interval between 1414 ºC (melting point of pure silicon) and 1413.9 ºC. This solidiication temperature interval of 0.1 ºC for the MG-Si was assumed arbitrarily small to model the solidiication of silicon with a very limited amount of impurities. Initially, the system was assumed a liquid of homogenous composition and uniform temperature (1550 ºC). Eq. (1) was solved numerically using the implicit inite volume method8 with a mesh of at least 1000 volumes and a time step of 0.01 s, using as boundary conditions the temperatures measured by two thermocouples, one located near the ingot base (thermocouple 1) and the other, near the ingot top (thermocouple 2). The thermophysical properties adopted9 for silicon in the simulations were K = 58.2 W/m K, ρ = 2560 kg/m³, CP = 968 J/kg K, and ΔHf = 1.787 x 10⁶ J/kg.
4. Experimental Results
The two cooling curves measured in the experiments and used as boundary conditions of the mathematical model are given in Figure 3. The reference time (t = 0) is the moment
when the water-cooled copper block contacted the crucible bottom and began to extract heat. Between 7.5 and 8.5 h of cooling, an abrupt decrease in temperature is observed in the thermocouple 2, which probably indicates the end of the ingot solidiication.
The grain structure of the resulting ingot (Figure 4a) consists essentially of columnar grains aligned with the ingot axis (solidiication direction), as generally expected in directionally solidiied ingots. At about 70 mm from the ingot bottom, there is a structure transition, above which grains display serrated boundaries and are not clearly columnar or aligned. Yuge et al.5, Kuroda and Saitoh3 observed similar
grain structure transitions, which were considered as a transition of solid-liquid interface morphology from planar to cellular/dendritic. Therefore, the serrated boundaries could be a result of a cellular/dendritic interface morphology.
The microstructures of the ingot samples were examined with an optical (Figure 4b, c, d, and e) and scanning electron microscopes (Figure 4f). Intermetallic particles were seen only in the samples from above the grain structure
Figure 3. Cooling curves measured directly in the silicon melt during
Figure 4. Metallurgical structure of the resulting ingot (central portion): (a) macrograph (etchant: NaOH solution at 90 ºC)
and (b,c,d,e) micrographs of the longitudinal section, with arrows pointing to intermetallic particles (no etching, optical microscopy), from diferent positions relative to the ingot base (indicated on the right). Details of an intermetallic found in (c) are given in (f), showing four spots where EDS microanalyses were carried out (scanning electron microscopy with backscattered electron).
Figure 5. Proiles of relative concentration measured by ICP-MS along the axial direction at the ingot center for (a) Fe, (b)
Therefore, below the dashed line (x ~ 70 mm) indicated in Figure 4a, the ingot probably solidiied with a planar solid-liquid interface, whereas above the line it solidiied with a dendritic/cellular interface.
5. Discussion
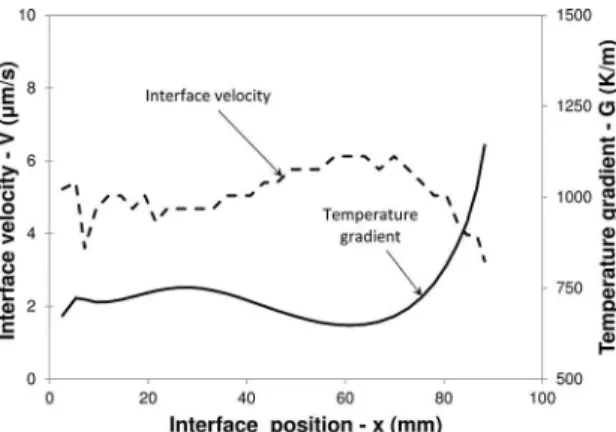
The solid-liquid interface velocity (V) and the temperature
gradient (G) at the liquid adjacent to the interface were
calculated with the present mathematical model as a function of the interface position (Figure 6), after calculating the temperature ield. The transient character of the directional solidiication experiment is evident from the variations of
V and G during solidiication. Average values of V~5 μm/s
and G~800 K/m are observed until approximately 70% of the
ingot has solidiied. Thereafter, V decreases and G increases.
The observed values and variations of V and G are a result of the particular heat input during solidiication from the heating elements located near the crucible wall and top. Without this heat input, a larger V and a lower G would be
expected, which would favor the formation of a mushy zone and a consequent decrease in macrosegregation. Therefore, an understanding of the conditions to stabilize the planar solid-liquid interface is needed to increase macrosegregation and puriication.
solidiication; k0i is the solute partition coeicient for element i, also obtained from the binary phase diagram; and Dli is the difusion coeicient of element i in the liquid. Some of these
parameters are given in Table 1. The values of G and V were calculated with the present mathematical model (Figure 6). Considering that the difusion of elements in solid Si is negligible, the values of Csi at the planar solid-liquid interface
are maintained in the solid after the end of solidiication and, therefore, can be obtained from the measured macrosegregation proiles of Fe, Mn, Ti, Al, Ni, V, Cr and Cu. Some of these proiles are given in Figure 5, showing that many of the concentration measurements are below the quantiication limit (QL) of the analytical technique. For these measurements, two diferent values of Csi were adopted to calculate the CSC parameter in the right-hand side of Eq. (2): one is QL and the other is the concentration calculated from Scheil model10, given below
Figure 6. Mathematical model results for the interface velocity
(V) and the temperature gradient (G) at the liquid adjacent to the
solid-liquid interface as a function of the interface position along the axial direction.
The stability of a planar solid-liquid interface was evaluated in the present work conditions by application of the constitutional supercooling criterion (CSC), as described by Martorano et al.4, using the following equation
( ) ( ) CSC V G D k
m C 1 k
2 >
li i li si i
i N 0 0 1 =-
-= # &
/
where i is a solute element; N is the total number of
solute elements considered in the analysis (N = 8); mli is the liquidus line slope obtained from the phase diagram for the binary system of Si and element i; Csi is solute concentration in the solid adjacent to the solid-liquid interface during
( / ) ( )
C k C 1 x L ( ) 3
si= 0i 0i - k0i-1
Note that the actual value of Csi should be in the range
between QL and that given by Scheil model, in which complete mixing of liquid composition is assumed. To illustrate these concentrations, the measured macrosegregation proile, the QL, and the concentration given by Scheil equation for Fe are shown in Figure 7.
Figure 7. Proiles of relative concentration of Fe measured by
ICP-MS and calculated with Scheil equation. The solubility limit (SL) of the element in the solid phase and the quantiication limit of the ICP-MS analyses (QL) are also shown.
Figure 8. Calculations of G/V and of the CSC parameter for measured concentrations (ICP-MS) and Scheil model concentrations (CSC-Scheil) as a function of the distance from the ingot base (x).
micro and macrostructure of the ingot indicate solidiication with a planar solid-liquid interface up to x ~ 70 mm, which is in between the values given by CSC_ICP-MS (x = 0) and CSC_ICP-MS (x ~ 82 mm). To be consistent with this interval, the actual unknown CSC line (based on the actual unknown Csi value) should lie between the CSC_ICP-MS
and CSC_Scheil lines to give a planar interface up to x ~ 70 mm. This seems to occur, because the actual Csi value is certainly below the QL and probably above the value given by Scheil model, as explained in the next paragraph.
In the Scheil model, complete mixing of the liquid composition is assumed, representing the fastest possible transport of solute from the solid-liquid interface into the bulk liquid. This fast solute transport decreases the concentration in the solid (Csi) to its minimum possible value and increases
macrosegregation to its maximum value. The hypothesis of complete liquid mixing in Scheil model is consistent with a vigorous forced liquid convection. In the present experiment, however, there was less vigorous thermal convection, probably due only to radial temperature gradients. Therefore, macrosegregation would be less intense and the actual Csi
would be larger than the Csi given by Scheil equation (Eq. 3).
Approximately 70% of the ingot has been signiicantly puriied in relation to the initial MG-Si composition (C0i)
for the present transient solidiication technique, which is simpler than other directional solidiication methods, such as the Bridgman directional solidiication. The solidiication velocity prevailing during solidiication of the puriied region of the ingot was approximately 5 μm/s, which is similar to the velocity reported by Martorano et al.4 for signiicant puriication in the Bridgman furnace. The temperature gradient calculated in the present work (G~800K/m), however, is lower
than those observed by Martorano et al.4 and by Kuroda et al.3 (G~2000K/m), but similar to that reported by by Yuge et al.5 (750 K/m < G < 1000 K/m).
6. Conclusions
Metallurgical grade silicon was melted and directionally solidiied by extracting heat from the base of a cylindrical ingot and inserting heat at the ingot top to control solidiication conditions. This technique is called transient directional solidiication, in which the solidiication velocity and temperature gradient are neither constant nor directly controlled. This technique is usually simpler than traditional techniques, such as the Bridgman furnace solidiication. Nearly 70% of the resulting cylindrical ingot (100 mm height; 210 mm diameter) consists of columnar grains approximately aligned with the heat extraction lux, whereas the remaining ingot consists of grains with serrated boundaries and no apparent common alignment direction. The columnar grain structure coincides with a region of solute concentrations usually below the quantiication limit of the analytical technique and without intermetallic particles, indicating a signiicantly puriied region in comparison with the metallurgical silicon composition. The observed grain structure transition was also reported by diferent authors3,5 and is consistent with a transition of the solid-liquid interface morphology from planar (columnar aligned grains) to cellular/dendritic during ingot solidiication. The position of the transition region is also consistent with a preliminary analysis carried out using the constitutional supercooling criterion. Finally, the present work results indicate that 70% of an ingot formed from a metallurgical grade silicon melt can be eiciently puriied by a transient directional solidiication technique.
7. Acknowledgements
Authors thank the support from Companhia Ferro-Ligas Minas Gerais (Minas Ligas), National Bank for Social and Economic Development (BNDES), and Conselho Nacional de Desenvolvimento Cientíico e Tecnológico (CNPq) (311206/2014-0).
8. References
1. Pizzini S. Towards solar grade silicon: Challenges and beneits
for low cost photovoltaics. Solar Energy Materials & Solar
Cells. 2010;94(9):1528-1533.
2. Safarian J, Tranell G, Tangstad M. Processes for upgrading
metallurgical grade silicon to solar grade silicon. Energy
Procedia. 2012;20:88-97.
3. Kuroda E, Saitoh T. Growth and characterization of polycrystalline
silicon ingots from metallurgical grade source material. Journal
of Crystal Growth. 1979;47(2):251-260.
4. Martorano MA, Ferreira Neto JB, Oliveira TS, Tsubaki TO. Macrosegregation of Impurities in Directionally Solidiied
Silicon. Metallurgical and Materials Transactions A.
5. Yuge N, Hanazawa K, Kato Y. Removal of Metal Impurities in Molten Solicon by Directional Solidiication with Electron
Beam Heating. Materials Transactions. 2004;45(3):850-857.
6. Martorano MA, Ferreira Neto JB, Oliveira TS, Tsubaki TO. Reining of metallurgical silicon by directional solidiication.
Materials Science and Engineering B. 2011;176(3):217-226.
7. Khattak CP, Basaran M, Schmid F, D’aiello RV, Robinson PH, Firester AH. Metallurgical silicon substrateproduced by HEM
for epixitaxial thin ilms solar cells. In: Proceedings of 15th
IEEE Photovoltaic Specialists Conference; 1981 May 12-15;
Orlando, FL, USA. p. 1432.
8. Patankar SV. Numerical heat transfer and luid low. New York:
Hemisphere Publishing; 1980.
9. Mills KC, Courtney L. Thermophysical properties of silicon.
ISIJ International. 2000;40(Suppl P):S130-S138.
10. Flemings MC. Solidiication Processing. New York: