ISSN 0104-6632 Printed in Brazil
www.abeq.org.br/bjche
Vol. 26, No. 04, pp. 745 - 755, October - December, 2009
Brazilian Journal
of Chemical
Engineering
THERMODYNAMIC SIMULATION OF BIOMASS
GAS STEAM REFORMING FOR A SOLID OXIDE
FUEL CELL (SOFC) SYSTEM
A. Sordi
1,2,3,*, E. P. da Silva
1, A. J. M. Neto
2,4, D. G. Lopes
2,4,
C. S. Pinto
2,4and P. D. Araújo
1,51
State University of Campinas, (UNICAMP), Interdisciplinary Center of Energy Planning (NIPE), P.O. Box 1170, Zip Code: 13084-971, Campinas - SP, Brazil.
2 State University of Campinas, (UNICAMP), Physics Institute, Hydrogen Laboratory,
P.O.Box 6039, Zip Code: 13283970, Campinas - SP, Brazil.
3
State University of Campinas, (UNICAMP), Mechanical Engineering School, Energy Department, P.O. Box 6039, Zip Code: 13283970, Campinas - SP, Brazil.
4
Hytron Hydrogen Technology®, Zip Code: 13085270, St. Candida, Campinas - SP, Brazil.
5Aqua Gênesis, Zip Code: 13080030, Campinas - SP, Brazil.
E-mail: [email protected]
(Submitted: June 12, 2008 ; Revised: May 26, 2009 ; Accepted: July 27, 2009)
Abstract - This paper presents a methodology to simulate a small-scale fuel cell system for power generation using biomass gas as fuel. The methodology encompasses the thermodynamic and electrochemical aspects of a solid oxide fuel cell (SOFC), as well as solves the problem of chemical equilibrium in complex systems. In this case the complex system is the internal reforming of biomass gas to produce hydrogen. The fuel cell input variables are: operational voltage, cell power output, composition of the biomass gas reforming, thermodynamic efficiency, electrochemical efficiency, practical efficiency, the First and Second law efficiencies for the whole system. The chemical compositions, molar flows and temperatures are presented to each point of the system as well as the exergetic efficiency. For a molar water/carbon ratio of 2, the thermodynamic simulation of the biomass gas reforming indicates the maximum hydrogen production at a temperature of 1070 K, which can vary as a function of the biomass gas composition. The comparison with the efficiency of simple gas turbine cycle and regenerative gas turbine cycle shows the superiority of SOFC for the considered electrical power range.
Keywords: Fuel Cell; Hydrogen; Biomass Gas; Simulation.
INTRODUCTION
The demonstration of fuel cell power generation is occurring worldwide. In the short term, for some specific applications these systems can become competitive, such as distributed generation and backup systems. The quality of the energy produced and the security of supply are attractive parameters of fuel cell systems. In the same way, such systems are also a promising alternative where local resources are
available or where the substitution of subsidized fuels is possible, as in several isolated Brazilian areas.
However, the use of fuel cells relies on hydrogen availability. This feedstock can be competitively produced through reforming of fuels, such as natural gas, ethanol, and syngas from biomass gasification. These last two fuels are promising hydrogen sources in Brazil due to the country’s high potential for biomass production.
The overall efficiency of hydrogen production is a function of the partial efficiencies associated with each process stage. The international experience demonstrates that there are fuel cell systems with higher overall efficiencies than conventional power plants, even in those cases in which reforming-based hydrogen is used, which reduces the fuel cell performance compared to using purified hydrogen. The attainment of higher overall efficiencies in such systems is an important step towards the commercial application of this technology.
This paper presents a methodology to simulate the thermodynamics of fuel cell systems. The first and second simulation steps comprise, respectively, the steam reforming of gasification-derived biomass gas and the power generation. The fuel cell considered here was the SOFC (solid oxide fuel cell) at the operating temperature of 1173 K.
Description of the Fuel Cell System
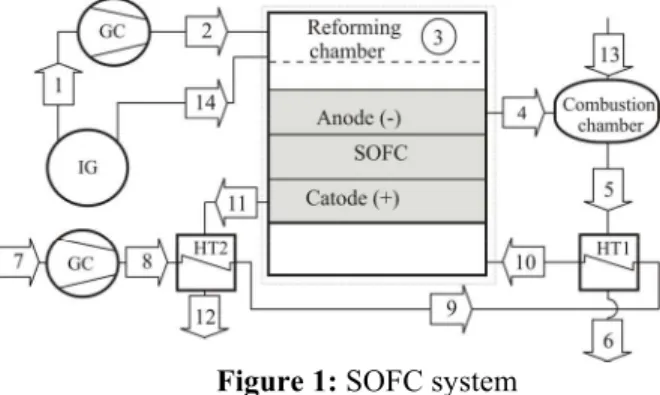
Figure 1 shows the SOFC system. The gas temperature at point 1 is 1173 K and the gas was formed in a steam gasification reactor (fluidized bed) with indirect heating (IG). The point 14 shows the steam flow needed for the reforming process. Actually the gas leaves the gasifier at high temperature and in wet phase, but in this paper the dry gas and steam flow were considered separately.
Figure 1: SOFC system
The biomass gas (point 1) passes through the compressor (GC) and enters into the internal reforming reactor; then the reformed syngas (point 3) is directed to the electrochemical reaction at the SOFC. The anode exhaust gas (point 4) is used at the
combustion chamber and the combustion gas (point 5) heats the air flow (point 9 – point 10) through a heat exchanger (HT1). The cathode exhaust gas is used to pre-heat the air (point 8) through a heat exchanger (HT2). The flow 13 is the air supply for combustion.
THEORETICAL ANALYSIS OF FUEL CELLS SYSTEMS
Thermodynamics of the Fuel Cell
The fuel cell is an electrochemical device that converts the Gibbs’ free energy of a fuel directly into electricity. According to Kordesch and Simader (1996), the thermodynamics of the fuel cell is represented by the equations below. Global reaction of hydrogen with oxygen from air:
1
2(g) 2 2(g) 2 (l)
H + O →H O (1)
In usual reactors the chemical reactions undergo irreversible processes in which the sole work done is
the change in enthalpy ( HΔ ). It occurs by
isothermal, isobaric heat transfer with the surroundings. The change in enthalpy is expressed by the equation,
dH=dG+TdS (2)
If the reactions are irreversible, the terms dG and TdS will manifest as heat, although several electrochemical reactions may occur reversibly within a fuel cell. In this case, dG occurs as electrical work and therefore constitutes the maximum value of the term dH that can be converted into electricity, as shown by Eq.(3) as follows:
el
W dH TdS dG
δ = − = (3)
Therefore, the possible maximum electrical work is the change in the Gibbs’ free energy. Considering the reactants and the products at the standard reference state (T = 298.15 K, P = 101.3 kPa) and integrating Eq.(3), the result is Eq.(4)
0 0 el
W = ΔG (4)
in which the ratio between GΔ e HΔ is called the maximum theoretical efficiency or the thermodynamic efficiency of a fuel cell (ηth):
th G H
Δ η =
Thermodynamic Simulation of Biomass Gas Steam Reforming for a Solid Oxide Fuel Cell (SOFC) System 747
In the reaction described by Eq.(1), two electrons are transferred to a circuit external to the fuel cell. For each mol of H2 involved in the reaction, 2N
electrons are transferred, where N is the Avogadro’s number. If e is the charge of a single electron, then the charge flow will be:
2Ne=2F (6)
Hence the total charge transferred can be expressed as a function of the number of moles of H2, or2nH2F. During the operation of the fuel cell, a difference of potential E appears between its electrodes, which, multiplied by the amount of charge, results in the work of the fuel cell:
2
el H
W =2n FE (7)
Considering
2
H
2n F=C and substituting Eq.(4)
into Eq.(7), the electrical work of the fuel cell in the standard reference state is
0 0
G CE
Δ = (8)
where E in the Eq.(8) is the reversible potential or 0 the maximum operational voltage of a fuel cell under the standard reference conditions. Based on Eq.(1), it results in 1.229 V. However, the actual cell potential is lower due to irreversible losses. Multiple phenomena contribute to these irreversible losses or overpotentials, which originate primarily from three sources: activation polarization, ohmic polarization, and concentration polarization. These losses result in a cell voltage that is lower than its ideal potential. Such concepts are not discussed here.
A parameter that can be used to quantify the effects of overpotentials is the electrochemical efficiency, which is defined as the ratio between the actual operational voltage and the reversible potential,
op el elq 0 0 el
CE W
G W
η = =
Δ (9)
The electrochemical efficiency is a measure of the fuel cell quality, though not taking into consideration the lifetime, costs and other parameters. In order to compare fuel cells with different characteristics, in which the same reaction occurs, differences in the electrochemical
efficiencies are verified (Kordesch and Simader, 1996).
The practical efficiency of a fuel cell is defined as the ratio between the actual work and the enthalpy of the fuel cell or as (Matelli and Bazzo, 2005) the product of the thermodynamic and the electrochemical efficiencies,
el
prt th elq W
H
η =Δ = η η (10)
For a fuel cell system operating with hydrogen derived from the reformed producer gas from biomass gasification, the overall efficiency is associated with the total power output and the gas lower heating value (LHV). It is named the first law efficiency of the SOFC/ gasification system:
el I
GGAS GGAS W
n LHV
η = (11)
Gasification-Derived Biomass Gas Reforming
The producer gas from biomass gasification has a mole fraction of hydrogen that can be maximized by the reforming of the mole fractions of methane (CH4), hydrocarbons (CxHy), and carbon monoxide
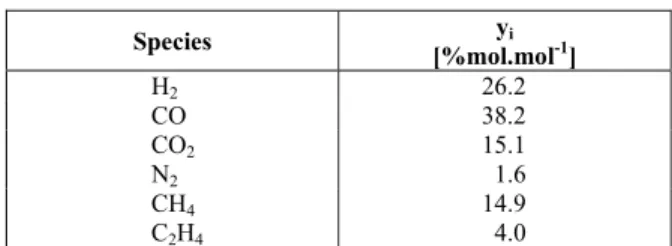
(CO). The simulation of the steam reforming considered a pressure of P = 101.3 kPa and a molar water/carbon ratio of 2. Table 1 illustrates the mole fractions of gas mixture (dry phase) produced by the indirect circulating fluidized bed (with steam) gasification processes reported by Bain (2004).
Table 1: Gasification gas composition
Species yi
[%mol.mol-1]
H2 26.2
CO 38.2
CO2 15.1
N2 1.6
CH4 14.9
C2H4 4.0
(nickel-alumina) to produce hydrogen, carbon monoxide, and a relatively small amount of carbon dioxide (Silva, 1991).
The best-known reforming methods are: steam reforming, partial oxidation, and auto-thermal reforming (Ahmed and Krumpelt, 2001). In this work, steam reforming was considered. The global reforming reaction of the gasification-derived biomass gas is described by Eq. (12)
4 2 4 2 2 2 2
CH +C H +CO H O+ → +H CO CO+ +H O (12)
For these biomass gas processing reactions, there are many possible products, it being important to estimate the composition of the syngas at the outlet of the reforming bed according to the thermodynamic conditions of the process being carried out. This estimate, considering the pre-design of the reforming and hydrogen purification systems, makes possible the assessment of the catalysts applied in prototypes (Marin Neto et al., 2004). Such assessment consists of verifying the selectivity achieved for each one of the chemical species considered and the contribution of the catalysts in shifting the chemical equilibrium towards higher hydrogen concentration in the syngas. In the case of the SOFC system simulation, the amount of hydrogen available for electricity generation can be obtained.
These complex systems, which consist of several chemical species in determined thermodynamic states, can be solved through the quantification of the chemical equilibrium (Fishtik et al., 2000). Such complex system can be described by the following equations.
T,P
dG =0 (13)
Eq.(13) represents the minimization of the Gibbs’ free energy at the equilibrium state of a system under determined temperature and pressure conditions. According to the inlet conditions of the system, the mass balance can be evaluated by Eq.(14),
N
i i,k k i 1
n b B
=
=
∑
(14)Where n denotes the number of moles of the i substance i; b is the number of atoms of the chemical element k in the substance i and B represents the total number of atoms of the chemical element k in
the system. The problem resides in solving a set of intrinsically dependent equations with the aim of achieving the minimum energy requirement for gas reforming for a given boundary condition.
The appropriate mathematical tool to solve such problem is the Lagrange multipliers. In this case, the fractions responsible for the mass balance in each of the constituent equations of the systems are multiplied by the scalars (Lagrange multipliers). Hence, Eq.(14) is re-written as:
N
k i i,k k k i 1
n b B 0
=
⎛ ⎞
λ ⎜⎜ − ⎟⎟=
⎝ ⎠
∑ ∑
(15)where λk is the Lagrange multiplier. A function F is defined in a way that:
N
k i i,k k k i 1
F G n b B
=
⎛ ⎞
= + λ ⎜⎜ − ⎟⎟
⎝ ⎠
∑ ∑
(16)It follows that:
k i,k i T,P i T,P k
F G
a 0
n n
⎛ ∂ ⎞ =⎛∂ ⎞ + λ =
⎜∂ ⎟ ⎜∂ ⎟
⎝ ⎠ ⎝ ⎠
∑
(17)where a is the activity, and the first term on the right after the equal sign of Eq.(17) is the definition of the chemical potential, μi, which can also be written by Eq.(18),
0 i i i i
0 ˆ
y P
G RT ln
P
ϕ
μ = + (18)
where ϕˆi is the fugacity coefficient of species i in
solution under ideal gas conditions; G is the molar 0i partial Gibbs energy under standard conditions. Combining Eqs. (17) and (18) yields,
0 i i
i k i,k
0 k ˆ
y P
G RT ln a 0
P
ϕ
+ +
∑
λ = (19)These equations, together with the mass balance equations, define the system of equations that describes the chemical equilibrium problem. In this work, the EES® (Engineering Equation Solver) (Klein
and Alvarado, 2003) is used for simulating the
Thermodynamic Simulation of Biomass Gas Steam Reforming for a Solid Oxide Fuel Cell (SOFC) System 749
System Performance Analysis
The methodology used for the system performance analysis was the energy and exergy balances. The power output considered in this work
was stacks of 250 kWel, where the assumed
operational voltage for each unit cell,Eop, was 0.67 V, in accordance with the literature.
Firstly, the problem consists in determining the consumption of hydrogen and biomass gas of the SOFC stack, which can undergo gas internal reforming. Secondly, this problem is combined with the chemical equilibrium solution of the biomass gas reforming described before.
Hence, the hydrogen consumption of the electrochemical reaction can be determined by rewriting Eq.(7) as,
2 el H op W n 2FE = (20) in which 2 H
n is the hydrogen molar flow rate per
unit cell. Nevertheless, not all hydrogen supplied to the cell reacts electrochemically, the fuel utilization factor being defined as the ratio between the hydrogen consumed and the hydrogen supplied to the anode, as given by Eq.(21),
2 2 H ,rct H ,spl n n
Φ = (21)
A good estimate for Φ acording Larminie and Dicks (2003) is 0.9, which was considered in this paper.
For a stack with a number N of unit cells, the hydrogen molar flow rate is given by Eq.(22),
2,stk 2,spl
H H
n =Nn (22)
The biomass gas consumption of the stack is determined considering the mole fraction of the hydrogen within the anode gas calculated from the chemical equilibrium problem of the steam reforming; thus, Eq.(23) is applied,
2,stk 2 H GGAS,stk H n n Y = (23)
Equations (24) and (25) represent the enthalpy and entropy calculations for an ideal gas mixture.
0
N T
0
i i i ip T i 1
h y h c .dT
=
⎛ ⎞
= ⎜ + ⎟
⎝ ⎠
∑
∫
(24)( )
0
N T
ip 0
i i i i
T i 1
c
s y s .dT R.ln y
T = ⎛ ⎛ ⎞ ⎞ = ⎜ + ⎜ ⎟ − ⎟ ⎝ ⎠ ⎝ ⎠
∑
∫
(25)The energy balance of the fuel cell stack is determined by Eq.(26), where part of the heat produced by the stack is used for the reforming.
aux
W is the power consumed by the air and fuel gas compressors.
ref stk stk aux out out in in
Q −Q +W −W =
∑
n h −∑
n h (26)The thermodynamic, electrochemical and practical efficiencies are calculated considering the changes of enthalpy, entropy and Gibbs’ free energy according to Eqs.(27), (28) and (29),
2 2 2 2 2 2
2 2
H O H O CO CO O O
H H CO CO
H n h n h n h
n h n h
Δ = + − −
− (27)
2 2 2 2 2 2
2 2
H O H O CO CO O O
H H CO CO
S n s n s n s
n s n s
Δ = + −
− − (28)
G H T S
Δ = Δ − Δ (29)
The mass, energy and exergy balances within the combustion chamber and heat exchangers are represented by Eqs. (30) to (32).
in out
m = m
∑ ∑
(30)out in out in
Q =
∑
n h −n h (31)(
)
( )
out out in in Q
Ex − =I n ex −n ex (32)
The definitions of specific physical and chemical exergy [8] are represented by Eqs.(33) and (34), and Eq.(35) for heat transfer.
(
)
(
)
ph 0 0 0
ex = −h h −T s−s (33)
N N
0
ch i ch,i 0 i i i 1 i 1
ex y ex RT y ln y
= =
=
∑
+∑
(34)0 Q
T
Ex Q 1
The total specific exergy is:
ch ph
ex=ex +ex (36)
The standard reference conditions (298.15 K and 101.3 kPa) in which physical and chemical exergies are defined were considered to be those proposed by Szargut et al. (1988), whose standard chemical exergies are presented in Table 2.
Table 2: Standard chemical exergy
i Species 0 ch ex
[J.mol-1]
1 H2 236,100
2 CH4 831,650
3 CO 275,100
3 C2H4 1,361,000
4 CO2 19,870
5 H2O 9,490
6 N2 720
7 O2 3,970
The exergy balance leads to the concept of rational efficiency, defined as the ratio between the total outlet exergy and the total inlet exergy, according to Eq. (37),
out
in in
Ex I
1
Ex Ex
ψ =
∑
= −∑
∑
(37)
For the combustion chamber, the rational efficiency is:
4 13
5 Q
Ex Ex
Ex Ex
+ ψ =
+
(38)
The electrical efficiency of the system is calculated by the ratio between the useful power and the chemical exergy of the biomass gas,
net el
GGAS ch,GGAS W
n ex
η = (39)
where
net el aux
W =W −W (40)
The exergetic efficiency of the system is:
net II
GGAS H2O W
Ex Ex
η =
+
(41)
RESULTS
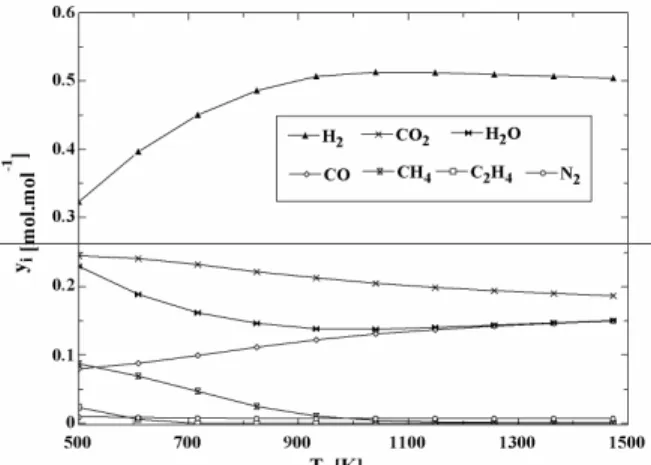
According to the methodology presented in section 3.2, in which the mass balance is weighted by the energy minimization of the system and, then, the amount of each chemical species can be quantified, the solution can be presented as a continuum according to Fig.2.
Fig. 2 shows that the maximum biomass gas conversion occurs at 1070 K, where the hydrogen production is the highest. Such maximum hydrogen molar fraction temperature is quite close to the SOFC operational temperature (1173 K), hence this type of fuel cell has a high potential to be integrated to a biomass gasification reactor. However, the great disadvantage of the biomass gas is the amount of impurities produced by the gasification process which certainly constitutes a barrier to this integration. Tar is the main contaminant, which can obstruct and deactivate the reactive surfaces of the fuel cell. The existence of a system for tar hot pre-cleaning would be ideal so that the gas high temperature could be used at least partly in the reforming process.
Tables 3 and 4 present the simulation results referred to the points of the system at Fig.1.
Thermodynamic Simulation of Biomass Gas Steam Reforming for a Solid Oxide Fuel Cell (SOFC) System 751
Table 3: Molar flows, thermodynamics properties and exergies of system points
Point n
(kmol.s-1)
M
(kg.kmol-1)
T (K)
h
(kJ.kmol-1)
s
(kJ.kmol-1.K-1)
ph ex
(kJ.kmol-1)
ch ex
(kJ.kmol-1)
1 0.0032 21.83 1173 -76,165 245.7 19,077 344,564
2 0.0032 21.83 1327 -69,016 246.3 26,052 344,564
3 0.0069 16.8 990.6 -108,741 214.9 11,661 158,985
4 0.0068 25.66 1173 -232,806 223 22,016 38,937
5 0.0085 27.31 1252 -199253 260.4 21,826 8,190
6 0.0085 27.31 440.8 -232,745 218.2 7.8 8,190
7 0.0403 28.97 298 0 165 0 1,569
8 0.0403 28.97 362 10,510 165.5 1,707 1,569
9 0.0403 28.97 700 20,663 185.2 5,975 1,569
10 0.0403 28.97 873 27,027 193.2 9,957 1,569
11 0.038 28.71 886 17,548 230.1 7,866 69
12 0.038 28.71 484.8 5,485 211.9 1,229 69
13 0.002 28.97 298 0 165 0 1,569
14 0,0024 18.02 1327 -208,465 239.3 18,245 9,490
Table 4: Mole fractions of system points
Point C H 4
y
2 4
C H
y
2
H
y
2
H O
y
2
C O
y
CO
y N 2
y
2
O
y
1 0.149 0.04 0.262 0 0.151 0.382 0.016 0
2 0.149 0.04 0.262 0 0.151 0.382 0.016 0
3 0.0068 0.0018 0.481 0.147 0.209 0.129 0.0073 0
4 0.0068 0.0018 0.0685 0.570 0.326 0.018 0.0074 0
5 0 0 0 0.522 0.283 0 0.194 0
6 0 0 0 0.522 0.283 0 0.194 0
7 0 0 0 0 0 0 0.79 0.21
8 0 0 0 0 0 0 0.79 0.21
9 0 0 0 0 0 0 0.79 0.21
10 0 0 0 0 0 0 0.79 0.21
11 0 0 0 0 0 0 0.824 0.175
12 0 0 0 0 0 0 0.824 0.175
13 0 0 0 0 0 0 0.79 0.21
14 0 0 0 1 0 0 0 0
The results of the fuel cell simulation are shown in Table 5.
Table 5: Results from SOFC simulation
T
(K) stk
W
(kW)
aux W
(kW) Δ
H (kW) ΔG
(kW)
ΔS
(kW.K-1)
t h
η
(%) e l q
η
(%)
p r t
η
(%)
I
η
(%)
I I
η
(%)
e l
η
(%)
1173 500 112 -1083 -772 -0.265 71.3 65.0 46.1 45.0 31,0 35,2
Comparing the results in Table 5 to the simulation performed by Matelli and Bazzo (2005), the inferiority of the SOFC system/ biomass gas can be observed. Those authors simulated a SOFC system/ natural gas, where the efficienciesηth, ηelq,
prt
η and ηII,were, respectively, 73.5%, 70.7%,
52.0% and 43.4%. This superiority is due to the higher potential of producing hydrogen from natural gas reforming compared to biomass gas reforming,
Table 6: Rational efficiency of SOFC system components
Component Ein
(kW)
out
E
(kW)
I (kW)
ψ (%)
SOFC 1693.5 1215.3 478.2 71.7
Combustion chamber 428.5 341,1 87.4 79.6
Heat exchanger 1 366.4 287.3 79.1 78.4
Heat exchanger 2 427.5 409.1 18.4 95.7
Depending on the gasification process and its agent (air, oxygen, steam), the biomass gas can present different compositions, which suggests different hydrogen mole fractions within the reformed gas. In Fig. 3, for instance, the reformed gas mole fractions are presented, obtained from the thermodynamic simulation of the steam reforming of the producer gas derived from the air gasification reactor (fluidized bed) with direct heating. The composition of this biomass gas according to Bain (2004) is 10%mol.mol-1H2, 12.7%mol.mol-1CO,
16.7%mol.mol-1CO2, 56.4%mol.mol-1N2, 3.7%
mol.mol-1CH4, 0.5%mol.mol-1C2H4. Such a process
produces low energy-content gases, with lower methane mole fraction and, thus, with less potential to produce hydrogen. It is also noted that the maximum hydrogen mole fraction is reached at a temperature of 900 K, different from the 1070 K presented in Fig. 2.
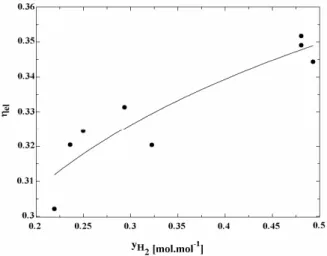
As a consequence, the efficiency of the SOFC system may vary as a function of the chemical species mole fractions present in the gas mixture. Fig. 4 illustrates the electrical efficiency variation of a SOFC system as a function of the hydrogen mole fraction of the biomass reformed gas. Those mole fractions were obtained from chemical equilibrium equations, considering different compositions of gases produced
by different biomass gasification processes.
The lowest electrical efficiency of the SOFC system (Fig. 4) corresponds to the gas produced by an air gasification reactor (fluidized bed) with direct heating and, on the other hand, the highest efficiency occurs for the gas produced by a steam gasification reactor (fluidized bed) with indirect heating. The deviation of the points from the adjusted curve is due to the efficiency dependence on the mole fractions of the other species, such as carbon monoxide.
Finally it is worth comparing the electrical efficiency of the SOFC system to conventional heat engines. According to international experience, fuel cell electrical efficiency is superior to that of heat engines, although such superiority is more significant when pure hydrogen is used. The reforming process to produce hydrogen results in irreversibilities that may decrease the advantage of fuel cells over heat engines.
Furthermore, this work compared the electrical efficiency of the SOFC system to that of gas turbines. In order to do so, gas turbine thermodynamics from Cohen et al. (1996), Kolanowski (2004), and performance information of some commercial simple and regenerative cycle units of gas turbines was needed. The origins of the gas turbine performance data are given in the references.
Figure 3: Distribution of the reforming products as a function of temperature.
Thermodynamic Simulation of Biomass Gas Steam Reforming for a Solid Oxide Fuel Cell (SOFC) System 753
Figure 5: Electrical efficiencies of the SOFC system and simple cycle gas turbines
Figure 6: Electrical efficiencies of the SOFC system and regenerative cycle gas turbines
In Fig. 5 the electrical efficiencies are presented for the SOFC system and gas turbines with electrical power output ranging from 500 kW to 30,000 kW.
The gas turbine electrical efficiencies were calculated through the ratio between the net electric power output and the chemical exergy of the biomass gas. The net electric power is obtained by deducting the power used to compress the gas, since the biomass gasification operates at atmospheric pressure.
Fig. 5 shows the SOFC electrical efficiency superiority over the whole electrical power range, although this advantage decreases as the power output rises due to the increase of the electrical efficiency of the simple cycle gas turbine. For the power output of 500 kW, the SOFC efficiency is 17% superior, but for 30,000 kW the efficiency is only 1% higher.
Fig. 6 presents the electrical efficiencies of the SOFC system and regenerative cycle gas turbines with electrical power output ranging from 30 kW (microturbines) to 4,500 kW. Although a regenerative cycle is apparently great in practice, it is only good for low compression ratio, so it is applicable in small gas turbines.
In this case, the SOFC system is still superior over all of the electrical power range. However, the SOFC system superiority is lower: 14% for 30 kW and 2% for 4,500 kW.
CONCLUSION
The thermodynamic modeling of biomass gas steam reforming (for a water / carbon mole ratio of 2) showed that the maximum hydrogen production for a pressure of 101.3 kPa depends on the biomass
gas composition. For indirect heating steam gasification, the maximum hydrogen mole fraction in reforming gas (yH2) is 0.5 mol.mol-1 at a temperature
of 1070 K, while for the direct heating air gasification the maximum yH2 is 0:25 mol.mol
-1
and occurs at 900 K. The yH2 influences the electrical
efficiency of a SOFC system; for yH2 of 0.5 mol.mol -1
the electrical efficiency is 35% while for yH2 of 0.2
mol.mol-1 the electrical efficiency is 30%. This result indicates a higher quality of the biomass gas from indirect steam gasification for application in a SOFC. In terms of the fuel quality, the integration of a SOFC with indirect steam gasification is more advantageous than its integration with direct air gasification.
The comparison of the electrical efficiency of a SOFC system with simple cycle gas turbine systems showed that the fuel cell efficiency can be significantly higher up to 5,000 kW, being approximately 10% more power-efficient. For this small-scale power, however, it is often more advantageous to make use of regenerative cycle gas turbines due to the lower compression ratio; in this case the difference in efficiency decreases to 5%, still in favor of the SOFC to a power of approximately 1,000 kW. Therefore, from the viewpoint of electrical efficiency, it is concluded that the SOFC is more interesting for distributed generation of electricity in a small scale system up to 1,000 kW.
NOMENCLATURE
a activity
b number of atoms
C Charge C
p
c specific heat J.mol-1.K-1
e elementary charge 1.6021917
x10-19 C
E equilibrium potential V
OP
E actual operational voltage V
ex specific molar exergy J.mol-1
Ex exergy transfer rate J.s-1
F Faraday’s constant
(9.64867x10⁴ C.mol-1), mathematical function
G Gibbs energy J
G Molar Gibbs energy J.mol-1
GGAS gasification gas of biomass
h specific molar enthalpy J.mol-1
H enthalpy J
I
irreversibility rate J.s-1
LHV lower heating value J.mol-1
N Avogadro’s number
(6.022169x10²³ 1.mol-1), cells number
n molar flow mol.s-1
n mole number
P pressure kPa
Q heat transfer rate J.s-1
R universal gas constant 8.314 J.
mol-1.K-1
s specific molar entropy J.mol-1.K-1
S entropy J.K-1
T absolute temperature K
W work J
W work transfer rate, power
output
J.s-1
y mole fraction mol.mol-1
Greeks
α polarization or overvoltage V
η efficiency %
λ Lagrange multiplier
μ chemical potential
ˆ
ϕ fugacity coefficient
ψ rational efficiency %
Subscripts
0 reference standard state
(101.3 kPa and 298.15 K)
ch chemical
el electrical
elq electrochemical
g gas
2
H hydrogen
i ith specie
I first law of thermodynamics
II second law of
thermodynamics
in inlet
k chemical element
l liquid
net net power
out outlet
P pressure
ph physical
prt practical
rct reacted ref reforming spl supplied stk stack
T temperature
th thermodynamic
Superscripts
0 standard reference state
(101.3 kPa and 298.15 K)
REFERENCES
Ahmed, S., Krumpelt, M., Hydrogen from hydrocarbon fuels for fuel cells, Int. J. of Hydrogen Energy, 26, 291-301 (2001).
Alstom Power, http://www.power.alstom.com/home/ equipment_systems/turbines/gas_turbines. (Consulted in September 2006).
Brooks, F. J., GE Power Systems, GE gas turbine performance characteristics. GER-3620J, p. 16 (2000).
Capstone Turbine Corporation, http://www.microturbine. com. (Consulted in September 2006).
Cohen, H., Rogers, G. F. C., Saravanamuttoo, H. I. H., Gas turbine theory, England, Pearson Education, 442 p. (1996).
Fishtik, I., Alexandre, A., Datta, R., Geana, D., A Thermodynamic Analysis of Hydrogen Production by Steam Reforming of Ethanol via Response Reactions, Int. J. Hydrogen Energy, 25: 31-45 (2000).
GE Aircraft Engines, http://www.geae.com/engines/. Hitachi Power Generation, http://www.hitachi.us/ Apps/hitachicom//PowerGeneration/GasTurbines. (Consulted in September 2006).
Thermodynamic Simulation of Biomass Gas Steam Reforming for a Solid Oxide Fuel Cell (SOFC) System 755
maintenance considerations, GER-3620, p. 52 (2003).
Kawazaki Green Gas Turbines, http://www.khi.co.jp/ gasturbine/. (Consulted in September 2006). Klein, S. A., Alvarado, F. L., Engineering Equation
Solver, Professional Version 6.883, F-Chart Software. Middleton, USA. (2003).
Kolanowski, B. F., Guide to microturbines, New York, USA, The Faimont Press, p. 236 (2004). Kordesch, K., Simader, G., Fuel cells and their
applications, 1st ed., VCH Verlagsgesellschaft mbh, weinheim, Federal Republic of Germany, pp. 23-26, 47 (1996).
Larminie, J., Dicks, A. Fuel Cell Systems Explained, John Wiley Sons (2003).
Marin Neto, A. J., Lopes, D. G., Camargo, J. C., Silva, E. P., Neves, Jr. N. P., Hydrogen Production by allothermal Reforming of Ethanol for Fuel Cell Applications Prototype Development, In: International Conference on New and Renewable
Energy Technologies for Sustainable Development, 28, June - 01 July, Évora, Portugal (2004).
Matelli, J. A., Bazzo E., A methodology for thermodynamic simulation of high temperature, internal reforming fuel cell systems, J. of Power Sources 142, 160-168 (2005).
Pratt-Whitney Power Systems, http://www.pratt-whitney.com. (Consulted in September 2006). Silva, E. P., Introdução a Tecnologia e Economia do
Hidrogênio, Primeira ed. Editora da UNICAMP, Campinas, Brasil, pp. 30-35 (1991).
Solar Turbines, http://www.solarturbines.com. (Consulted in September 2006)
Szargut, J., Morris, D. R., Steward, F. R., Exergy analysis of thermal, chemical and metallurgical processes, Hemisphere, New York, pp. 297-309 (1988).