Mateus HabermannI
Izabel MarcílioII
Marina LopesII
Rogério PradoII
Miriam SouzaII
Nelson GouveiaII
I Programa de Pós-Graduação em Ciências. Faculdade de Medicina (FM). Universidade de São Paulo (USP). São Paulo, SP, Brasil II Departamento de Medicina Preventiva.
FM-USP. São Paulo, SP, Brasil Correspondence: Mateus Habermann
Departamento de Medicina Preventiva Faculdade de Medicina – Universidade de São Paulo
Av. Dr. Arnaldo, 455, 2º andar Cerqueira César
01246-903 São Paulo, SP, Brasil E-mail: mathab@usp.br Received: 3/5/2009 Approved: 2/5/2010
Article available from: www.scielo.br/rsp
Social inequality and exposure
to magnetic fi elds in the
metropolitan region of São
Paulo, Southeastern Brazil
ABSTRACT
OBJECTIVE: To estimate the prevalence of exposure to magnetic fi elds generated by transmission lines (TL) and characterize the exposed population.
METHODS: Information about TL in the metropolitan region of São Paulo, Southeastern Brazil, was provided by the electricity companies and mapped out using geographic information system (GIS). Demographic and socioeconomic data were obtained from the 2000 Census and added to the GIS in another layer. Households and their inhabitants that were located at a distance from the TL that was suffi cient to generate a magnetic fi eld ≥ 0.3 μT (microteslas) were deemed to be exposed. The prevalence was estimated according to the area of the corridors of exposure along the TL. Two approaches were used to delimit the corridor width: one consisted of widths that were predefi ned by the TL voltage, and the other consisted of calculation of the magnetic fi eld. The socioeconomic information on the exposed and non-exposed populations were compared by applying the two-proportion test (α = 5%).
RESULTS: In the corridors with predefi ned widths, the prevalence of exposure was 2.4%, and in the calculated corridors, the prevalence was 1.4%. Both methods indicated higher prevalence of exposure among the younger population, and among individuals with lower education and income levels (p < 0.001).
CONCLUSIONS: The prevalence of exposure to magnetic fi elds generated by TL in the metropolitan region of São Paulo was lower than what has been observed in other countries. The results indicate inequality in the exposure to magnetic fi elds in this urban area, with greater risk to vulnerable populations such as children and socioeconomically less favored individuals.
DESCRIPTORS: Electromagnetic Fields, adverse effects. Environmental Exposure. Risk Factors. Socioeconomic Factors. Health Inequalities. Cross-Sectional Studies.
INTRODUCTION
Among the risks generated through technological ad-vances, electromagnetic pollution results from use of electricity and domestic electrical apparatus, such as microwave ovens, video monitors and cell phones.a
Electromagnetic fi elds vary greatly with regard to fre-quency, measured in Hertz (Hz). Electricity produces electromagnetic fi elds of extremely low frequency (between 50 and 60 Hz). The greatest concern is in relation to magnetic fi elds (measured in microteslas,
μT), which may cross through common construction materials, while electrical fi elds are attenuated by most of these materials.12
Controversy still exists with regard to the effects on health from exposure to magnetic fi elds, given that they induce weak electric currents and insuffi cient energy to directly damage the DNA and trigger the process of carcinogenesis.5,10 At the end of the 1970s, the fi rst epidemiological studies evaluating residential exposure to magnetic fi elds and the risks of leukemia, cancer and other health outcomes were published.7,10 These studies have been carried out with various designs (case-control,1,2,6,8,9 cohort13,14 and ecological15 studies) and a variety of exposure assessment methods.
One of the main problems faced in characterizing the effects of magnetic fi elds on health in epidemiological studies is the methodological diffi culty of quantifying the exposure. Many studies have estimated the exposure and its effects by means of marked-out corridors and distances from homes to the transmission line,1,2,6,8,13-15 while making the assumption that greater proximity of homes to transmission lines gives rise to greater expo-sure. The magnetic fi eld in the exposure corridors along the lines is proportional to the current. Therefore, lines of different voltages and loads should be categorized by corridors of exposure in which the width varies ac-cording to the intensity and other characteristics, such as the cable geometry, pylon height, etc.
Studies have reported corridor widths of 500 m, such that they would include exposures ≥ 0.05 μT,13,14 and between 40 m for 33 kV transmission lines and 300 m for 420 kV lines8 such that they would defi ne exposures of ≥ 0.1 μT;9 or corridors of 100 m on each side of transmission lines, for estimated exposures ≥ 0.2 μT,14 or along 110 kV and 380 kV lines.1
Several studies have presented statistically signifi cant results correlating exposure to magnetic fi elds and de-velopment of outcomes such as cancer and leukemia.2-4 Many of them use techniques involving geographic
a World Health Organization. What are electromagnetic fi elds? Geneva; 2006 [cited 2008 Jun 9]. Available from: http://www.who.int/peh-emf/ about/WhatisEMF/en/
b The EMF-SP project was coordinated by the Brazilian Association for Electromagnetic Compatibility and funded by the National Electricity Agency (Project No. 0390-041/2004), with participation by electricity transmission and distribution companies in the state of São Paulo. c Fundação Sistema Estadual de Análise de Dados. Município de São Paulo. São Paulo: 2008[cited 2008 Sep 29]. Available from: http://www. seade.sp.gov.br/produtos/msp/index.php
information systems (GIS) to mark out corridors and determine the distances of homes from transmission lines, as an assessment of exposure. The present study had the objectives of estimating the prevalence of expo-sure to magnetic fi elds generated by transmission lines and characterizing the population exposed.
METHODS
This was a cross-sectional study developed as part of the EMF-SP project EMF-SP,b which was conducted in the metropolitan region of São Paulo, Southeastern Brazil. Currently, the metropolitan region has a popula-tion of 19,697,337 inhabitants and a populapopula-tion density of approximately 2,479.6 inhabitants/km².c Data on the transmission lines that cross this area were furnished by the electricity companies that participated in the project, and the lines were mapped using MapInfo GIS software (Professional version 8.5; MapInfo Corpora-tion, New York, NY, USA).
The IBGE base map of census tracts for the municipali-ties of the metropolitan region of São Paulo, which con-tains information relating to household, population, age and socioeconomic characteristics and the schooling and income levels of heads of households, was added to the GIS in another layer, along with the information on the transmission lines and exposure corridors.
To evaluate exposure, households (and their inhabitants) that were within the limits of a corridor along a trans-mission line with an estimated magnetic fi eld ≥ 0.3 μT were defi ned as exposed. The width of these exposure corridors was determined based on two methods:
Corridors of predefi ned width for each transmission line, based on epidemiological studies that used similar methods for evaluating exposure.8,9 The width of the corridors along the transmission lines varied according to the voltage (88 kV line, 60 m; 138 kV line, 100 m; 230 kV line, 150 m; 345 kV line, 200 m; and ≥ 440 kV line, 250 m), in order to correspond to a magnetic fi eld ≥ 0.3 μT. If there were several transmission lines within the same area served, the width of the corridor was based on the line with the highest voltage.
width of these corridors varied according to the inten-sity of the magnetic fi eld and the characteristics of the respective transmission lines, with widths between 20 m and 200 m along each line.
The cutoff point of 0.3 μT to characterize exposure was adopted based on the meta-analysis of Greenland et al.3 In this, from the results of 12 epidemiological studies, the odds ratio for childhood leukemia and exposure
≥ 0.3 μT was estimated to be 1.7 (95% CI: 1.2; 2.3), compared with exposure ≤ 0.1 μT (reference group).
In both methods, the GIS software summed the popula-tion and household values of the census tracts within the areas of interest, in the case of tracts completely within the corridors. In addition, through proportional sums, the software estimated values relating to census tracts that were partially contained within each corridor. The population values were proportionally corrected for the year 2008 through information obtained from the website of the SEADE Foundation.c
For the socioeconomic analysis, indicators for the head of household that would represent the extremes of schooling levels (up to fi ve years of schooling and
≥ 13 years of schooling) and income levels (up to two minimum monthly salaries and ≥ 20 minimum monthly salaries) were used. These would show greater or lesser socioeconomic vulnerability. The proportions of these income and schooling categories between exposed
and non-exposed individuals were compared using a proportions test (α = 5%).
RESULTS
The metropolitan region of São Paulo is crossed by a network of 2,571 km of aerial transmission lines (Fig-ure 1), among which 88 kV lines are the most frequent type (879.2 km; 34.2% of the total), followed by 345 kV lines (26.1%) (Table 1).
The corridors of predefi ned width wholly or partially included 2,568 census tracts with a total of 474,011
Table 1. Length of electricity transmission lines. Metropolitan Region of São Paulo, Southeastern Brazil, 2008.
Voltage (kV) Length (km) %
88 879.2 34.2
138 264.2 10.3
230 162.9 6.3
345 671.8 26.1
440 267.2 10.4
≥ 500 325.7 12.7
Total 2,571 100.0
Source: Bandeirante, CPFL, CTEEP, AES Eletropaulo, Elektro and Furnas
Atlantic Ocean
7 0 7 14 km
Legend
LT EEletropaulo lines CTEEP lines Furnas lines Bandeirante lines Elektro lines
Municipality of São Paulo Metropolitan region Other municipalities
inhabitants. The prevalence of exposure in these cor-ridors was 2.4%. The calculated corcor-ridors included 2,316 census tracts with a total of 269,924 inhabitants and a prevalence of exposure of 1.4%.
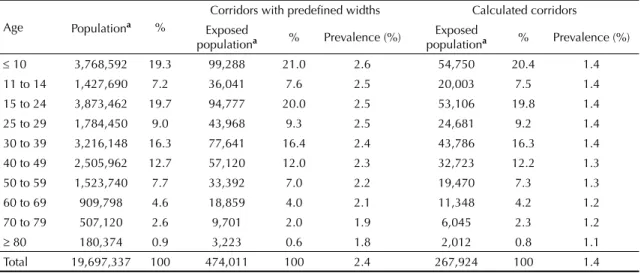
As shown by Table 2, around half of the individuals within the corridors, using both methods, were under 24 years of age. On the other hand, the proportion of elderly individuals (≥ 70 years) living in the areas of the corridors was lower than the proportions of other age groups.
The prevalence gradually diminished towards older age groups, with lower values found from the age of 40 years onwards. The group ≥ 80 years of age presented the lowest prevalence of exposure.
The prevalence of exposure was highest in the group of heads of households with the lowest schooling levels, and the prevalence was lower in the groups with higher schooling levels (Figure 2).
The analysis on income levels among the heads of households showed results that resembled those re-lating to schooling levels and followed the trend of increasing prevalence in groups with lower income. Households whose heads had the lowest incomes were predominantly in corridors close to transmission lines. This prevalence was highest among groups of heads of households without any income or with not more than three minimum monthly salaries. On the other hand, the lowest prevalences were among households whose heads had incomes greater than ten minimum monthly salaries (Figure 3).
By comparing income and schooling levels together between the exposed and unexposed populations, it was observed that among the exposed individuals, there was
a greater proportion of heads of households with not more than fi ve years of schooling and monthly income of not more than two minimum salaries. On the other hand, among the individuals who were not exposed, the proportion of heads of households with 13 years of schooling or over and monthly income greater than or equal to 20 minimum salaries was greater. All these differences between exposed and unexposed individu-als were statistically signifi cant in relation to corridors delimited using both methods (p < 0.001).
DISCUSSION
The prevalence of exposure to magnetic fi elds gener-ated by transmission lines ranged from 1.4% to 2.4%, depending on the method used to defi ne the exposure
Table 2. Distribution of the population living in the metropolitan region of São Paulo according to corridors of exposure to magnetic fi elds generated by transmission lines. Metropolitan Region of São Paulo, Southeastern Brazil, 2008.
Age Populationa %
Corridors with predefi ned widths Calculated corridors
Exposed
populationa % Prevalence (%)
Exposed
populationa % Prevalence (%)
≤ 10 3,768,592 19.3 99,288 21.0 2.6 54,750 20.4 1.4
11 to 14 1,427,690 7.2 36,041 7.6 2.5 20,003 7.5 1.4
15 to 24 3,873,462 19.7 94,777 20.0 2.5 53,106 19.8 1.4
25 to 29 1,784,450 9.0 43,968 9.3 2.5 24,681 9.2 1.4
30 to 39 3,216,148 16.3 77,641 16.4 2.4 43,786 16.3 1.4
40 to 49 2,505,962 12.7 57,120 12.0 2.3 32,723 12.2 1.3
50 to 59 1,523,740 7.7 33,392 7.0 2.2 19,470 7.3 1.3
60 to 69 909,798 4.6 18,859 4.0 2.1 11,348 4.2 1.2
70 to 79 507,120 2.6 9,701 2.0 1.9 6,045 2.3 1.2
≥ 80 180,374 0.9 3,223 0.6 1.8 2,012 0.8 1.1
Total 19,697,337 100 474,011 100 2.4 267,924 100 1.4
a Results corrected for the year 2008
Figure 2. Percentage of heads of households living in exposure corridors, according to schooling level. Metropolitan Region of São Paulo, Southeastern Brazil, 2008.
1.5% 3.1%
2.8%
2.2%
2.0%
1.6% 1.5%
1.4% 1.2%
1.0%
0.0% 0.5% 1.0% 1.5% 2.0% 2.5% 3.0% 3.5%
No schooling
1 to 5 6 to 9 10 to 12 ≥13
Corridor with preestablished width
corridors. The highest prevalence rates occurred among the child and adolescent populations (up to 18 years of age), and the lowest prevalence was among the elderly population over the age of 70 years.
There was greater exposure among populations living in situations of socioeconomic vulnerability, given that there was greater prevalence among populations with lower schooling and income levels. However, the cross-sectional design of the present study only indicates these inequalities: it does not allow the mechanisms to be defi ned.
Comparison between the results from the present study and the results in the literature, regarding the preva-lence of exposure to magnetic fi elds shown by the two methods for delimiting corridors, showed that that the prevalence values from the present study were lower than those found in other countries. However, the other studies used corridors of widths that differed from those in the present study, thereby impairing comparisons.
To evaluate occurrences of breast cancer, Kliukiene et al8 estimated corridors of widths ranging from 40 m for 33 kV transmission lines to 300 m for 420 kV lines, such that the corridors included exposures ≥ 0.05 μT. They found that the prevalence of exposure was 5% among women in Norway. The corridors in the study by Olsen et al9 also varied according to the transmission line voltage, such that they defi ned exposures ≥ 0.1 μT, in order to investigate childhood cancer.
Baumgardt-Elms et al1 used corridors of 100 m in width along 110 kV and 380 kV lines in Hamburg, Germany, to evaluate the risk of testicular cancer. The exposure prevalence found was 6.9% among the cases and 5.8% among the controls (OR = 1.3; 95% CI: 0.56; 2.8).1
In a study on childhood cancer in Finland, Verkasalo et al13 used corridors of 500 m along transmission lines, making the assumption that within this width
there would already be a magnetic fi eld ≥ 0.01 μT. In another study to evaluate depression,14 using a similar method, a statistically signifi cant risk for the outcome of exposure was found.
Draper et al2, in the United Kingdom, used distances
≤ 600 m from 275 and 400 kV transmission lines to evaluate exposure and found a statistically signifi cant association, such that there was greater risk of child-hood leukemia and exposure prevalence of 4% among children ≤ 14 years.
As an aid in evaluating residential exposure in Japan, Kabuto et al6 used the distances of homes from trans-mission lines of 22 to 500 kV, such that people living not more than 99 m from a line were considered to be exposed, while ≥ 100 m was taken to be the reference group. At distances of up to 50 m, the results were statistically signifi cant, with an increased risk of acute lymphoblastic leukemia among children.
It is possible that the lower prevalence of exposure found in our study may have been due to the fact that many transmission lines in São Paulo go through regions with lower densities of homes: areas with other uses such as industrial zones, commercial zones, rural areas, forested areas (Serra da Cantareira, for example) or riverbanks (such as along the Pinheiros and Tietê rivers).
The low prevalence values may have two interpreta-tions. On the one hand, this may be a positive factor, given that these fi elds have harmful effects on health. On the other hand, the higher prevalence among child and adolescent populations may have the consequence of development of leukemia and cancer, caused by this exposure.2-4,6 Furthermore, as a negative result, the greater prevalence among the population of lower schooling and income levels shows that magnetic fi elds are yet another burden on populations in situations of greater socioeconomic vulnerability.
Figure 3. Percentage of heads of households living in the exposure corridors, according to monthly income. Metropolitan region of São Paulo, Southeastern Brazil, 2008.
2.6% 2.6% 2.6%
2.4%
2.1%
1.8%
1.3%
1.5% 1.6%
1.4% 1.4%
1.3%
1.0%
0.8%
0.0% 0.5% 1.0% 1.5% 2.0% 2.5% 3.0%
No income < 2 minimum monthly salaries (mms)
2 to 3 3 to 5 5 to 10 10 to 20 > 20
Corridor with
Regarding the low prevalence compared with the results from other studies, the real exposure may have been underestimated through using corridor widths based on the mean load carried by the transmission lines, given that the load and magnetic fi eld of the transmission lines vary during the day, according to the demand for
electric power from the population.
In conclusion, the prevalence of exposure estimated from the present study may contribute towards the discussion on this important environmental exposure in the metropolitan region of São Paulo.
1. Baumgardt-Elms C. Residential exposure to overhead high-voltage lines and the risk of testicular cancer: results of a population-based case–control study in
Hamburg (Germany). Int Arch Occup Environ Health.
2005;78(1):20-6. DOI:10.1007/s00420-004-0550-1
2. Draper G, Vincent T, Kroll ME, Swanson J. Childhood cancer in relation to distance from high voltage power lines in England and Wales: a case-control study.
Brit Med J. 2005; 330(7503):1290-95. DOI:10.1136/ bmj.330.7503.1290
3. Greenland S, Sheppard AR, Kaune WT, Poole C, Kelsh MA. A pooled analysis of magnetic fi elds,
wire codes, and childhood leukemia. Epidemiology.
2000;11(6):624-34. DOI:10.1097/00001648-200011000-00003
4. Harvey DA. Justiça Social e a cidade. São Paulo: Hucitec; 1980.
5. International Commission on Non-Ionizing Radiation Protection (ICNIRP). Review of the Epidemiologic
Literature on EMF and Health. Environ Health Persp.
2001;109 (Supl 6):911-33.
6. Kabuto M, Nitta H, Yamamoto S, Yamaguchi N, Akiba S, Honda Y, et al. Childhood leukemia and magnetic fi elds in Japan: A case-control study of childhood leukemia and residential power-frequency magnetic fi elds in Japan. Int J Cancer. 2006;119(3):643–50. DOI:10.1002/ijc.21374
7. Kheifets LI, Greenberg RS, Neutra RR, Hester GL, Poole CL, Rall DP, Lundell G. Electric and Magnetic
Fields and Cancer: Case Study. Am J Epidemiol.
2001;154(Supl 12):50-8.
8. Kliukiene J, Tynes J, Andersen A. Residential and Occupational Exposures to 50-Hz Magnetic Fields and Breast Cancer in Women: A Population-based Study.
Am J Epidemiol. 2004;159(9):852-61. DOI:10.1093/ aje/kwh116
9. Olsen JH, Nielsen A, Schulgen G. Residence near high voltage facilities and risk of cancer in children.
BMJ. 1993; 307(6909):891-95. DOI:10.1136/
bmj.307.6909.891
10. Poole C, Ozonoff D. Magnetic fi elds and childhood cancers. IEEE Eng Med Biol. 1996;15(4):41-9. DOI:10.1109/51.511981
11. Smith K. Environmental hazards: assessing risk and reducing disaster. London: Routledge; 1992.
12. Marcilio I, Habermann M, Gouveia N. Campos magnéticos de frequência extremamente baixa e efeitos na saúde: revisão da literatura. Rev Bras Epidemiol. 2009;12(2):105-23. DOI:10.1590/S1415-790X2009000200002
13. Verkasalo PK, Pukkala E, Hongisto MY, Valjus JE, Järvinen PJ, Heikkilä KV, et al. Risk of cancer in Finnish children living close to power lines. Brit Med J. 1993; 307(6909):895-99. DOI:10.1136/bmj.307.6909.895
14. Verkasalo PK, Kaprio J, Varjonen J, Romanov K, Heikkilä K, Koskenvuo M. Magnetic Fields of
Transmission Lines and Depression. Am J Epidemiol.
1997;146(12):1037-35.
15. Wartenberg D, Greenberg M, Lathrop R. Identifi cation and characterization of population living near high-voltage transmission lines: a piloty study.
Environ Health Persp. 1993; 101(7):626-32. DOI:10.2307/3431648
REFERENCES
Article based on the master’s dissertation by Habermann M, presented to Faculdade de Medicina da Universidade de São Paulo, in 2008.