Industrial Robot: An International Journal
Robust mobile robot localizat ion based on a securit y laser: an indust ry case st udy Heber Sobreira A. Paulo Moreira Paulo Costa José Lima
Article information:
To cite this document:Heber Sobreira A. Paulo Moreira Paulo Costa José Lima , (2016),"Robust mobile robot localization based on a security laser: an industry case study", Industrial Robot: An International Journal, Vol. 43 Iss 6 pp.
-Permanent link t o t his document :
http://dx.doi.org/10.1108/IR-01-2016-0026
Downloaded on: 09 Sept ember 2016, At : 21: 17 (PT)
Ref erences: t his document cont ains ref erences t o 0 ot her document s. To copy t his document : permissions@emeraldinsight . com
The f ullt ext of t his document has been downloaded 4 t imes since 2016*
Access t o t his document was grant ed t hrough an Emerald subscript ion provided by emerald-srm: 184293 [ ]
For Authors
If you would like t o writ e f or t his, or any ot her Emerald publicat ion, t hen please use our Emerald f or Aut hors service inf ormat ion about how t o choose which publicat ion t o writ e f or and submission guidelines are available f or all. Please visit www. emeraldinsight . com/ aut hors f or more inf ormat ion.
About Emerald www.emeraldinsight.com
Emerald is a global publisher linking research and pract ice t o t he benef it of societ y. The company manages a port f olio of more t han 290 j ournals and over 2, 350 books and book series volumes, as well as providing an ext ensive range of online product s and addit ional cust omer resources and services.
Emerald is both COUNTER 4 and TRANSFER compliant. The organization is a partner of the Committee on Publication Ethics (COPE) and also works with Portico and the LOCKSS initiative for digital archive preservation.
*Relat ed cont ent and download inf ormat ion correct at t ime of download.
Robust Mobile Robot Localization based on a
Security Laser: An Industry Case Study
NameA1
, NameB1
, NameC1
, and NameD2
1 Institute 1
street x
email@email.email, email@email.email, email@email.email
2 Institute 2,
street y Institute 3 street z
email@email.email
Abstract.
PurposeThis paper addresses a mobile robot localization system that avoids using a dedicated laser scanner, making it possible to reduce im-plementation costs and the robot’s size. The system has enough precision and robustness to meet the requirements of industrial environments.
Design/methodology/approachUsing an algorithm for artificial bea-con detection combined with a Kalman Filter and an outlier rejection method, it was possible to enhance the precision and robustness of the overall localization system.
FindingsUsually, Industrial Automatic Guide Vehicles (AGVs) feature two kind of lasers: one for navigation placed on top of the robot, and another for obstacle detection (security lasers). Recently, security lasers extended their output data with obstacle distance (contours) and reflec-tivity. These new features made it possible to develop a novel localization system based on a security laser.
Research/limitations/implicationsOnce the proposed methodology is completely validated, in the future, a scheme for global localization and failure detection should be addressed.
Practical implicationsThis paper presents a comparison between the presented approach and a commercial localization system for industry. The proposed algorithms were tested in an industrial application under realistic working conditions.
Social implicationThe presented methodology represents a gain in the effective cost of the mobile robot platform, since it discards the need for a dedicated laser for localization purposes.
What is original/value of paper This paper presents a novel ap-proach that benefits from the presence of a security laser on mobile robots
(mandatory sensor when considering industrial applications), using it si-multaneously with other sensors, not only to guarantee safety conditions during operation, but also to locate the robot in the environment. This paper is also valuable due to the comparison made with a commercialized system, as well as the tests conducted in real industrial environments, which prove that the approach presented is suitable for working in these demanding conditions.
Keywords: Automated Guided Vehicle, AGV, mobile robotic, localiza-tion, artificial beacons, Kalman filter, sensor fusion, outliers rejeclocaliza-tion, security laser
1
Introduction
One of the most important requirements of an industrial mobile robot is the abil-ity to robustly self-localize in the environment. In other words, it can be defined as the task of estimating the pose of the robot in a map of the environment. This task has been capturing the attention of researchers, developers and technology transfer processes of mobile robots over the last years.
Usually, Automated Guided Vehicles (AGVs) in industry feature two kinds of lasers: one for navigation placed on top of the robot, and another for obsta-cle detection (security lasers). Recently, security lasers extended their output data with obstacle distance (contours) and reflectivity. The aim of this work is to develop a localization system based on reflector detection, using just a security laser. This system must have enough precision and robustness to inte-grate an AGV operating in industrial environments. With this, the goal is to add value and innovation to existing solutions (economically and also regarding algorithms), resulting in greater flexibility, robustness, and precision.
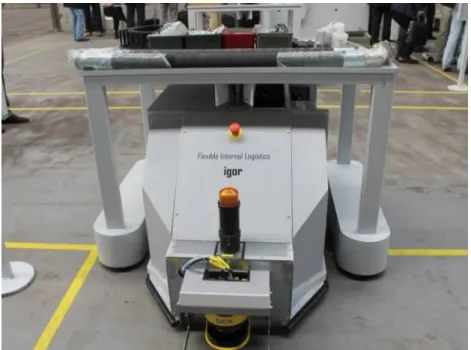
The motivation for this approach comes from the fact that security lasers are a mandatory equipment in most applications using AGVs. Therefore, reusing this equipment for localization purposes means that it is not necessary to use a second navigation laser on top of the robot, which leads to lower equipment costs. Furthermore, in some applications, using use a navigation laser is not possible due to maximum height limitations of AGVs, as can be seen in the particular case represented in Figure 1. Here, the AGV is carrying tables above it and does not allow the use of a top navigation laser, since it is just short enough to pass under the table.
The goal with this approach is to develop smaller AGVs, instead of the AGVs that use a navigation laser (reflectors triangulation), with more flexibility than the traditional small industrial AGVs whose navigation is based on the tracking of magnetic bands.
A possible indicator of the market value for such a solution is that some manufacturers are already providing security laser models capable of detecting reflectors.
However, there are many problems associated with this type of solution. One is related to the angular opening of the security laser, which is smaller than
Fig. 1: Robot developed as part of this work. Its purpose is to transport tables on the shop floor of an industrial environment. The yellow laser scanner, used simultaneously by the security and localization systems, is in front of the robot.
the navigation laser. Typically, a navigation laser has 360◦, while a safety laser has 190◦ or 270◦, depending on where it is installed on the AGV. Moreover, the security laser must be installed in a lower position, and consequently the possibilities of beacon occlusion and false positive detection are higher, due to the greater quantity / variety of objects at a short distance from the floor.
It is clear that in this case the same algorithms used in a navigation laser can-not be used. The facts mentioned above emphasize the need for new algorithms which are much more robust, efficient and reliable, supporting more outliers and a smaller amount of information, without significantly degrading the accuracy of the location system. The methodology proposed in this paper is developed in ROS (Robot Operating System) (Quigley et al. 2009), which provides libraries and tools to help software developers create robot applications.
This paper is organized as follows: after the Introduction, Section 2 addresses the state of the art, where related work is described. Sections 3 and 4 respectively outline the existing problem and the corresponding solution provided. In the latter, the algorithms and filters used are detailed, namely the Extended Kalman Filter, the detection of the reflectors, the Outliers Filter and the Uncertainty Supervisor. Section 5 presents the practical results. Here, an analysis of the precision and robustness of the system is performed. Finally, Section 6 provides the Conclusions and topics for future research.
2
Related work
For more than twenty years, a wide scientific community has been dedicated to the localization problem of mobile robots. The extensive state of the art in this area features different solutions proposed based on different algorithms and different types of sensors (Borenstain et al. 1997; Lee et al. 2008). A large variety of solutions exist based on several approaches applied to service or industrial mobile robots (Serrano et al. 2008). However, few solutions are commercialized and are mostly implementable in very controlled environments.
Many solutions exploit natural features (such as corners, walls and geometric shapes) for determining the pose of a robot (Nunez et al. 2007; Bailey et al. 2000). Sabattini et al. (2013) lists some weaknesses of existing logistics systems using AGVs and proposes several improvements. One of these improvements is the use of natural features to locate the robot. C. Reinke and P. Beinschob (2013) and Patric Beinschob and Christoph Reinke (2013) discuss the application of these features in localization, using two and three dimensional information extracted in industrial environments using laser scanners. Map matching algorithms are an important class of solutions based on the natural features of the environment. Here, robot localization is based on the matching of information from the laser scanner and a given map (e.g. occupancy grid). One example of these algorithms is the Iterative Closest Point (ICP) (Besl and McKay 1992). This method iter-atively searches for the rigid transformation that best aligns two sets of points. Lu and Milios (1997) present an application of ICP with the data obtained from a laser range finder. Following the same line of thought, the Iterative Closest
Line (ICL) algorithm (Censi 2008) matches a set of points and a set of lines. The major disadvantage of these algorithms is the high computational effort for computing the correspondence search between the sets of points. Some studies present a matching algorithm from a set of points and an occupancy grid (Lauer et al. 2006). This has been adopted by many of the teams participating in the robot soccer leagues, mainly because the algorithm is computationally light. It makes possible the use of a high frequency control loop in the robots. Using the same algorithm and a data fusion method (Extended Kalman Filter), So-breira et al. (2015) presents a localization system for an industrial AGV that does not require artificial landmarks, such as reflectors. However, the precision and robustness of algorithms that exploit the natural features of the environ-ment depend on the presence of a set of features which do not change over time, and require the environment to be sufficiently distinguishable. The demanding accuracy and robustness requirements in industrial applications usually lead to localization solutions using artificial landmarks.
In industry, AGVs are commonly equipped with a laser scanner and the environment is populated by anonymous (i.e. indistinguishable) beacons (typi-cally reflecting surfaces, reflectors) (Schulze et al. 2008). Several approaches exist in the literature for localization based on indistinguishable beacons, where the global localization is based on the observed distance between reflectors (Ron-zoni et al. 2011). In this approach, odometry data from encoders is not used and the global pose is computed without previous information on robot localization, while taking into account false detections (outliers). Ronzoni et al. (2011) tests this approach on an industrial AGV equipped with a navigation laser scanner placed on top of the robot. However, the approach suggested here involves the use of a security laser rather than a navigation one, which leads to a decrease in the number of visible reflectors and a higher number of outliers. Therefore, using an algorithm for sensorial data fusion in this problem is indeed relevant. The work presented here is a result of adapting EKF Localization with Unknown Correspondences, presented in Borenstain et al. (1997). The author merges data from laser scanners (distances and angles measured from reflectors) and odom-etry data. In order to meet the industrial requirements described above, mech-anisms of outlier filtering, beacon detection and an estimation error supervisor were added. This work was developed in collaboration with industrial partners and the results presented here validated the approach, both in comparison with available commercialized solutions and in real industrial environments where the system was tested. The solution proved to be robust in several adverse condi-tions.
3
Problem Description
The problem of beacon based localization is defined as the estimation of the AGV’s absolute pose Xv = [xv yv θv]T in an external referentialWx Wy (fig-ure 2), where Wx Wy is the world referential and Rx Ry is the AGV relative referential.
This estimation is performed from:
– The reflectors mapMB = [MB,1... MB,numB]. It consists on a set ofnumB fixed positions where reflectors are installed. Therefore,MB,i = [xB,i yB,i] is the position of reflectoriin the external referentialWxWy. The reflectors have a cylinder form with fixed radius (Bradius) and are indistinguishable between them. The yellow circle in Figure 2 represents a reflector.
– The laser measurementsZL(k) =ZL,i(k), CL,i(k) :i∈[1numL] (numL stands for number of laser beams in one measurement). WhereZL,i(k) corresponds to relative position i (in relation to Rx Ry referential) at instant k in po-lar coordinates (rL,i distance, φL,i angle) of the detected obstacle. cL,i is a Boolean related to the reflectivity of the target (a reflector presents high reflectivity). The dashed lines in figure 2 represent the laser measurements, the orange lines have a truecL,i (high reflectivity), while the red lines have a falsecL,i (low reflectivity).
– The odometry datau(k) is provided by the robot encoders and measures the relative displacement of the AGV in theRx Ry referential.
The following assumptions were made to design the solution:
– There exists an approximate estimation of the AGV’s pose, so it is a local-ization tracking problem. In the future, We will build on top a redundant system to automatically initialize and supervise our solution.
– The reflectors have the same size and are in known positions in the space characterized byMB. The map (MB) acquisition system will be addressed in another paper.
– The laser scanner differentiates objects with high and low reflectivity. Re-flectors have high reflectivity but they are not the only objects with this characteristic. As such, the possibility of a false detection is high.
– Just a small subset of the installed reflectors will be inside the field of view (FOV) of the laser scanner.
– In spite of the lower quality sensor data provided by the security laser scan-ner, the goal is to obtain a solution with enough precision and robustness to integrate an industrial AGV.
4
The proposed solution algorithm
This section describes the solution proposed for a localization system based on reflector detection, using a security laser scanner. Firstly, an overview of the system architecture is provided, followed by a detailed presentation of each component.
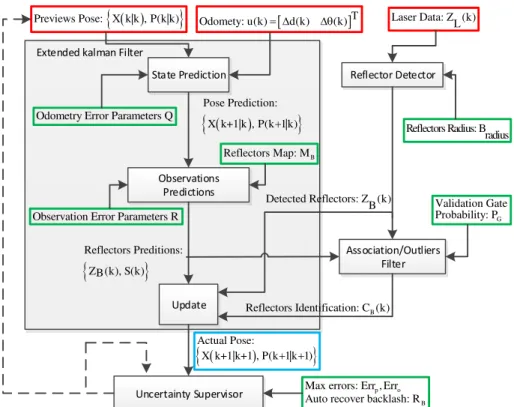
The system architecture is depicted in figure 3. The black blocks represent each component, with the corresponding inputs and outputs. The red and blue blocks represent the input and output data at each iteration of the algorithm, while green blocks indicate system parameters. The solution proposed is based on the application of a sensor data fusion algorithm, known as Extended Kalman
W
y
x
vy
vθ
vx
B,iy
B,iB
ir
L,numLφ
L,numLθ
ResB
radiusW
xFig. 2: Representation of the AGV relative referential (RxRy) at pose [xvyvθv]T in the world referential (WxWy). The yellow circle represents a reflector (element of the reflector map) at fixed position [xB,iyB,i]. The dashed lines stand for a set of laser measurements. numL is the last measurement, with polar coordinates
ZL,numL = [rL,numL φL,numL]. Objects with low reflectivity (red lines) and high reflectivity (orange lines) are differentiated in the image.
Filter (EKF), delineated in the gray area of 3. This method is used to merge the pre-processed data from the scanner laser (distance and angle (ZB) of de-tected reflectors) and odometry. The application of the EKF is combined with two other components: the ”Reflector Detector” and the ”Association/Outlier Filter”. These components pre-process the data used by the EKF and detect outliers from sensor data. This leads to a rejection of false reflector detections and increases the overall robustness of the system. Moreover, an ”Uncertainty Supervisor” was implemented to evaluate the estimation of the localization ac-curacy and to stop the system when the quality of the data is low and safety requirements cannot be successfully met.
T
Odomety: u(k) d(k) (k) Laser Data: Z (k)L
Pose Prediction:X k+1|k , P(k 1|k)
Actual Pose:X k+1|k+1 , P(k 1|k 1)
Reflector Detector
Previews Pose: X k|k , P(k|k)
Detected Reflectors: Z (k)B
B
Reflectors Map: M
Reflectors Preditions:Z (k), S(k)B
B
Reflectors Identification: C (k)
Extended kalman Filter
Odometry Error Parameters Q
Observation Error Parameters R G
Validation Gate Probability: P
Association/Outliers Filter State Prediction
Reflectors Radius: B radius
Observations Predictions
Update
Uncertainty Supervisor p o
B
Max errors: Err , Err Auto recover backlash: R
Fig. 3: System architecture. Each black block represents a system component, with its inputs and outputs. The red, blue and green blocks represent the local-ization system inputs, outputs and parameters, respectively. The solution pro-posed consists of applying an extended kalman filter (gray area) combined with a Reflector Detector and an Association/Outliers Filter method. Moreover, an Uncertainty Supervisor was used to evaluate the accuracy of the localization’s estimation.
4.1 Extended Kalman Filter
The EKF is a well-known algorithm applied to sensor fusion in the mobile robotics area. In that case, it computes the statistical data related to the state estimation (estimated pose and its covariance) by combining the distance and angles measured from the reflectors and odometry data. It also deals with sensor errors modulated as gaussian noise. Concerning the problems generated by the EKF linearization, in this case there is an industrial application that usually requires high precision solutions (low covariance), and so the effect of lineariza-tion error is attenuated. Besides, industrial applicalineariza-tions usually require high fre-quency rate solutions where the Kalman filter fits better than other approaches, such as particle filters (Grisetti et al. 2007).
In order to apply an EKF, it is necessary to define the models: state transition
f(.) and observationh(.).
As expressed in equation 1, f(.) models the evolution of the robot pose based on last state and odometry datau(k).Q(k) is the state noise variance and depends on the values of u(k). The odometry model was based on Eliazar and Parr (2004) where the state prediction is based on centered difference first order integration and the covariance model is proportional to the relative displacement and angle differenceu(k).
Xv(k+ 1) =
xv(k+ 1)
yv(k+ 1)
θv(k+ 1)
=f(Xv(k), u(k)) +N(0, Q(k)) (1)
Considering now equation 2,h(.) states the expected reflector relative posi-tions (ZB) accordingly to the robot’s poseXv(k). From the AGV’s absolute pose and the reflector’s absolute position (Xv(k) andMB,irespectively inWxWy ref-erential),h(.) give us the expected detection’s relative position (ZB,i in RxRy referential) of the reflectori. The observation model assumes that measurements are affected by additive Gaussian noise with zero mean and covariance R. In the presented work, R is assumed to be constant and a parameter of the system. For further details see Thrun and Burgard (2005).
ZB,i=
rB,i
φB,i
=h(MB,i, Xv(k)) +N(0, R) (2)
At this point, it is possible to describe the application of the EKF filter, which is an adaptation of ”EKF Localization with U nknown Correspondences” pre-sented in Thrun and Burgard (2005).
Algorithm 1 describes the Kalman Filter processing. The Kalman filter algo-rithm used is described in previous work Sobreira et al. (2015). As input to the al-gorithm there is: the previous pose estimation and its covariance (Xb(k|k)P(k|k)); relative positions of the detected reflectors (ZB); and odometry datau(k).ZB is result of the pre-processing of laser data (ZL) by the ”Reflector Detector” module (further presented in subsection 4.2). As output the filter presents the pose estimation with its uncertainty characterized by the co-variance matrix
P(K+ 1|K+ 1).
Next, a brief explanation of Algorithm 1 is provided, more details about the algorithm can be found in Thrun and Burgard (2005):
Line 3: Prediction of the next pose based on odometry data and through odometry model;
Line 4: Covariance calculation of the last predicted pose;
Line 7: Prediction of observations based on predicted pose and through ob-servation model;
Line 8: Covariance calculation of predicted observations;
Line 10: Reflectors identification: match/associate detected reflectors (ZB) to reflector map (MB) (further presented in subsection ”Association/outiers fil-ter”). The output CB is a vector with the same length asZB. Each element of
CB,CB,i, is the index of beacons map (MB) associated withidetection (ZB,i); Line 14: Detections identified as outliers are rejected;
Line 15: Kalman gain calculation;
Line 16: New pose estimation through new observed data; Line 17: New covariance of pose estimation.
Input :Xb(k|k), P(k|k), u(k), ZB(k) Output:Xb(k+ 1|k+ 1), P(k+ 1|k+ 1)
1 begin
2 Pose Prediction:
3 X (k + 1b |k) =f
b
X (k|k), u(k)
4 P(k + 1|k) =∇fX
b
X (k|k), u(k)P(k|k)∇fXT
b
X (k|k), u(k)+Q(k)
5 Observation Prediction: 6 forall beaconsMB,i do
7 ZbB,i(k) =h MB,i,X (k + 1ˆ |k)
8 Si(k) =∇h MB,i,X (k + 1ˆ |k)P(k + 1|k)∗∇h MB,i,X (k + 1ˆ |k)T+R 9 end
10 CB(k) =Association Outliers F ilter
ZB(k),ZbB(k), S(k)
11 Update:
12 Xb(k+ 1|k+ 1) =Xb(k+ 1|k) andP(k+ 1|k+ 1) =P(k+ 1|k) 13 forall detected beaconsZb,i do
14 if CB,i != INVALID BEACON ID then
15 Ki(k) =P(k + 1|k)∇h MB,j=C
B,i,X (k + 1ˆ |k)
T
Sj=CB,i(k)(k)
−1
16 Xb(k+ 1|k+ 1) =Xb(k+ 1|k+ 1) +Ki(k) h
ZB,i−ZbB,j=CB,i(k)
i
17 P(k+ 1|k+ 1) = h
I−Ki(k)∇h
MB,j=CB,i,Xb(k + 1|k)
i
P(k+ 1|k+ 1)
18 end
19 end 20 end
Algorithm 1: Extended Kalman Filter.
4.2 Reflector Detector
Z
LC,1
Z
LC,3
Z
LC,2
Z
LC,4
Z
LC,5
R
x
R
y
Z
B,3
Z
B,1
Z
B,2
Fig. 4: Example of laser acquisition sample (ZL). The black and red points are positions (in relation to referentialRxRy) of the measurements of the laser scan-ner, the red being the points with higher reflectivity. The blue and green colors represent data regarding the reflector detector module. This example features five clusters indicated by theZLC,1toZLC,5. A cluster is a sequence of relative
positions with high reflectivity. In these clusters only three correspond to a re-flector; the figure shows the relative position of the detected reflectors (ZB,1 to
ZB,3), and the clusters ZLC,2 andZLC,3 are outliers, and therefore ignored by
the system.
The reflector detector module processes the data acquired using laserZL in order to detect reflectors, and computes the positions relatively to the robot ref-erential (ZBin relation to referentialRxRy, figure 4). The detection of reflectors is based on the reflectivity of laser measurements (CL,i), but reflectors are not the only detected objects with high reflectivity. Figure 4 contains an example of laser scanner measurements, where five clusters of red points are present. These clusters correspond to detections with high reflectivity, but only three are
surements from the reflectors. In order to make the detection more reliable, a ”Detector Filter” was developed that takes into account the size of the installed reflectors (Bradius).
r
i
B
i
θ
Res
B
radius
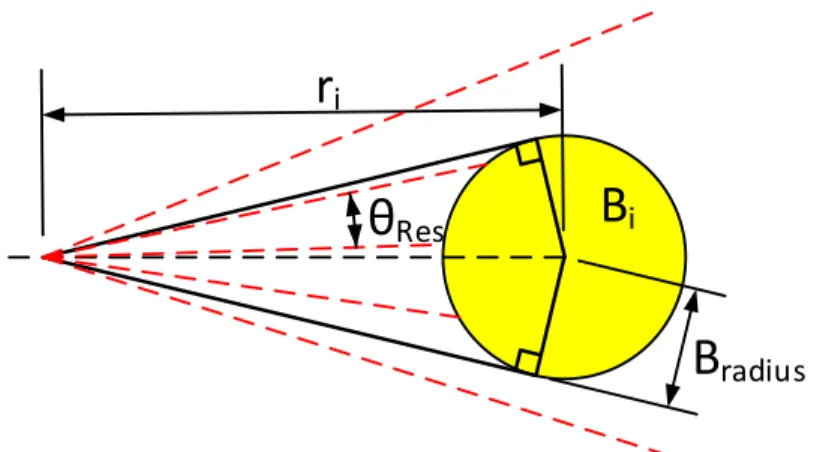
Fig. 5: Geometric relationship between distance (ri) to a reflector (Bi) and the number of laser beams intercepting it.
The ”Detector Filter” is based on the geometric relationship present in Figure 5: by knowing the distance between the reflector and the robot,ri, it is possible to compute the number of laser beams (number of elements in a cluster) that hit the reflector. With this, and knowing the radius of the installed reflectors (Bradius) and the laser resolution (θRes), the model presented in equation 3 is defined:
Mnum(r) =f loor
2 arcsin Bradius
r
θRes
!
(3)
Using this filter, it is possible to differentiate beacons from other objects, based on their dimensions. Algorithm 2 describes the module’s computations.
In algorithm 2, line 2 and line 3 divide the laser dataZLinto clusters, based on their reflectivityCL,i. One cluster,ZLC,i(k), is a sequence of relative positions with high reflectivity. In the example of Figure 4, five clusters are presented, indicated byZLC,1(k) toZLC,5(k).
In line 5, the polar coordinates are calculated for each detected cluster, re-spectively the distance (rB,new) and angle (φB,new) in relation to the robot refer-ential (RxRy). For now,ComputeReflectorCentersimply consists of considering
Input :ZL(k) Output:ZB(k)
1 begin
2 ZLC(k) ={ZLC,i(k) :i∈[1numOf Clusters]} 3 ZLC(k) =P rocessClusters(ZL)
4 forallclustersZLC,i(k)do
5
rB,new
φB,new
=ComputeRef lectorCenter(ZLC,i(k))
6 modelError=size((ZLC,i(k))−Mnum(rB,new)
7 if (modelError≤MaxModelError) and (modelError≥MinModelError) then
8 add
rB,new
φB,new
to ZB(k)
9 end
10 end 11 end
Algorithm 2: Reflector Detector.
the angle and distance (plus the reflectors’s radius) of the central measurement of the cluster. Therefore, a constantRis also considered in the equation 2. The goal is to refine this model in the future.
In line 6, the error between the number of measurements of the cluster i and the model’s response defined in equation 3 is calculated.
The ”detector filter” described above is applied from line 7 to line 9 in order to eliminate possible outliers.MaxModelError andMinModelError are the min-imum and maxmin-imum tolerance between the model proposed and the number of points observed.
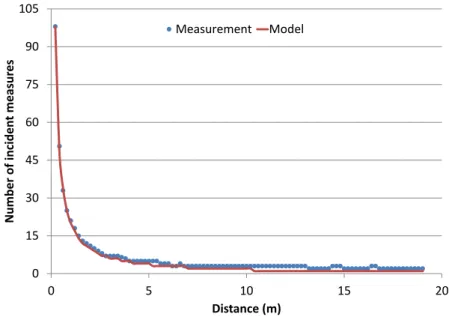
An experimental setup was implemented to validate this approach. The num-ber of incident points in a reflector was registered for different distances, and the results obtained are depicted in Figure 6. This made it possible to validate the function of the distance-number of beams (equation 3), and to choose adequate values for the acceptance tolerances of the ”detector filter”. AMaxModelError equal to two andMinModelError equal to one were used.
4.3 Association/outliers filter
This module has two functions: identifying the detected reflectors and filter outliers that the previous filter (reflector detector) could miss. This filtering considers the current estimation of the robot pose, Xb(.) and P(.), rejecting measurements in accordance with the probability of their occurrence.
This algorithm is presented in algorithm 3, where ZB are the detected re-flectors andZbBandS(.) are the predicted observations and their covariance. As a result of this algorithm, CB consists of an array (with the same size of ZB) where each elementCB,ishows the reflectors map index ofMB,i, associated with detectionZB,i.
0 15 30 45 60 75 90 105
0 5 10 15 20
Number of in
ciden
t m
ea
sur
es
Distance (m)
Measurement Model
Fig. 6: Experimental validation of the model presented in equation 3. The ex-perimental results of the number of laser beams observed at each measurement distance are presented in blue. The corresponding response of the model is pre-sented in red.
Input :ZB(k), ZbB(k), S(k) Output:CB(k)
1 begin
2 forall beaconsZB,i do 3 Association: 4 CB,i(k) =
argmax j
det (2πSj(k))e−
1
2 ZB,i(k)−ZbB,j(k)
T
[Sj(k)]−1 ZB,i(k)−ZbB,j(k)
5 Association filter:
6 if
ZB,i(k)−Zbj=CB,i(k)(k)
T
Sj=CB,i(k)(k)
−1
ZB,i(k)−Zbj=CB,i(k)(k)
>χ2df=2
then
7 CB,i = INVALID BEACON ID
8 end
9 end 10 end
Algorithm 3: Association Outliers Filter.
A brief description of Algorithm 3 is presented:
Line 4: ZB,i observation is associated with the elementMB,i, which maxi-mizes the probability of their occurrence. For each elementjof the mapMBthe value of probability distribution function of ZB,i observation occurrence (like-lihood) is computed. The observation i is associated with the elementj of the map that presents a higher value (maximum likelihood). For more details see Thrun and Burgard (2005).
Line 6: χ2
df=2 is a constant value function of PG (figure 3 Validation Gate Probability). In the observations space, a zone is defined where the probability of an observation is greater or equal toPG.χ2df=2 corresponds to the inverse of
the density function of a chi-square distribution with two degrees of freedom. In this point, the outliers’ statistical description of Thrun and Burgard (2005) is enhanced, and a filtering is suggested based only on the likelihood value of the observations.
Later, in figure 12 it is possible to see the representation of the validation area in the Cartesian space. The blue ellipses correspond to the area where, taking into account the AGVs estimated pose, the probability of detecting a reflector isPG, which in this particular case is 95%.
4.4 Uncertainty supervisor
This module is responsible for supervising the state of the localization system. This supervision is based on the amount of uncertainty estimated by the Ex-tended Kalman filter, and its goal is to detect fault conditions in the localization system, where the estimation of the AGV pose is not reliable enough to ensure a safe navigation. There are several situations that could contribute to a significant increase in the uncertainty of the robot’s pose, which can lead to a localization failure. One common situation is the detection of less than two reflectors for long periods of time. This sensory information deficit may be caused by the occlu-sion of reflectors and/or a poor distribution of reflectors in the navigation area. Another more serious situation can occur when the Kalman filter fails while tracking the pose, converging to a wrong solution. This is usually caused by gross errors in the robot’s sensors, for example, the slippage of wheels, which could lead to erroneous displacement measurements or to processing false reflec-tors which have not been filtered by the system. In addition to matters related to the AGV safety navigation, there is an extra motivation to prevent a high uncertainty. Using an Extended Kalman filter to perform pose tracking and, in general, linearized gaussian techniques, usually works better if the uncertainty is low. There are several reasons for that, for instance, a low uncertainty reduces the danger of identifying erroneous reflectors. This is important because a single false correspondence can derail the filter by inducing an entire stream of local-ization and correspondence errors. Besides, linearlocal-ization usually has low errors only in close proximity to the linearization point. Thrun Thrun and Burgard (2005) refers these issues and states ”a rule of thumb, if the standard deviation for orientation is larger than±20 degrees, linearization effects are likely to make the Extended Kalman filter algorithm fail”. When the system is in fail mode the
AVG stops. However, in a situation where the reflectors are temporarily occluded (people or other moving machinery) it is relevant that the localization system goes back to its operational status without external intervention. Therefore, even in fail mode, the system continues to process the sensor data and to verify if it reduces the localization uncertainty.
Input :Xb(k+ 1|k+ 1), P(k+ 1|k+ 1),Xb(k|k), P(k|k) Output:Xbv(k+ 1|k+ 1), Pv(k+ 1|k+ 1)
1 begin
2 P(k+ 1|k+ 1) =
" var (x
v) cov (xv, yv) cov (xv, θv) cov (xv, yv) var (yv) cov (yv, θv) cov (xv, θv) cov (yv, θv) var (θv)
#
3 F aultConditionState:SF ault 4 if SF ault=f alsethen
5 if
2pvar (xv)> Errp
or
2pvar (yv)> Errp
or
2pvar (θv)> Erro
then
6 SF ault=true
7 end
8 else
9 if
2pvar (xv)<ErrR p B
and2pvar (yv)<ErrR p B
and2pvar (θv)< ErrR o B
then
10 SF ault:=f alse
11 end
12 if SF ault=f alsethen
13 Xbv(k+ 1|k+ 1)=Xb(k+ 1|k+ 1) 14 Pv(k+ 1|k+ 1)=P(k+ 1|k+ 1)
15 else
16 Xbv(k+ 1|k+ 1)=Xb(k|k) 17 Pv(k+ 1|k+ 1)=P(k|k)
18 end
19 end 20 end
Algorithm 4:Uncertainty supervisor.
Algorithm 4 describes the Uncertainty supervisor module. Its input is the previous state of EKF (Xb(k|k), P(k|k)) and the new result after processing the new sensory information (Xb(k+ 1|k+ 1), P(k+ 1|k+ 1)). One of these inputs will be the output of this module (Xbv(k+ 1|k+ 1), Pv(k+ 1|k+ 1)). The standard deviation of each estimated pose components (xv,yv andθv) is compared with the parameters of maximum position error Errp and maximum angular error
Erro, as observed in line 5 of algorithm 4. If this condition is verified, the system goes into fail mode and the new EKF filter result (Xb(k+ 1|k+ 1), P(k+ 1|k+ 1))
is discarded. From this point, the condition in line 9 is processed. Here, the condition for the system to leave the failed state is tested, which corresponds to standard deviations below Errp
RB and Erro
RB after new sensory information is
processed. The auto recover backlash (RB) aims to avoid intermittent transitions between the state ”fail mode” and ”operational mode”.
In conclusion, a Kalman filter was used to merge information of the detected reflectors and odometry data. The robustness of this algorithm relies on the outlier filtering performed by two filters in series: detector filter and association filter. The detector filter takes into account the size of a detected reflector, while the association filter, based on the actual pose estimate of the robot, rejects unlikely reflector measurements. Because the case study is an industrial application, security guarantees are indispensable. As such, the importance of a having supervisor in order to detect faults in the localization system has been addressed.
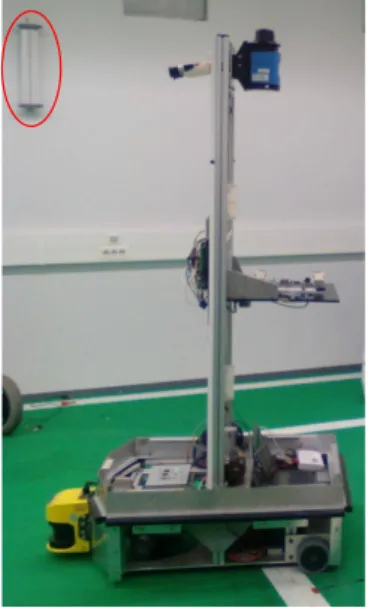
Fig. 7: Mobile platform used to perform ground truth comparison with the solu-tion proposed (reflector highlighted in red ellipse).
5
PRACTICAL RESULTS
This section presents the experimental results which will be used to validate the proposal at two levels - precision and robustness. To test the precision, the experiments were conducted in a robotics laboratory, where the response of the system proposed was compared with the response of an industrial system based
on laser localization. To test the robustness to outliers, the proposed system’s re-sponse stability to a dataset gathered was analyzed in an industrial environment with different configurations.
5.1 Precision Results
In order to validate the proposed approach with the ground truth, we used an-other AGV equipped with a commercial navigation laser based on triangulation (SICK NAV350), see figure 7. This laser does not only provide the robot’s pose, but also the reflectors’ relative position (ZB of figure 3).
In figure 8 the position of the four reflectors installed (blue) was marked, as well as the path (red) made by the AGV, which begins to move forward from P0 and upon reaching P1 reverses to P2, then moves forward to P3, and finally reverses back to P0. Along this path, the pose provided by our system is compared with the pose provided by the commercial laser triangulation system. It is important to stress that, in this experiment, a navigation laser is used and not a security laser. Therefore, the four reflectors are installed in the walls so that they are always visible along the path, as the laser has a Field of View (FOV) of 360◦. The output of the commercial laser triangulation system was used by the trajectory controller. The latter consists of a PID controller for parametric curves based on splines.
As expected, low positioning and orientation errors were obtained, as con-firmed by the blue lines in figure 9, where the algorithm worked with a 360◦ field of view. With this, it is also possible to address the system’s response with less sensory information. For that, the proposed systems field of view was artifi-cially reduced to 180◦ by the software (measurements exceeding 90 degrees are ignored). This situation is analogous to our setup where we are using security lasers and where the field of view is typically reduced and positioned at a lower height. By imposing this restriction to the system, it was possible to obtain the results shown by the red lines in figure 9. The green line relates to the visible reflectors for the reduced FOV (field of view).
It is noted that the accuracy of the system proposed is not significantly affected by reducing the FOV (except for situations where less than two visible beacons are available and only odometry is used for long periods of time). These results show that using the Kalman filter is advantageous. The system used here as ground truth is based on laser triangulation, and therefore only works if at least three reflectors are visible simultaneously (the recommended value is five visible reflectors). Moreover, by merging angles and distance measurements in reflectors with odometry, the Kalman filter can estimate the robot’s pose with less than three reflectors in the line of sight.
5.2 Robustness analysis-Outliers rejection
In the previous section, the system’s accuracy was analyzed using a navigation laser, whereas this sections addresses the safety laser and the platform presented
Fig. 8: Reflectors map (blue circles) and designed path (red line) for ground truth comparison. Grid size: 1m.
in figure 1. Here, the system’s response is analyzed when exposed to adversity in a real manufacturing environment.
As part of Project PRODUTECH PSI PPS3, a public demonstration was made of the system to validate, in an industrial environment, the localization system developed. Figure 10 shows the demonstration scenario in a manufac-turing environment. With this demonstration, it was possible to collect data and validate the system, as the robot successfully completes its mission for a period of 6 consecutive hours without failures. The AGV navigated in an area of 24m x 13m at a speed of 0.5m/s, and its mission was to carry tables between working stations. To do so, an accuracy of about 1 cm in position and 3 degrees in orientation is required. This demonstration was especially demanding for the localization system because there were about fifty people walking around in the AGV navigation area and the floor was uneven. Therefore, at certain points of the trajectory, the laser range was reduced to 4m because the laser was point-ing to the floor. Overall, the number of reflector occlusions and the amount of outliers that the system is exposed to are increased.
Figure 11 gives an idea of the system’s exposure to outliers in this demon-stration. The position of the installed reflectors is highlighted with dark blue circles, as well as the path considered to generate this image. The AGV has moved backwards from P0 to P1 and then followed straight ahead to P2. During this path, the position of the reflectors detected by the safety laser is marked with yellow and red dots. The yellow dots correspond to inliers and the red dots are the outliers rejected by the detector filter and the association filter.
0 1 2 3 4 0 0,005 0,01 0,015 0,02 0,025 0,03 0,035
0 100 200 300 400
Visib le Beacons In side F O V 18 0 ° P os it ion Err or (m) time (s)
FOV 180° FOV 360° Visible Beacons Inside FOV 180°
0 1 2 3 4 -0,8 -0,6 -0,4 -0,2 0 0,2 0,4 0,6
0 100 200 300 400
Visib le Beacons In side F O V 18 0 ° Orien ta ti on err or ( ° ) time (s)
FOV 180° FOV 360° Visible Beacons Inside FOV 180°
Fig. 9: Comparison of errors from the proposed approach with two different FOV (blue line: 360◦ FOV and red line: 180◦ FOV). The upper graph represents the position error and the bottom represents the orientation error.
Fig. 10: Industrial environment scenario of the localization tests.
P0 P1 P2
Fig. 11: Reflector installation in an industrial environment (dark blue). The red and yellow dots represent the positions of the reflector detected by the safety laser scanner during one run from P0 to P1, and then to P2. The red dots represent rejected outliers from the detector and association filters, and the yellow dots represent the inliers. Grid size: 1m.
A screen-shot of the navigation system interface is also provided (figure 12), which was taken during the path described above. This figure features: the reflec-tors’ mapMB(dark blue dots), the covariance of the AGV’s estimated position, represented with the red ellipse (right upper corner), and the corresponding co-variance observations prediction represented by blue ellipses. This area around the reflectors’ position corresponds to the validation area, based on the asso-ciation filter. The observations that fall out this area mean that they are less likely by 5%, marked as outliers and ignored by the system. Figure 12 shows the detected reflectors represented with yellow circles, inliers, and the red rep-resents the measurements rejected, outliers (left bottom corner). The black dots represent the measurements of the distances provided by the safety laser (ZL).
Fig. 12: Screenshot of the application during localization tests. The red points are the rejected outliers, and the yellow points are the accepted reflectors. The blue ellipses show the accepted area for inliers, and the red ellipse (upper right corner) represents the AVG covariance positioning. The remaining black points represent the data acquired by the security laser scanner. Grid size: 1m.
At this point, it is evident that there the safety laser detects various false positives in the reflectors’ detection. In applications such as these, the correct outliers filter take a central role. In the present approach, this filtering is per-formed on two points of the system, on the reflector detector (detector filter) and after the association process (association filter). In order to highlight the importance of the filtering process we select a part of the collected data and once again test the system with three different settings. Figure 13 respectively presents the positioning and orientation results without any filter (blue line), only with the detection filter (green line), and finally with both filters (detector and association; red line). It is easy to understand that the absence of a filtering system produces noise and unstable results. The detector filter improves the po-sitioning result, but still lacks stability and introduces some error. Finally, the use of both filters makes it possible to perform a stable measurement where all the outliers are correctly identified, without unexpected variations in position and orientation.
-1 0 1 2 3 4
-3 -2 -1 0 1 2 3 4
Es
ti
ma
ted
P
osition
y (
m)
Estimated Position x (m)
without outliers filter detector filter
detector and association filter
-180 -130 -80 -30 20 70 120 170
0 10 20 30 40 50 60
Es
ti
ma
ted
Orien
ta
ti
on
(°
)
time (s)
without outliers filter detector filter
detector and association filter
Fig. 13: Response to a dataset collected in the industrial environment (upper position, down orientation). The results from the three different configurations are shown: without filters (blue), just with the detector filter (green) and with both filters (red).
Videos containing the localization system interface during the tests men-tioned above can be accessed at these links:
– Without outliers filter:http://youtu.be/wCv9qVTSICg
– Detector filter:http://youtu.be/iTCb5UR6CRE
– Detector and association filter:http://youtu.be/4_Io52ORvOE
Videos during the tests where the AGV is performing its transporting mission can be accessed at these links:
– Laboratory:http://youtu.be/6SQ3llbTSFk
– Adira industrial environment:https://youtu.be/cyokKOBxcY0
6
CONCLUSION AND FUTURE WORK
This work describes the development of a localization system for an industrial AGV. This system features the laser used by the security system to locate the robot, based on reflectors installed close to the ground. This approach differs from traditional AGV implementations that rely on a navigation laser installed on top of the robot to perform the localization. The results obtained show that, even though the sensorial quality of a security laser is lower when compared to navigation lasers, the precision and robustness requirements of industrial appli-cations are still met.
The proposal presented here consists of combining an Extended Kalman Fil-ter with a series of two other filFil-ters. The first, the detector filFil-ter, detects outliers based on the known dimension of the installed reflectors, while the second takes into account the pose of the robot, rejecting measurements with low probability. Because security is key in industrial systems, a module called Uncertainty Supervisor is presented whose goal is to detect faults in the localization system. These faults may be caused by the occlusion of all the reflectors, by obstacles or by a possible slippage of the AGV wheels.
In terms of results, it was possible to conclude that precision better than 10mm can be achieved, depending on the number of visible reflectors, as well as a fast computational time (5ms), which is crucial in industrial environments. The system was also tested extensively in adverse industrial conditions. It was shown that turning the filtering modules off in the proposed approach resulted in a degradation of the stability of the Kalman filter’s response.
In the future, the goal is to extend the analysis to other sensorial fusion algo-rithms. As shown in 9 (around 200 seconds), in the precision tests a significant increase in the error was verified when the system detects just one reflector after navigating for some time using odometry only. The source of this error is related to linearization errors from the EKF. The goal is to test other nonlinear filters in order to improve these results, such as the Unscented Kalman Filter (Wan and Van Der Merwe 2000) and the Cubature Filter (Arasaratnam and Haykin 2009). It is important to stress that the Uncertainty supervisor was not used in the experiment. In fact, with this module, the localization system would reach
an error condition, due to the uncertainty accumulation as a result of the lack of sensor information.
Another issue that should be addressed is the kidnapping problem. In this sense, the goal is to combine the solution proposed here with the proposal in work Ronzoni et al. (2011). Besides making it possible to initialize the system automatically, it can increase the robustness of the system, adding redundancy and helping in the derail detection of the EKF.
Another future goal is upgrading the Uncertainty Supervision. In this ap-proach, the effect of covariance is ignored when the amount of uncertainty esti-mated by the filter is evaluated. In the future, the goal is to improve this point taking into account the correlations between different quantities estimated by the EKF. However it is believed that the current simplifications do not have other relevant practical implications.
To summarize, the system proposed here allows good precision and robust-ness performances when localizing an AVG with a security laser. The filtering process suggested makes it possible to overcome several of the problems that could rise when using the laser at the base of the robot, due to occlusions, for instance. Also, the system was successfully tested in adverse conditions and had performances comparable to commercial systems.
ACKNOWLEDGMENT Project ”TEC4Growth” - Pervasive Intelligence,
En-hancers and Proofs of Concept with Industrial Impact/NORTE-01-0145-FEDER-000020” is financed by the North Portugal Regional Operational Programme (NORTE 2020), under the PORTUGAL 2020 Partnership Agreement, and through the European Regional Development Fund (ERDF).
This manuscript is an extended version of the prior work presented at ROBOT’2015 - Second Iberian Robotics Conference, Lisbon, November 2015, authored by H´eber Sobreira, A. Paulo Moreira, Paulo Gomes Costa and Jos´e Lima and entitled Mobile Robot Localization based on a Security Laser: An Industry Scene Implementation.
References
Arasaratnam, I. and S. Haykin (2009). “Cubature Kalman Filters”. In: IEEE
Transactions on Automatic Control 54.6, pp. 1254–1269. issn: 0018-9286.
doi:10.1109/TAC.2009.2019800.
Bailey, T., E.M. Nebot, J.K. Rosenblatt, and H.F. Durrant-Whyte (2000). “Data association for mobile robot navigation: a graph theoretic approach”. In: Pro-ceedings 2000 ICRA. Millennium Conference. IEEE International
Confer-ence on Robotics and Automation. Symposia Proceedings (Cat. No.00CH37065).
Vol. 3. IEEE, pp. 2512–2517. isbn: 0-7803-5886-4. doi: 10 . 1109 / ROBOT .
2000.846406.
Beinschob, Patric and Christoph Reinke (2013). “Strategies for 3D data ac-quisition and mapping in large-scale modern warehouses”. In:Proceedings -2013 IEEE 9th International Conference on Intelligent Computer
Communi-cation and Processing, ICCP 2013, pp. 229–234. isbn: 9781479914937.doi:
10.1109/ICCP.2013.6646113.
Besl, P.J. and H.D. McKay (1992). “A method for registration of 3-D shapes”.
In:IEEE Transactions on Pattern Analysis and Machine Intelligence 14.2,
pp. 239–256.issn: 01628828.doi: 10.1109/34.121791.
Borenstain, J., H. R. Everett, L. Feng, and D. Wehe (1997). “Mobile Robot Positioning and Sensors and Techniques”. In: Journal of Robotic Systems,
Special Issue on Mobile Robots 14.4, pp. 231–249.
Censi, Andrea (2008). “An ICP variant using a point-to-line metric”. In: 2008
IEEE International Conference on Robotics and Automation. IEEE, pp. 19–
25.isbn: 978-1-4244-1646-2.doi:10.1109/ROBOT.2008.4543181.
Eliazar, A. I. and R. Parr (2004). “Learning probabilistic motion models for mo-bile robots”. In:Proceedings of International Conference on Machine Learn-ing, pp. 32–38.
Grisetti, G., C. Stachniss, and W. Burgard (2007). “Improved Techniques for Grid Mapping with Rao-Blackwellized Particle Filters”. In: IEEE
Transac-tions on Robotics 23.1, pp. 34–46.
Lauer, Martin, Sascha Lange, and Martin Riedmiller (2006). “Calculating the perfect match: an efficient and accurate approach for robot self-localization”.
In:Robocup 2005: Robot soccer world cup c, pp. 142–153.
Lee, K., N. L. Doh, W. K. Chung, S. K. Lee, and S. Nam (2008). “A robust lo-calization algorithm in topological maps with dynamic noises”. In:Industrial
Robot: An International Journal 35.5, pp. 435–448.
Lu, Feng and Evangelos Milios (1997). “Robot Pose Estimation in Unknown Environments by Matching 2D Range Scans”. In:Journal of Intelligent and
Robotic Systems: Theory and Applications18.3, pp. 249–275.issn: 09210296.
Nunez, Pedro, Ricardo Vaizquez, Jose C. del Toro, Antonio Bandera, and Fran-cisco Sandoval (2007). “A Curvature based Method to Extract Natural Land-marks for Mobile Robot Navigation”. In: 2007 IEEE International
Sympo-sium on Intelligent Signal Processing. IEEE, pp. 1–6.isbn:
978-1-4244-0829-0.doi:10.1109/WISP.2007.4447573.
Quigley, M., B. Gerkey, K. Conley, J. Faust, T. Foote, J. Leibs, E. Berger, R. Wheeler, and A. Y. Ng (2009). “ROS: an open-source Robot Operating System”. In:Proceedings Open-Source Software workshop of the International
Conference on Robotics and Automation.
Reinke, C. and P. Beinschob (2013). “Strategies for contour-based self-localization in large-scale modern warehouses”. In:IEEE 9th International Conference on
Intelligent Computer Communication and Processing, ICCP 2013, pp. 223–
227.doi: 10.1109/ICCP.2013.6646112.
Ronzoni, D., R. Olmi, C. Secchi, and C. Fantuzzi (2011). “AGV global local-ization using indistinguishable artificial landmarks”. In:IEEE International
Conference on Robotics and Automation, pp. 287–292.
Sabattini, L., V. Digani, C. Secchi, G. Cotena, D. Ronzoni, M. Foppoli, F. Oleari, Christoph Reinke, and Patric Beinschob (2013). “Technological roadmap to boost the introduction of AGVs in industrial applications”. In:Proceedings -2013 IEEE 9th International Conference on Intelligent Computer
Communi-cation and Processing, ICCP 2013, pp. 223–227. isbn: 9781479914937.doi:
10.1109/ICCP.2013.6646112.
Schulze, Lothar, Sebastian Behling, and Stefan Buhrs (2008). “Automated guided vehicle systems: a driver for increased businness performance”. In: pp. 19–21. Serrano, A. R., H. Liu, and G. C. Pettinaro (2008). “Mobile robot localization in quasi dynamic environments”. In:Industrial Robot: An International Journal 35.3, pp. 246–258.
Sobreira, H., M. Pinto, A. P. Moreira, P. G. Costa, and J. Lima (2015). “Robust Robot Localization Based on the Perfect Match Algorithm”. In:Proceedings of the 11th Portuguese Conference on Automatic Control Lecture Notes in
Electrical Engineering 321, pp. 607–616.
Thrun, S. and W. Burgard (2005). Probabilistic Robotics (Intelligent Robotics
and Autonomous Agents series). The MIT Press.
Wan, E.A. and R. Van Der Merwe (2000). “The unscented Kalman filter for nonlinear estimation”. In: Proceedings of the IEEE 2000 Adaptive Systems for Signal Processing, Communications, and Control Symposium (Cat. No.
00EX373). IEEE, pp. 153–158.isbn: 0-7803-5800-7. doi:10.1109/ASSPCC.
2000.882463.
![Fig. 2: Representation of the AGV relative referential (R x R y ) at pose [x v y v θ v ] T in the world referential (W x W y )](https://thumb-eu.123doks.com/thumbv2/123dok_br/16979042.762750/8.892.232.678.392.817/fig-representation-agv-relative-referential-pose-world-referential.webp)