AbstrAct: Plants from the genus ipomoea are among the most important weeds in Brazil. The objective of this study was to
determine the impact of different densities of 2 species of Ipomoea
(I. grandifolia and I. purpurea) under different environments (counties of Pato Branco and Renascença, Paraná state, Brazil) on soybean
biometric variables, yield components and crop yield loss. Field
experiments in 2 distinct places were conducted in a randomized
block design, where 1 factor consisted of 8 plant densities (0, 2, 4,
6, 8, 10, 15 and 20 plants·m−2), whereas the other factor consisted of the 2 Ipomoea species. Joint analysis of the data was performed
bAsIc ArEAs -
Article
Morning glory species interference on the
development and yield of soybeans
Fortunato De Bortoli Pagnoncelli1*, Michelangelo Muzell Trezzi1, Betania Brum1, Ribas Antonio Vidal2, Álvaro Fernando Portes1, Everton Luiz Scalcon1, Adriano Machado1
1.Universidade Tecnológica Federal do Paraná - Agronomia - Pato Branco (PR), Brazil. 2.Universidade Federal do Rio Grande do Sul - Porto Alegre (RS), Brazil.
*Corresponding author: [email protected]
Received: Aug. 14, 2016 – Accepted: Dec. 2, 2016
considering the factors environment, Ipomoea densities and species. The impact of one Ipomoea plant·m−2 was very high, reaching 26%, on average, of species and environments. The maximum soybean
yield loss experienced with theIpomoea density of 20 plants·m−2 was close to 80%. The impact of Ipomoea density was more important than the species and environment. This result highlights the
importance of correct management of plants of these weed species in
soybean crop.
INtrODUctION
Weeds are among the worst limiting factors of the crop yield potential and can decrease 34% of the grain production of several crops, contrasted with 18 and 16% yield loss caused by pests and diseases, respectively (Oerke 2006). The degree of weed interference on the crops depends on the time of weed infestation, on the environment and on characteristics of the weed species (Kiaer et al. 2012; Hugo et al. 2014).
The genus Ipomoea is the most numerous on the Convolvulaceae family and comprises around 500 species (McDonald and Mabry 1992). Ipomoea plants have a voluble growth habit with flexible and robust stems, which allows them to climb the crop plants, decreasing the availability of light and reducing the mechanical harvest efficiency. The impact of Ipomoealacunosa plants on soybean grain yields may reach 80% (Norsworthy and Oliver 2002). The species I. purpurea and I. grandifolia infest large crop areas in Brazil on many crop species. They are considered some of the most important species in soybean. The species are differentiated primarily by the size and shape of the leaf blade and the reproductive structures (Moura and Morim 2015). It is believed that the morphological differences between species can directly influence the competitive ability of plants, providing distinct damage on the development of soybean. There is no specific research investigating the competitive ability of the species I. grandifolia and I. purpurea within the soybean crop.
The environment consists of biotic and abiotic factors, which influence the degree of interference between crops and weeds (Pitelli 1985). The environment directly influences the development of the plants, changing its growth capacity and hence the competitive ability. Environmental conditions favorable to the development of crop plants will make them more competitive, while less favorable conditions for crops encourage the development of weeds (Zimdahl 2004; Radosevich et al. 2007). Cultivated plants were selected mainly by productive potential. Therefore they tend to be more sensitive to environmental variation, while weeds have higher plasticity adaptive to environmental changes (Radosevich et al. 2007).
The classical method to evaluate the yield losses caused by a certain species considers different plant weed density within a fixed crop density (Cousens 1985; Dodamani and Das 2013; Tanveer et al. 2015). For example, soybean yield infested with Cyperus rotundus (0-200 pl∙m-2) was decreased
by 47% (Das et al. 2014), while soybean yield loss can reach 21% due infestation with Trianthema portulacastrum
(0-200 pl∙m-2) (Hazra et al. 2011). Bidens spp. infestation (0-150 pl∙m-2) can decrease soybean yield by 40% (Rizzardi et al. 2003). The effect of each weed plant on the crop yield is highest under low weed density and it is defined as the parameter i. Indeed, the parameter i represents the percentage of yield loss caused by each weed, at limited weed densities, and it is used to estimate the weed economic threshold (Das et al. 2014; Trezzi et al. 2015).
The hypothesis is that the species I. grandifolia and
I. purpurea provide differentiated damage on the development and yield of soybean grain when are grown in two different environments. The objective of this study was to determine the impact of different densities of two species of Ipomoea
(I. grandifolia and I. purpurea) and different environments (counties of Pato Branco and Renascença, Paraná state, Brazil) on soybean biometric variables, yield components and crop yield loss.
MAtErIAL AND MEtHODs
Two field experiments were conducted during the years 2011/2012 and 2012/2013. The first was held in the county of Pato Branco (lat 26°18′S, long 52°69′O, altitude of 760 m above sea level) and the second in the county of Renascença (lat 26°19′S, long 52°86′O, altitude of 780 m above sea level), both located in the Paraná state, Brazil. The soil type is classified as Distroferric Red Latosol (Oxisol) and its characteristics are shown in Table 1. The climate is classified as humid subtropical (Cfa). Environmental conditions during the experiments are shown in Figure 1.
The first experiment started on 05 November 2011, whereas the second trial started on 15 November 2012. The soybean sowing was carried out mechanically with a density of 289,000 plants∙ha−1, using the cultivar BMX Turbo with indeterminate growth habit and maturity group 5.8. The Ipomoea seeds were purchased from Agrocosmos Ag Company (São Paulo, Brazil) and multiplied on the field in the years prior to the use. The dormancy of
Ipomoea grandifolia seeds was overcome according to the method described by Pazuch et al. (2015). Afterwards, the Ipomoea seeds were sown manually on the field using 3 times the amount of seed needed for each density and excess seedlings were removed approximately 10 days after their emergence.
During the crop development, the plants from other weed species were removed manually. Soybean diseases were controlled through three applications of fungicides azoxystrobin + cyproconazole (60 + 24 g∙ha−1). Pests were controlled on 3 occasions using the insecticides
profenofos + lufenuron (75 + 7.5 g∙ha−1), thiamethoxam + lambda-cyhalothrin (28 + 21 g∙ha−1) and acephate (750 g∙ha−1). To facilitate the harvest of Ipomoea and soybean crop, the herbicide paraquat (600 g∙ha−1) was sprayed at the end of the plant life cycle.
When the soybean plants were at the R5 growth stage, it was collected 10 plants randomly distributed in the plot to evaluate the following biometric variables: leaf area (LA), fresh leaf mass (FLM) and fresh stem mass (FSM). Th e LA was determined with an integrator (Licor model LI-3100C). Th e FLM and FSM were determined in a scale immediately aft er plant sampling. Th e data were expressed in unit per plant.
During the soybean physiological maturity, 10 plants were collected randomly to determine: plant height (PHT); fi rst pod height (FPH); and the yield components: pods per plant (PPP) and beans per pod (BPP). In each sub-plot, all the plants from the 2.7 m2 were hand harvested to determine the grain yield. Th e grain yield was corrected to
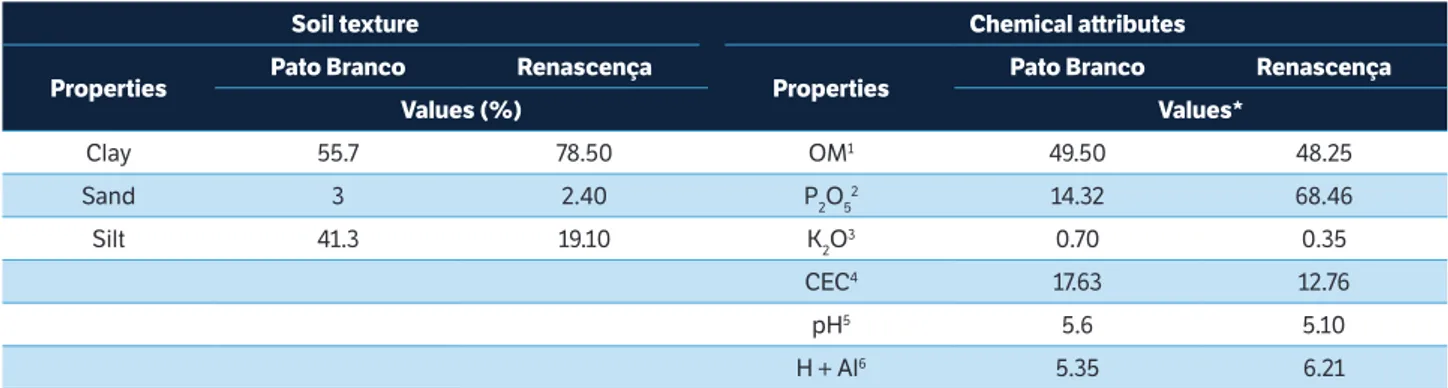
*1Organic matt er (g∙dm−3); 2Phosphorus (mg∙dm−3); 3Potassium (cmolc∙dm−3); 4Cation exchange capacity; 5Soil pH; 6Exchangeable acidity (cmol c∙dm−3).
table 1. Soil texture and chemical att ributes of Distroferric Red Latosol (Oxisol). Pato Branco, PR, 2011/2012, and Renascença, PR, 2012/2013.
soil texture chemical att ributes
Properties Pato branco renascença Properties Pato branco renascença
Values (%) Values*
Clay 55.7 78.50 OM1 49.50 48.25
Sand 3 2.40 P2O52 14.32 68.46
Silt 41.3 19.10 K2O3 0.70 0.35
CEC4 17.63 12.76
pH5 5.6 5.10
H + Al6 5.35 6.21
Figure 1. Precipitation, minimum and maximum temperature during periods in which the experiments were conducted in (a) Pato Branco and (b) Renascença. Pato Branco, 2011/2012 and Renascença, 2012/2013.
0
Dec Jan
Experiment period (days)
P
recipitation (mm) Temper
atur
e (
oC)
Fev Mar 20
40
40
30
20
10 60
80 100
0
Dec Jan
Experiment period (days)
P
recipitation (mm)
T
emper
atur
e (
oC)
Fev Mar 20
40
40
30
20
10 60
80 100
Precipitation Maximum temperature Minimum temperature
13% moisture. The soybean grain mass was determined in 400 seeds from the bulk harvested and converted to 1,000-grain mass (TGM). The soybean grain yield obtained in each subplot was converted to percentage yield loss (YL) in relation to weed-free treatments.
The data were submitted to the analysis of variance using the statistical program SOC - NTIA (Embrapa 1997). When no significant (p ≤ 0.05) environment (place of the experiment) effect was detected, it was conducted a joint analysis of the experiments. The relationship between the
Ipomoea density and the other dependent variables was explained using nonlinear sigmoidal model (Eq. 1) and 3-parameter logistic models (Eq. 2). The relation between the weed density and soybean grain yield loss was adjusted using a hyperbolic model (Eq. 3).
Renascença (Table 2). Interference with I. grandifolia resulted in soybean PHT approximately 5% lower compared to
I. purpurea (Table 2).
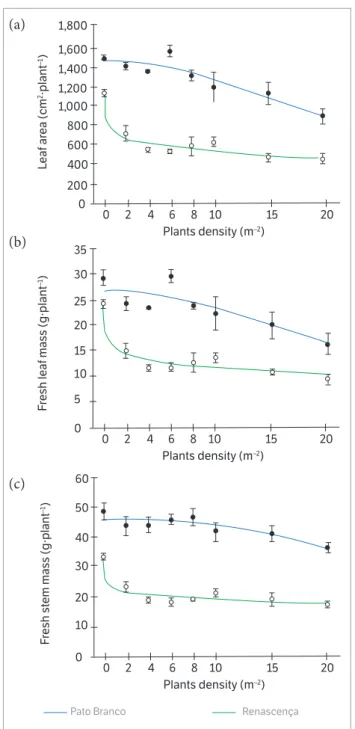
Interference with I. purpurea decreased LA and FSM at a higher magnitude than the observed with I. grandifolia
(Figures 3a,b). Thus, lower densities of I. purpurea than
I. grandifolia were required for 50% reduction of these variables (D50) (Table 3). Indeed, the D50 for the variables LA and FSM measured on I. purpurea were 17 and 42 plants∙m−2, whereas for I. grandifolia, 89 and 65 plants∙m−2, respectively.
On the experiment located in Renascença, the Ipomoea
plants had a greater impact on the variables LA and FLM, compared to the data from the experiment in Pato Branco (Figures 4a,b,c). Again, the D50 values reflected these results (Table 3).
There was density-dependent plastic response of the weed species on the soybean crop. For instance, FPH increased in direct proportion to the weed density (Figure 5). However, the impact of the weed species was also location-dependent. Y = A / [1 + exp − (X − D50 / B)] (1)
(2)
(3) Y = A / [1 + (X / D50) ^ B]
YL = (A × X) / (D50 + X)
where: Y is the dependent variable; X represents Ipomoea
density; A means maximum asymptote of the curve; B is the curve slope; D50 represents weed density that reduces 50% of the dependent variable; YL is the soybean yield loss (%). The ratio between the parameters A and D50 in Eq. 3 results in the parameter “i”, which represents the yield loss when the weed density is 1 plant∙m−2 (Cousens 1985).
rEsULts AND DIscUssION
The analysis of variance indicated significant interaction for the following variables: place × species × densities for FPH and PPP; place × density for LA, FLM and FSM; species × density for LA and FSM; and place × species to YL. There were significant simple effects for density to PHT, TGM, BPP and YL; species to PHT; and place for PHT, TGM, BPP and YL.
Biometric variables
The soybean PHT decreased in response to increase of Ipomoea density (Figure 2). On the experiment located at Pato Branco, the soybean PHT was 13% higher than at
Figure 2. Plant height of the soybean plants cultivar BMX Turbo assessed at harvest time as affected by different Ipomoea densities.
Data averaged across Ipomoeagrandifolia and I. purpurea species as
well as the environments: Pato Branco, 2011/2012, and Renascença, 2012/2013. Each dot corresponds to the average of 3 repetitions and the bars represent its standard error. Parameters are shown on Table 3. table 2. Soybean plant height as affected by the interference of 2 Ipomoea species on experiments conducted in Pato Branco and Renascença. Pato Branco, 2011/2012, and Renascença, 2012/2013.
Environments soybean plant height (cm) species
I. purpurea I. grandifolia Average
Pato Branco 76.52 71.30 73.9 a*
Renascença 64.63 63.19 63.9 b
Average 70.6 a* 67.2 b
*Means with the same letter do not differ by the Tukey test (p ≤ 0.05). Data represent the average of all Ipomoea densities.
0 2 4 6 8 10
60
15 64
62
20 68
66 72
70 74 76 78
Plants density (m–2)
Plant height (cm
Whereas in Pato Branco the impact of I. grandifolia density on FPH was higher than the observed for I. purpurea densities in Renascença, the differences between species Ipomoea were very limited (Figure 5).
The soybean biometric variables LA, FLM and FSM were inversely related to the density of Ipomoea plants, whereas FPH increased proportionally to the Ipomoea
density. It is reasonable to speculate that the coexistence between Ipomoea and soybean plants throughout their life cycle may trigger physiological processes that will result in shoot development. For instance, the “shade avoidance” syndrome can increase the FPH in response to the decrease in the proportion of red light (R) in relation to the far-red light (FR) caused by the increased density
1Three-parameter logistic model; 2Three-parameter sigmoidal model; The values in parentheses indicate the standard error of the parameter estimate; *p ≤ 0.05; **p ≤ 0.01; nsNon-significant. A = Maximum equation asymptote; B = curve slope; D
50 = Density needed for 50% reduction of the analyzed variable; R2 = Coefficient of
determination; MSE = Mean square error; p = Probability; PHT = Plant height; LA = Leaf area; FLM = Fresh leaf mass; FSM = Fresh stem mass; FPH = First pod height.
Figure 3. (a) Leaf area and (b) fresh stem mass in soybean plants cultivar BMX Turbo under densities of Ipomoeapurpurea and I. grandifolia in 2 environments: Pato Branco, 2011/2012, and Renascença, 2012/2013. Each dot corresponds to the average of 3 repetitions and the bars represent its standard error. Parameters are shown on Table 3.
0 2 4
I. purpurea I. grandifolia
6 8 10 15 20
1,600
1,400
1,200
1,000
800
600
400
200
0
Plants density (m–2)
Le
af ar
e
a (cm
2∙plant −1)
0 2 4 6 8 10
0
15 10
20 20
35 40 50
Plants density (m–2)
F
resh st
em ma
ss (g∙plant
–1)
table 3. Parameters of the equation, coefficient of determination, mean square error and probability of the equation for the variables plant height, leaf area, fresh leaf mass, fresh stem mass and first pod height of soybean plants. Pato Branco, 2011/2012, and Renascença, 2012/2013.
Variable treatments Parameters r² MsE p
A b D50
PHT 74.43 (0.99)** 0.55 (0.14)** 604.54 (525.44)ns 0.90 1.02 < 0.01
LA I. grandifoliaI. purpurea11
1,422.76 (84.27)**
1,199.64 (62.85)**
0.97 (0.24)**
0.50 (0.18)*
16.91 (3.22)**
65.33 (43.78)ns
0.89
0.81 3,992.087,714.77 < 0.01< 0.01
LA RenascençaPato Branco11
1,464.86 (64.83)**
1,132.78 (64.27)**
2.10 (0.83)*
0.31 (0.12)*
25.02 (4.23)**
6.94 (3.18)ns
0.80
0.91 9,405.114,132.06 < 0.01< 0.01
FLM RenascençaPato Branco11
26.87 (1.90)**
24.19 (1.35)**
2.06 (1.26)ns
0.29 (0.11)ns
24.76 (6.51)*
7.21 (3.52)ns
0.60
0.91 1.827.94 < 0.010.04
FSM I. grandifoliaI. purpurea11
43.49 (1.75)**
38.26 (0.86)**
0.67 (0.16)**
0.63 (0.12)**
41.82 (13.42)*
88.70 (30.57)*
0.90
0.94 3.150.77 < 0.01< 0.01
FSM RenascençaPato Branco11
46.16 (1.35)**
33.30 (1.73)**
2.26 (1.28)ns
0.20 (0.11)ns
36.47 (13.80)*
40.29 (44.75)ns
0.67 0.89
4.74 3.01
0.02 < 0.01
FPH
Pato Branco:
I. purpurea2 23.58 (1.09)** 5.65 (2.86)ns −6.62 (3.36)ns 0.77 0.94 0.01
Pato Branco:
I. grandifolia2 29.32 (3.23)** 9.93 (4.33)ns −4.33 (1.56)* 0.90 0.98 < 0.01
Renascença:
I. purpurea2 27.57 (1.02)** 8.74 (1.68)** −5.64 (0.84)** 0.97 0.18 < 0.01
Renascença:
I. grandofolia2 25.55 (0.46)** 5.77 (0.85)** −4.89 (0.77)** 0.98 0.15 < 0.01
of the weed population (Ruberti et al. 2012; Vidal et al. 2012; Gundel et al. 2014).
Overall, I. purpurea plants had a greater impact on soybean than I. grandifolia plants. The biometric variables most affected by that weed species were LA and FSM. Also, the FPH in soybean plants was higher in the presence
of I. grandifolia than I. purpurea. This result is probably a consequence of differences on morphological and physiological characteristics between I. grandifolia and
I. purpurea plants, specially the higher leaf area of I. purpurea
plants in relation to I. grandifolia plants (Lorenzi 2006; Moura and Morim 2015).
The weed-crop interference would reduce the availability of water, nutrients and light. The soil chemical analysis from the experimental sites document medium to high levels of nutrients (Tedesco et al. 2004) on both environments (Pato Branco and Renascença) (Table 1), suggesting that the productivity differences between environments are not related to soil fertility. Thus, rainfall distribution and intensity and air temperatures (Figure 1) constitute the main differences between both experiments. Compared to Pato Branco, the experiment in Renascença had greater cumulative rainfall during the soybean development cycle. However, there was better rainfall distribution in Pato Branco than in Renascença (Figure 1). Environmental conditions favorable to the development of the crop increase the competitive ability of the plants in relation to the weeds. Nevertheless, more competitive weed species are expected under unfavorable environmental conditions (Radosevich et al. 2007). It is possible to speculate that the less favorable conditions for the development of soybean plants in Renascença reflected in lower development of the crop in this environment and increased competitive ability of the weeds, when contrasted to Pato Branco conditions.
Figure 5. The soybean first pod height in response to densities of Ipomoea purpurea and I. grandifolia in Pato Branco and Renascença environments. Pato Branco, 2011/2012, and Renascença, 2012/2013. Each dot corresponds to the average of 3 repetitions and the bars represent its standard error. Parameters are shown on Table 3. Figure 4. (a) Leaf area, (b) fresh leaf mass and (c) the fresh stem
mass in soybean plants, cultivar BMX Turbo under Ipomoea densities
(average of Ipomoeagrandifolia and I. purpurea) in Pato Branco and
Renascença environments. Pato Branco, 2011/2012, and Renascença, 2012/2013. Each dot corresponds to the average of 3 repetitions and the bars represent its standard error. Parameters are shown on Table 3.
0 2 4
Pato Branco: I. purpurea
Pato Branco: I. grandifolia
Renascença: I. purpurea
Renascença: I. grandifolia
6 8 10 10
15 15
20 20
25 30 35
Plants density (m–2)
Fir
st pod height (cm
–1)
0 2 4
Pato Branco Renascença
6 8 10
0
15 10
20 20
30 40 50 60
Plants density (m–2)
F
resh st
em ma
s
s (g·plant
–1)
0 2 4 6 8 10
0
15 5
10
20 15
20 25 30 35
Plants density (m–2)
F
resh le
af ma
s
s (g·plant
–1)
0 2 4 6 8 10
0
15 20
1,800
1,600
1,400
1,200 1,000
800
600
400
200
Plants density (m–2)
L
e
af ar
e
a (cm
2·plant –1)
(a)
(b)
Yield components and yield losses
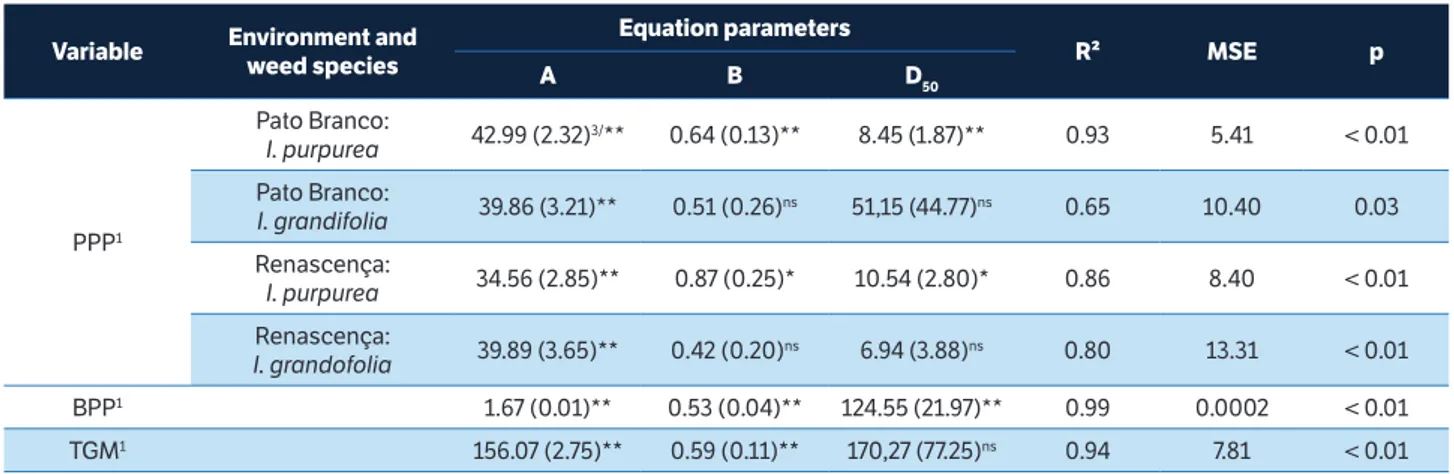
The number of PPP responded in inverse proportion to the Ipomoea plant density. Nonetheless, both the place of the experiment and the Ipomoea species had an impact
on the PPP (Figure 6a and Table 4). In Renascença, the differences between I. grandifolia and I. purpurea were limited, whereas in Pato Branco, I. purpurea plant density had a greater impact on the PPP than I. grandifolia
density (Figure 6a and Table 4).
Variable Environment and
weed species
Equation parameters
r² MsE p
A b D50
PPP1
Pato Branco:
I. purpurea 42.99 (2.32)
3/** 0.64 (0.13)** 8.45 (1.87)** 0.93 5.41 < 0.01
Pato Branco:
I. grandifolia 39.86 (3.21)** 0.51 (0.26)
ns 51,15 (44.77)ns 0.65 10.40 0.03
Renascença:
I. purpurea 34.56 (2.85)** 0.87 (0.25)* 10.54 (2.80)* 0.86 8.40 < 0.01
Renascença:
I. grandofolia 39.89 (3.65)** 0.42 (0.20)
ns 6.94 (3.88)ns 0.80 13.31 < 0.01
BPP1 1.67 (0.01)** 0.53 (0.04)** 124.55 (21.97)** 0.99 0.0002 < 0.01
TGM1 156.07 (2.75)** 0.59 (0.11)** 170,27 (77.25)ns 0.94 7.81 < 0.01
table 4. Parameters of the equation, the coefficient of determination (R²), mean square error (MSE) and probability (p) of the equation for the variables pods per plant, beans per pod and thousand grain mass. Pato Branco, 2011/2012 and Renascença, 2012/2013.
.
1Three-parameter logistics; 2D
50 (density needed for 50% reduction of the analyzed variable); 3Values in parentheses indicate the standard error of the parameter
estimate; *p ≤ 0.05; **p ≤ 0.01; nsNon-significant. PPP = Pods per plant; BPP = Beans per pod; TGM = 1,000-grain mass; A = Maximum equation asymptote;
B = curve slope.
Figure 6. Impact of (a) plant density (either for Ipomoeagrandifolia and I. purpurea and in Pato Branco and Renascença) on the number of
pods per plant; Impact of weed density (averaged for I. grandifolia and I. purpurea and 2 places) on (b) number of beans per pod; (c)
1,000-grain mass; (d) Soybean 1,000-grain yield loss. Pato Branco, 2011/2012, and Renascença, 2012/2013. Each dot corresponds to the average of 3 repetitions and the bars represent its standard error. Parameters are shown on Tables 4,6.
Pato Branco: I. purpurea
Pato Branco: I. grandifolia
Renascença: I. purpurea
Renascença: I. grandifolia
0 2 4 6 8 10
0
15 10
20 20
30 40 50 60
Plants density (m–2)
P
ods per plant (n)
0 2 4 6 8 10
100 110 120 130 140 150 160
15 20
Plants density (m–2)
Thousand gr
ain ma
s
s (g)
0 2 4 6 8 10
0.8 1.0 1.2 1.4 1.6 1.8
15 20
Plants density (m–2)
Be
ans per pod (n)
0 2 4 6 8 10
0 20 40 60 80 100
15 20
Plants density (m–2)
So
ybe
an gr
ain yield los
s (%)
(a) (c)
Ipomoea density, at 20 plants∙m−2, decreased 27% the number of BPP and reduced 21% the TGM (Figures 6b,c). However, the differences in the number of BPP and TGM were dependent on the locations of the experiments (Table 5). These variables were, respectively, 29 and 34% smaller in Renascença, when compared to Pato Branco (Table 5).
On the experiment carried out at Pato Branco, the yield component most important to explain the crop yield was PPP (Figure 6). Probably, the contributing factors that explain this result is the limited reduction of LA in this experimental site (Figure 4a) and weed species (Figure 3a). Also, limited reduction of FLM and FSM (Figures 4b,c) in this experiment may explain, in part, the results. Weed competition affects FLM, FSM and branching in dicotyledonous plants (Silva et al. 2014). Reduced branch numbers can decrease the number of flowers per plant, thus decreasing the PPP. In other studies, PPP is the crop yield component most affected by the interference among plants (Green-Tracewicz et al. 2011). The impact of weed density on some variables measured at soybean plant maturity was not homogeneous. Indeed, the D50 value observed for PHT, BPP and TGM was high (Tables 2,3), suggesting that weed density has limited impact on these variables. However, for other variables such as LA, FLM, FSM and PPP, the D50 values were very low, which imply that interference of Ipomoea strongly impact them.
The crop YL was directly proportional to Ipomoea plant density, reaching about 80% at the maximum weed density tested (Figure 6d). For the variable YL, the D50 (Table 6) averaged for the 2 weed species and 2 places was only 3.45 plants∙m−2. The critical level of damage (parameter “i”) estimated with the hyperbolic equation was approximately 26, indicating that each plant of either I. purpurea or I. grandifolia
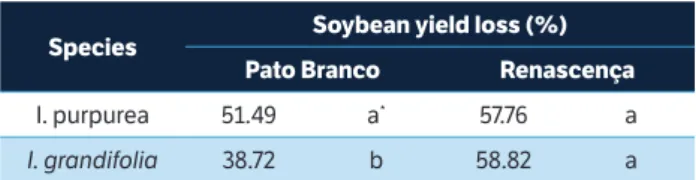
was able to reduce the soybean productivity by 26%. The place by species interaction (Table 7) indicates that
I. purpurea was more competitive in the experiment located in Pato Branco than in Renascença, whereas in Renascença,
soybean YL caused by both weed species were not different from each other.
As was previously speculated it is possible that the less favorable conditions for the development of the soybean plants in Renascença reflected in lower development of the crop in this environment and increased the competitive ability of the weeds, when contrasted to Pato Branco conditions. As a consequence, there was a greater reduction on the yield components and grain yield loss in Renascença than in Pato Branco (Figure 6a and Tables 5,7).
The relationship between YL and Ipomoea plant density followed the classical hyperbolic model (Figure 6d) (Cousens 1985). The maximum YL documented in this research was in accordance to the observed in other studies. For instance,
I. lacunosa,at the density of 62 plants∙m−2, reduced 80% the soybean grain yield (Norsworthy and Oliver 2002).
Overall Ipomoea species and experimental sites, the impact of each plant on the soybean grain yield (parameter “i”) was 26% (Table 6). This value is considered very high compared to other weed species in soybean, such as Cyperus rotundus, with i = 1.0 (Das et al. 2014) and
Conyza bonariensis with i = 0.97% (Trezzi et al. 2015). At limited weed densities, the impact of each weed on the crop yield is additive and proportional to the number
.
*Hyperbolic equation Y = (A × D) / (D
50 + D)based on data converted to percentage
yield loss in relation to weed-free treatments. A = Maximum equation asymptote; D = weed density (independent variable); D50 = Density where 50% of the yield loss occurs; i = A / D50 = Percentual impact of each weed on the crop yield at the density of 1 plant m−2; R2 = Coefficient of determination; p = Probability.
table 5. Number of beans per pod and soybean grain mass evaluated on 2 environments. The data represent the average of all densities
and for Ipomoea grandifolia and I. purpurea species. Pato Branco,
2011/2012, and Renascença, 2012/2013.
Environments beans per pod seed mass
(g∙1,000 seeds−1)
Pato Branco 1.63 a* 165.08 a
Renascença 1.16 b 107.93 b
.
*Means followed by the same letter in the column do not differ by the Tukey
test (p ≤ 0.05).
table 6. Parameters of the equation to determine the impact of Ipomoea densities and the soybean yield. The data represent the
average of all densities for I. grandifolia and I. purpurea species as
well as Pato Branco and Renascença environments. Pato Branco, 2011/2012, and Renascença, 2012/2013.
Equation parameters*
r² p
A D50 i
Soybean yield loss
(%) 89.23 3.45 25.86 98.47 < 0.01
*Means with the same letter in the column do not differ by the Tukey test (p ≤ 0.05).
table 7. Soybean yield loss caused by the interference of 2 Ipomoea species and evaluated on 2 environments. The data represent the
average of all Ipomoea densities. Pato Branco, 2011/2012, and
Renascença, 2012/2013.
species soybean yield loss (%)
Pato branco renascença
I. purpurea 51.49 a* 57.76 a
of weeds per area. However, at high weed densities, resource limitation makes the crop yield independent of plant population (Radosevich et al. 2007). The difference between the estimated value of the maximum YL (Table 6 parameter) exceeds the value of maximum loss depicted in Figure 6d, due to the fact that the densities used in the research were not sufficient to explain the maximum YL observed (Trezzi et al. 2015).
The results demonstrate that Ipomoea weed density is the most important factor affecting the biometric variables, yield components and soybean yield. In contrast, the crop environment (place of the experiment) and Ipomoea species impacted these variables in a lower degree of magnitude.
This research highlights the importance of appropriate control of plants from Ipomoea species, especially on modern soybean cultivars. Weed management practices to prevent the emergence of plants of these species in the off-season periods are also very important. Winter plants such as rye (Secale cereale L.) and radish (Raphanus sativus L.) can reduce the emergence of I. grandifolia
(Bittencourt et al. 2013). Crop rotation allows the use
of herbicides with an alternative mechanism of action, avoiding the evolution of herbicide resistant weeds.
cONcLUsION
The impact of the Ipomoea densities is more important than the environment and species. One Ipomoea plant∙m−2 can reduce the soybean yield by approximately 26%. The impact in soybean development is more intensive in Renascença than Pato Branco environment. The negative impact of
Ipomoea purpurea on soybean growth and yield is greater than Ipomoea grandifolia.
AcKNOWLEDGEMENts
The authors are indebted to the Coordination for the Improvement of Higher Education Personnel (CAPES) and the National Council for Scientific and Technological Development (CNPq), for scholarships, as well as to UTFPR, for the infrastructure.
rEFErENcEs
Bittencourt, H. H., Lovato, P. E., Comin, J. J., Lana, M. A., Altieri, M. A., Costa, M. D. and Gomes, J. C. (2013). Effect of winter cover crop biomass on summer weed emergence and biomass production. Journal of Plant Protection Research, 53, 248-252. http://dx.doi. org/10.2478/jppr-2013-0037.
Cousens, R. (1985). An empirical model relating crop yield to weed and crop density and a statistical comparison with other models. Journal of Agricultural Science, 105, 513-521. http://dx.doi. org/10.1017/S0021859600059396.
Das, T. K., Paul, A. K. and Yaduraju, N. T. (2014). Density-effect and economic threshold of purple nutsedge (Cyperus rotundus) in soybean. Journal of Pest Science, 87, 211-220. http://dx.doi. org/10.1007/s10340-013-0536-4.
Dodamani, B. M. and Das, T. K. (2013). Density and nitrogen effects on interference and economic threshold of common lambsquarters in wheat. Journal of Pest Science, 86, 611-619. http://dx.doi.org/ 10.1007/s10340-013-0478-x.
Empresa Brasileira de Pesquisa e Agropecuária (1997). Centro Nacional de Pesquisa Tecnológica em Informática para a Agricultura. Ambiente de software NTIA, versão 4.2.2: manual do usuário - ferramental estatístico. Campinas: Embrapa/CNPTIA.
Green-Tracewicz, E., Page, E. R. and Swanton, C. J. (2011). Shade avoidance in soybean reduces branching and increases plant-to-plant variability in biomass and yield per plant-to-plant. Weed Science, 59, 43-49. http://dx.doi.org/10.1614/WS-D-10-00081.1.
Gundel, P. E., Pierik, R., Mommer, L. and Ballaré, C. L. (2014). Competing neighbors: light perception and root function. Oecologia, 176, 1-10. http://dx.doi.org/10.1007/ s00442-014-2983-x.
Hazra, D., Das, T. K. and Yaduraju, N. T. (2011). Interference and economic threshold of horse purslane (Trianthema
portulacastrum) in soybean cultivation in northern India.
Hugo, E., Morey, L., Saayman-Du, A. E. J. and Reinhardt, C. F. (2014). Critical periods of weed control for naked crabgrass (Digitaria nuda), a grass weed in corn in South Africa. Weed Science, 62, 647-656. http://dx.doi.org/10.1614/ WS-D-13-00152.1.
Kiaer, L. P., Skovaard, I. M. and Ostergard, H. (2012). Effects of inter-varietal diversity, biotic stresses and environmental productivity on grain yield of spring barley variety mixtures. Euphytica, 185, 123-138. http://dx.doi.org/10.1007/s10681-012-0640-1.
Lorenzi, H. (2006). Manual de identificação e controle de plantas daninhas. Nova Odessa: Plantarum.
McDonald, J. A. and Mabry, T. J. (1992). Phylogenetic systematics of New World Ipomoea (Convolvulaceae) based on chloroplast DNA restriction site variation. Plant Systematics and Evolution, 180, 243-259. http://dx.doi.org/10.1007/BF00941155.
Moura, A. L. O. and Morim, M. P. (2015). Convolvulaceae em remanescentes de Floresta Ombrófila Densa, Rio de Janeiro, Brasil. Rodriguésia, 66, 779-805. http://dx.doi. org/10.1590/2175-7860201566309.
Norsworthy, J. K. and Oliver, L. R. (2002). Pitted morning glory interference in drill-seeded glyphosate-resistant s o y b e a n . We e d S c i e n c e , 5 0 , 2 6 - 3 3 . h t t p : / /d x .d o i . org/10.1614/0043-1745(2002)050[0026:PMIIDS]2.0.CO;2.
Oerke, E. C. (2006). Crop losses to pests. Journal of Agricultural Science, 144, 31-43. http://dx.doi.org/10.1017/ S0021859605005708.
Pazuch, D., Trezzi, M. M., Diesel, F., Barancelli, M. V. J., Batistel, S. C. and Pasini, R. (2015). Superação de dormência em sementes de três espécies de Ipomoea. Ciência Rural, 45, 192-199. http:// dx.doi.org/10.1590/0103-8478cr20120665.
Pitelli, R. A. (1985). Interferências de plantas daninhas em culturas agrícolas. Informe Agropecuário, 11, 16-27.
Radosevich, S. R., Holt, J. S. and Ghersa, C. M. (2007). Ecology of weeds and invasive plants: relationship to agriculture and natural resource management. New York: Wiley.
Rizzardi, M. A., Fleck, N. G. and Agostinetto, D. (2003). Nível de dano econômico como critério para controle de picão-preto em soja. Planta Daninha, 21, 273-282. https://dx.doi.org/10.1590/ S0100-83582003000200013.
Ruberti, I., Sessa, G., Ciolfi, A., Possenti, M., Carabelli, M. and Morelli, G. (2012). Plant adaptation to dynamically changing environment: The shade avoidance response. Biotechnology Advances, 30, 1047-1058. http://dx.doi.org/10.1016/j.biotechadv.2011.08.014.
Silva, D. R. O., Vargas, L., Agostinetto, D. and Mariani, F. (2014). Glyphosate-resistant hairy fleabane competition in RR soybean. Bragantia, 73, 451-457. http://dx.doi.org/10.1590/1678-4499.0200.
Tanveer, A., Javaid, M. M., Irfan, M., Khaliq, A. and Yaseen, M. (2015). Yield losses in chickpea with varying densities of dragon spurge (Euphorbia dracunculoides). Weed Science, 63, 522-528. http://dx.doi.org/10.1614/WS-D-13-00049.1.
Tedesco, M. J., Gianello, C., Anghinoni, I., Bissani, C. A., Camargo, F. A. O. and Wiethölter, S. (2004). Manual de adubação e calagem para os Estados do Rio Grande do Sul e Santa Catarina. Porto Alegre: Evangraf.
Trezzi, M. M., Vidal, R. A., Patel, F., Miotto Junior, E., Debastiani, F., Balbinot Junior, A. A. and Mosquen, R. (2015). Impact of Conyza
bonariensis density and establishment period on soyabean
grain yield, yield components and economic threshold. Weed Research, 55, 34-41. http://dx.doi.org/10.1111/wre.12125.
Vidal, R. A., Trezzi, M. M., Kozlowski, L. A., Prates, M. V. B., Cieslik, L. F. and Merotto Junior, A. (2012). Initialism as a mechanism of weed interference: can a crop plant be blinded? Planta Daninha, 30, 469-475. http://dx.doi.org/10.1590/S0100-83582012000300002.