Weight and morphometric growth of different strains of tilapia
(
Oreochromis sp
)
Ivan Bezerra Allaman1, Rafael Vilhena Reis Neto2, Rilke Tadeu Fonseca de Freitas2, Thiago Archangelo Freato3, Aline de Assis Lago2, Adriano Carvalho Costa2, Renato Ribeiro de Lima4
1 Departamento de Ciências Exatas e Tecnológicas – Universidade Estadual de Santa Cruz, Ilhéus/BA, Brazil. 2 Departamento de Zootecnia – Universidade Federal de Lavras, Lavras/MG, Brazil.
3 Empresa de Pesquisa Agropecuária de Minas Gerais – EPAMIG
4 Departamento de Ciências Exatas – Universidade Federal de Lavras, Lavras/MG, Brazil.
ABSTRACT - The objective of this study was to evaluate the morphometric growth and weight gain of strains of tilapia (Thai, Red, UFLA and Commercial) by nonlinear models. Initially, 500 male fingerlings of each strain, at 85 (Red and UFLA) and 86 (Thai and Commercial) days of age, were stocked separately in raceways with 56 m3. Twenty fish of each
strain were randomly sampled, weighed and measured monthly. Five nonlinear models (Brody, von Bertalanffy, Gompertz, logistic and exponential) were tested, choosing one that best fit to the data. The variables studied were: weight, standard length (SL), head length (HL), height 1 (H1), height 2 (H2), height 3 (H3), first distance (D1), second distance (D2), first width (W1), second width (W2) and third width (W3). The exponential model had the best fit to weight and morphometric data, with the exception of W2, in which the best fitted model was von Bertalanffy. The convergence of the exponential model to data indicates that the cultivation period studied was not enough for the strains to reach maturity weight. The UFLA strain presented the lowest value for parameter “a” (initial weight estimate), 8.71 g, and the highest for parameter k (specific growth rate), 0.0127, when compared with other evaluated strains. However, the highest k of UFLA was not enough to overcome the final weight observed for the Commercial strain (603.1 g), which was higher than all other strains. Regarding the morphometric measurements, the UFLA strain also had the highest k for the variables SL, HL, HH, H1, H2, H3 and D2, and similar k to Commercial and Thai strains for the variables D1 and W3 respectively. The strains differ as to weight gain and morphometric growth.
Key Words: absolute growth rate, aquaculture, nonlinear models, relative growth rate
Introduction
Toughness, disease resistance, meat quality and, mainly fast growth are characteristics that make tilapia one of the most cultivated fish species in the world (Lahav & Ra’nan, 1997). In Brazil, the culture of three strains of tilapia is practiced in the whole Brazilian territory; each one with peculiarities that value it in the consumer market. The Thai strain was one of the first to be introduced in Brazil, standing out for its toughness and good performance; the genetically improved farmed tilapia (GIFT), developed in the Philippines and currently improved by Universidade Estadual de Maringá, stands out for its high performance; the red tilapia, produced by some companies, stands out for being more attractive to the eyes of the consumer and its clear skin.
Studies of weight development are important because they can generate more knowledge of productive efficiency (Fitzhugh Jr., 1976), thus contributing to increase the profit of producers.
The morphometric study is not recent, and the interest in searching the forms in fish is particularly important due to the fact that some morphometric measures are related to the weight of the carcass and the fillet (Santos, 2004; Gonçalves et al., 2001). It is also essential for the choice of fishing equipment, storage, processing in the industry and meat yield (Contreras-Guzmán, 1994).
There are several models in the literature to describe both plant and animal growth. Amongst them, the exponential (Malthus, 1798), logistic (Nelder, 1961), Gompertz (Gompertz, 1825), Brody (Brody, 1945) and von Bertalanffy (Bertalanffy, 1957) models are the most used.
Although the tilapia strains produced in Brazil have distinct market niches, the differentiated growth standards makes comparisons inevitable, and several works have already been carried out in this sense. Several studies analyzed the relation between the characteristics of the carcass with the morphometric measures of the fish, but few evaluated the weight growth and the forms of the body throughout the animal development.
© 2013 Sociedade Brasileira de Zootecnia ISSN 1806-9290
www.sbz.org.br R. Bras. Zootec., v.42, n.5, p.305-311, 2013
R. Bras. Zootec., v.42, n.5, p.305-311, 2013 The objective of this study is to evaluate the weight and
morphometric growth of tilapia strains (Thai, Red, UFLA and Commercial) by nonlinear models.
Material and Methods
The experiment was carried out at the Fish Growth Station of Universidade Federal de Lavras (UFLA), in Lavras, MG, Brazil, for a period comprising the fall (from March to May), winter (from June to August) and spring (from September to the beginning of December) of 2012.
This study evaluated the following strains of tilapia: Chitralada (Thai); a genetically improved commercial strain derived from the GIFT (Commercial, obtained from the International Center for Living Aquatic Resources Management - ICLARM); a red tilapia strain; and Nile tilapia, kept at the fish growing department of UFLA since 1970.
Initially, 500 fingerlings from a single sex male population (treated with 17α-methyltestosterone) were cultivated separately in four raceways with 56 m³ and fed a commercial feed with nutritional levels in accordance with the life phase of the fish (42%, 32% and 28% protein for the spawning phase, 10-100 g; for the growth phase, 100-300 g; and for the finishing phase, 300-600 g, respectively) twice daily. The daily amount was supplied in accordance with the biomass of the tanks, varying from 7% in the first week to 4% in the last one. The densities of initial and final storage (disregarding the mortality observed in the period) were, respectively, 8.92 and 5.36 fish/m3.
Random samples of 20 fish of each strain were removed monthly; after 48 hours of fasting the fish were slaughtered by sectioning the bone marrow followed by bleeding and weighing with the aid of a semi-analytical balance scale graduated in grams (g).
During the experimental period the levels of dissolved oxygen (mg/L) and water temperature (ºC) of the culture raceways were monitored daily (early morning and late afternoon).
The measures evaluated were: standard length (SL, cm), head length (HL, mm), head height (HH, mm), height measured before the 1st ray of the dorsal fin (H1, mm), height measured before the 1st ray of the anal fin (H2, mm), height measured in the lower circumference of the peduncle (H3, mm), distance from the extremity of the operculum to the 1st ray of the anal fin (D1, mm), distance from the 1st ray of the anal fin to lower circumference of the peduncle (D2, mm), width of the body measured before the 1st ray of the dorsal fin (W1, mm), width of the body measured before the 1st ray of the anal fin (W2, mm) and width of
the body measured before the foremost circumference of the peduncle (W3, mm). The experimental design was completely randomized, and each fish was considered an experimental unit. In view of the suspicion of covariance between the experimental units, the statistics of Durbin-Watson was used to ensure that the temporal dependence between the experimental units be zero.
The estimate of the growth parameters of the strain was given by nonlinear regression analyses of the weight and body measures according to the age, testing the Brody, Gompertz, von Bertalanffy, logistic and exponential growth models (Table 1). The functions were evaluated and chosen by the adjusted determination coefficient (adjusted R²) and mean square error (QME). The adjusted determination coefficient was calculated as:,
2
2 ( ) (1 )
1 ajusted
n i R
R
n p
where R2 = determination coefficient; n = number of
comments used to adjust the curve; p = number of parameters in the function, including the intercept; i = intercept adjustment, which was 1 in case of function intercept and 0 if not.
The parameters A and k of the models presented in Table 1 have important biological interpretations. The parameter A represents the superior asymptotic weight or adult weight of the animal and parameter k represents the maturity rate, i.e., the relation between the relative growth rate and the adult weight of the animal. The higher the k value, the most precocious is the animal. The parameter “a” of the exponential model represents the initial weight of the animal.
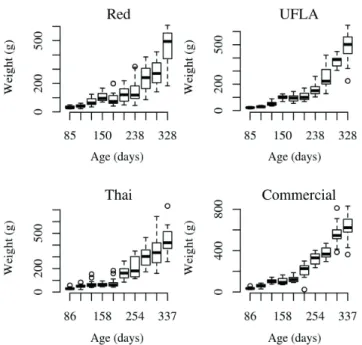
The data were adjusted by the weighted least squares method inversely proportional to the variance of different ages of different strains, which increased according to the advance of the age (Figure 1). In the case of the body measures, the use of the weighting for adjustment of models was not necessary, since the variances did not increase as the age advanced.
The procedure nls of the Stats package, version 2.10.0 (R Core Team, 2010) was used for adjustment of the nonlinear models. With this function, the argument
Table 1 - Nonlinear models normally used to describe animal growth and to determine growth rate
Model Equation Growth rate (g/day)
Exponential t
k
y a e
-Brody von Bertalanffy Gompertz Logistic
y = A(1 – Be–kt)
y = A(1 – Be–kt)3
y = Ae– Be –kt
y = A(1 + Be–kt)–1
ABke–kt 3ABke–kt(1 – Be–kt)2
ABke–kte– Be –kt
“weights” was used so that the function could perform the adjustment by the weighed least squares by the inverse of the variance. The default Gauss-Newton algorithm was used by the nls function.
The likelihood-ratio test (TRV) was used to verify the equality of the parameters between the different models to determine if only one curve would be adequate to describe the weight (Table 2) and morphometric growth, regardless of strain, as suggested by Regazzi & Silva (2004). The statistics of the TRV test is given by:
2
2 2
ˆ ˆ
n
L
where n = the number of observations; 2
ˆ
= the estimate of maximum likelihood of σ2 with no restriction in the
parametric space; and 2
ˆ
= the estimate of maximum
likelihood of σ2 with the linear restrictions in accordance
with the following assumptions: H01 – restricted parameter
space by AThai = AUFLA = ACommercial = ARed; H02 – restricted
parameter space by BThai = BUFLA = BCommercial = BRed; and
H03 – restricted parameter space by kThai = kUFLA = kCommercial
= kRed.
The growth accumulated in each season of the year was evaluated by the Area Under the Curve technique (AUC). The seasons evaluated were fall, winter and spring, which comprised the ages of 85 to 150, 150 to 238 and 238 to 328 days, respectively. The AUC variable was determined according to Shaner & Finney (1977), as
1
1
1
( ) /2
n
i i i i
i
Y Y X X
where Yi = weight or metric measure of the i-th observation;
Xi = age (days) of i-th observation; n = total observations. In view of the heterogeneity of the variances detected by means of Levene’s test of car package (version 2.0-10) (Fox & Weisberg, 2010) and because the Box-Cox Transformation (Box & Cox, 1964) did not overcome this problem, thus making the variance analysis impossible, a choice was made for the general linear models. With this method, the analysis of deviance (ANODEV) was used with the aid of the function GLM of the package Stats (version 2.10.0) (R Core Team, 2010) in an 4 × 3 factorial arrangement (strains × seasons of the year), in accordance with the following systematic part of the model:
yijk = μ + Li + Ej + (LE)ij
where yijk = the value of the area under the curve referring to strain i in season j in repetition k; μ = the overall mean;
Li= the effect of strain i, with i = 1, 2, 3, 4; Ej = the effect of the season of year j, with j = 1, 2, 3; and (LE)ij= the effect of the interaction between factors L and E.
Inverse Gamma Distribution was used to model the data. The comparison test of the means of variable AUC was carried out by the function glht of the package Multcomp (version 1.2-10) (Hothorn et al., 2008).
The data relating to the initial and final average weights of the strains were subjected to variance analysis; means were compared by the Scott Knott multiple comparisons test of the ScottKnott package version 1.1.0 (Jelihovschi et al., 2010), adopting α = 0.05. The statistical model used was:
yij = μ + Li +
ε
ikwhere yij = observation relating to the i-th strain in the k-th repetition; μ = overall mean; Li = effect of the i-th level of the strain L, with i = 1, 2, 3, 4;
ε
ik = the experimental error inherent to all the observationsε
ik~ N
(0,σ2).All analyses were performed on software R (R Core Team, 2010).
Results and Discussion
The minimum, maximum and average amount of oxygen dissolved in each tank for each strain were respectively: Thai (1.5; 8.14 and 3.80); Red (1.88; 6.57; 3.64); Commercial (1.78; 6.00; 3.62); and UFLA (1.02; 7.08 and 3.67). As for temperature, the minimum, maximum and average values were respectively: Thai (12.8; 28.00 and 22.07); Red (12.40; 29.70; 21.39); Commercial (12.10; 28.20; 21.51); UFLA (12.60; 27.90 and 21.67).
The von Bertalanffy model (QMEThai = 6.48, R2 =
0.8374; QMEUFLA = 5.26, R2 = 0.8567; QMECommercial = 7.38;
R. Bras. Zootec., v.42, n.5, p.305-311, 2013 R2 = 0.8594) was, among the sigmoid models, the only
one that provided adequate convergence and adjustment, as compared with the exponential model (QMEThai = 7.19;
R2 = 0.8187; QME
UFLA = 6.44; R2 = 0.8237; QMECommercial
= 8.57; R2 = 0.8292), with the metric measurement W2
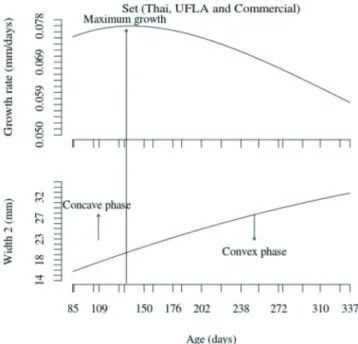
(Figure 2), and only with the UFLA, Thai and Commercial strains. There is no convergence for the Brody, logistic and Gompertz models for the other metric measurements and body weight. For the remaining variables such as weight, SL, HL, HH, H1, H2, H3, D1, D2, W1 and W3, the exponential model was the only one that adequately fit to the data for all the evaluated strains (Figure 3).
Evaluating the growth of two strains of tilapia of up to 160 days of age, Santos et al. (2008) pointed the exponential model as an efficient tool when used for short evaluation periods, especially to estimate the parameters of estimated initial weight and specific growth rate. Santos et al. (2007) used body weight, instead of the age, to evaluate the growth of the morphometric measures of the Commercial and Thai strains; the functions of Gompertz and von Bertalanffy were the best models obtained. Gomiero et al. (2009) also used body weight to evaluate the morphometric growth of piracanjuba fish Brycon orbignyanus and found that the functions of Brody and von Bertalanffy were the best models.
For the area under the curve, the Commercial strain obtained the highest growth (P<0.05) in all seasons of the
year for body weight and for all metric measurements, with exception of HH, D1 and W1, where the Commercial strain was similar to UFLA during spring (Table 3). The UFLA, Thai and Commercial strains grew 19% more than Red, from the fall to winter, as regards weight gain. However, from winter to spring, the weight gain of UFLA was 24% higher than the Thai and Commercial strains, and 16% higher than Red.
At the end of the experiment, the Commercial strain obtained higher average weight (P<0.05) than the other strains studied (Table 4). The average initial weight of UFLA was lower (P<0.05), as compared with the other strains. However, the average final weight was similar (P>0.05) to Red and Thai.
Dan & Little (2000) observed higher (P<0.05) average weight gain for the GIFT tilapia strain cultivated in fish cages, in comparison with the Thai and Vietnamese tilapia, during a period of 184 days.
The results of a comparative study between two strains of Atlantic salmon, one from a genetic selection program for growth and another from the natural media, revealed superiority (P<0.05) of the strain selected for weight gain, body composition and feed efficiency, indicating the efficiency of the genetic improvement of this species (Wolters et al., 2009). On the other hand, in a study of diallel crosses between varieties of common carp, the hybridization of varieties improved with strains
Figure 2 - Growth rates and curves of the measure of width 2 estimated by the von Bertalanffy model for Thai, UFLA and Commercial strains, throughout the development.
Table 2 - Average weight in grams of each strain at each age
Age (days) Strains Age (days) Strains
UFLA Red Commercial Thai
85 22.45(4.69) 32.61(8.92) 86 35.45(9.13) 30.09(9.19)
104 28.59(6.15) 41.21(10.68) 109 58.70(15.92) 49.70(14.95)
127 51.65(14.64) 70.75(28.14) 132 106.55(22.25) 66.65(28.20)
150 98.75(14.88) 105.50(32.01) 158 103.40(31.35) 64.05(15.33)
176 92.15(25.28) 88.80(46.60) 184 124.05(28.87) 74.25(37.55)
202 106.60(27.08) 121.80(50.35) 220 209.60(66.59) 162.05(49.47)
238 159.90(43.36) 144.55(78.76) 254 323.45(54.04) 211.10(85.97)
272 248.75(78.38) 232.95(82.59) 276 378.60(54.01) 296.65(74.95)
294 375.50(40.34) 271.55(79.31) 310 560.00(92.05) 349.20(123.79)
328 486.75(104.54) 462.15(118.20) 337 624.70(111.70) 440.10(111.43)
Numbers in parentheses indicate standard deviation.
cultivated in the experimental area was a good alternative to obtain fish with good resistance to diseases, and growth, demonstrating the importance of the adaptation of the species to fish culture (Nielsen et al., 2010).
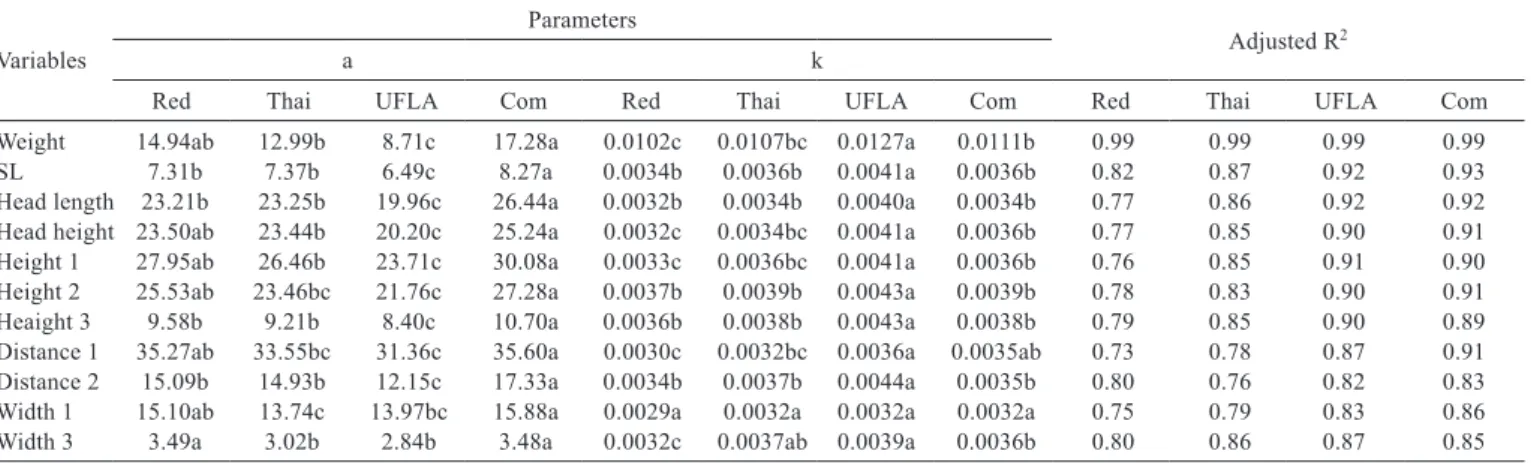
There were differences (P<0.05) between the strains as to the parameters initial weight and specific growth rate of the exponential model for body weight, and for all metric measurements, with the exception of W1, for which there were no differences (P>0.05) between the strains (Table 5). The strain UFLA presented higher specific growth rate (P<0.01) for body weight and for all
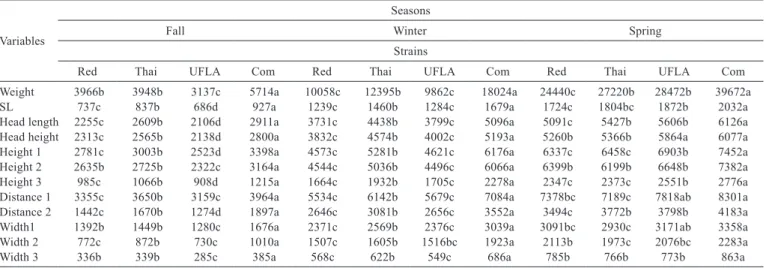
Table 3 - Means of the area under the curve for body measures of Red, Thai, UFLA and Commercial (Com) strains in each season (fall, winter and spring)
Variables
Seasons
Fall Winter Spring
Strains
Red Thai UFLA Com Red Thai UFLA Com Red Thai UFLA Com
Weight 3966b 3948b 3137c 5714a 10058c 12395b 9862c 18024a 24440c 27220b 28472b 39672a
SL 737c 837b 686d 927a 1239c 1460b 1284c 1679a 1724c 1804bc 1872b 2032a
Head length 2255c 2609b 2106d 2911a 3731c 4438b 3799c 5096a 5091c 5427b 5606b 6126a Head height 2313c 2565b 2138d 2800a 3832c 4574b 4002c 5193a 5260b 5366b 5864a 6077a Height 1 2781c 3003b 2523d 3398a 4573c 5281b 4621c 6176a 6337c 6458c 6903b 7452a Height 2 2635b 2725b 2322c 3164a 4544c 5036b 4496c 6066a 6399b 6199b 6648b 7382a Height 3 985c 1066b 908d 1215a 1664c 1932b 1705c 2278a 2347c 2373c 2551b 2776a Distance 1 3355c 3650b 3159c 3964a 5534c 6142b 5679c 7084a 7378bc 7189c 7818ab 8301a Distance 2 1442c 1670b 1274d 1897a 2646c 3081b 2656c 3552a 3494c 3772b 3798b 4183a Width1 1392b 1449b 1280c 1676a 2371c 2569b 2376c 3039a 3091bc 2930c 3171ab 3358a Width 2 772c 872b 730c 1010a 1507c 1605b 1516bc 1923a 2113b 1973c 2076bc 2283a
Width 3 336b 339b 285c 385a 568c 622b 549c 686a 785b 766b 773b 863a
Means followed by a different letter in the row within each season significantly differ (P<0.01) by the Z test. SL - standard length.
Table 4 - Initial and final ages, and initial and final average weight of Red, UFLA, Commercial and Thai strains, with their respective coefficients of variation (CV)
Strains Initial Final
Age (days) Weight (g) CV (%) Age (days) Weight (g) CV (%)
Red 85 32.6a 27.4 328 462.2b 25.6
UFLA 85 22.5b 20.9 328 486.8b 21.5
Commercial 86 35.5a 25.7 337 603.1a 18.5
Thai 86 30.1a 30.5 337 409.8b 27.2
Means followed by different lowercase letters in the same column significantly differ (P<0.05) by the Scott-Knott test.
R. Bras. Zootec., v.42, n.5, p.305-311, 2013 similar to Thai. In relation to W2, there were no significant
differences between Thai, UFLA and Commercial as to the parameters A, B and k (Table 6).
The fact that UFLA was not under genetic selection, being cultivated at the place of the experiment during many years, suggests that its best specific growth rate is due to its better adaptation to the environment conditions.
Beniga & Circa (1997) compared the growth of three pure strain of Nile tilapia (Oreochromis niloticus) with a local Philippine strain in net cages and observed that the three pure strains presented better growth rate, but lower survival rates than the local strain. Despite the lower survival rate, the results of the economic analysis revealed productivity and financial gains with the pure strain.
Comparing the growth rates of the Thai and the same Commercial strain studied in this experiment, but cultivated in net cages and weighting up to 200 g, Santos et al. (2008) found a significant difference between the strains, wherein Commercial (0.025) was superior to Thai (0.017). Osure & Phelps (2006) observed that the culture and the improvement of the local strain were more advantageous in relation to survival and initial growth, than the introduction of strain imported from other regions.
Of the eleven morphometric measures evaluated, nine presented growth standard similar to the strains Red and Thai. This fact is probably due to a genetic relationship between the strains, as Red is a hybrid from the crossing of Nile tilapias and other species of tilapia (Oreochromis mossambicus or Oreochromis aureus) (El-Sayed, 2006). Another interesting result of this study was the fact that UFLA presented a growth standard different from the other strains, also in 9 of the 11 morphometric measures. The thirty-one years of geographic isolation provided the
strain UFLA with a particular and inherent morphometric characteristic, which makes it unique and distinct from the other tilapia ancestries.
The parameters of the exponential model obtained in this work suggest that the initial performance of the fingerlings is an important factor for the attainment of higher weights at the end of the period of culture, because the higher growth rate of UFLA, which presented the lowest observed and estimated initial weight, was not enough to reach the final weight of the Commercial strain, which presented the highest observed and estimated initial weight. On the other hand, the low growth rate of Red was one of the main reasons why it could not keep the difference of weight presented at the beginning of the culture period, as compared with UFLA.
This study demonstrated that the UFLA strain can be a good option for culture in regions whose climatic conditions are similar to the conditions of the south region of Minas Gerais. The Commercial strain presented excellent results due to the many years under genetic improvement. It is worth mentioning that although the UFLA strain presented excellent results, it is not yet part of genetic improvement program, but there are projects to include it in an improvement program.
Variables
Parameters
Adjusted R2
a k
Red Thai UFLA Com Red Thai UFLA Com Red Thai UFLA Com
Weight 14.94ab 12.99b 8.71c 17.28a 0.0102c 0.0107bc 0.0127a 0.0111b 0.99 0.99 0.99 0.99 SL 7.31b 7.37b 6.49c 8.27a 0.0034b 0.0036b 0.0041a 0.0036b 0.82 0.87 0.92 0.93 Head length 23.21b 23.25b 19.96c 26.44a 0.0032b 0.0034b 0.0040a 0.0034b 0.77 0.86 0.92 0.92 Head height 23.50ab 23.44b 20.20c 25.24a 0.0032c 0.0034bc 0.0041a 0.0036b 0.77 0.85 0.90 0.91 Height 1 27.95ab 26.46b 23.71c 30.08a 0.0033c 0.0036bc 0.0041a 0.0036b 0.76 0.85 0.91 0.90 Height 2 25.53ab 23.46bc 21.76c 27.28a 0.0037b 0.0039b 0.0043a 0.0039b 0.78 0.83 0.90 0.91 Heaight 3 9.58b 9.21b 8.40c 10.70a 0.0036b 0.0038b 0.0043a 0.0038b 0.79 0.85 0.90 0.89 Distance 1 35.27ab 33.55bc 31.36c 35.60a 0.0030c 0.0032bc 0.0036a 0.0035ab 0.73 0.78 0.87 0.91 Distance 2 15.09b 14.93b 12.15c 17.33a 0.0034b 0.0037b 0.0044a 0.0035b 0.80 0.76 0.82 0.83 Width 1 15.10ab 13.74c 13.97bc 15.88a 0.0029a 0.0032a 0.0032a 0.0032a 0.75 0.79 0.83 0.86 Width 3 3.49a 3.02b 2.84b 3.48a 0.0032c 0.0037ab 0.0039a 0.0036b 0.80 0.86 0.87 0.85
Table 5 - Equality test of the parameters of the exponential model for Red, Thai, UFLA and Commercial (Com) strains, for the growth variables
Estimates with different letters in the same row differ (P<0.05) according to the likelihood test. SL - standard length.
Parameters: a - initial weight; k - specific growth rate.
Table 6 - Equality test estimators of the von Bertalanffy model for Thai, UFLA and Commercial strains, for the variable width 2
Strains Parameters Adjusted R2
ANS BNS kNS
Thai 50.10 0.575 0.0032 0.84
UFLA 36.08 0.579 0.0051 0.86
Commercial 48.73 0.562 0.0039 0.86
Conclusions
The tilapia strains studied differed as to the growth speed of body weight and morphometric measures; UFLA presented the fastest growth both as regards weight and morphometric measures, followed by the Commercial, Thai and Red strains.
Acknowledgements
The authors thank Fundação de Amparo à Pesquisa do Estado de Minas Gerais (FAPEMIG) for financing the project, and Conselho Nacional de Desenvolvimento Científico e Tecnológico (CNPq) for granting the fellowships.
References
BENIGA, Z.; CIRCA, A. Growth performance evaluation of genetically improved Nile tilapia (Oreochromis niloticus L.) in floating cages in Lake Sebu, South Cotabo, Philippines. In: INTERNATIONAL SYMPOSIUM ON TILAPIA IN AQUACULTURE, 4., 1997, Chicago. Proceedings... Chicago: Tilapia Aquaculture, 1997. p.116-128. BERTALANFFY, L.V. Quantitative laws in metabolism and growth.
The Quartely Review of Biology, v.32, p.217-230, 1957. BOX, G.E.P.; COX, D.R. An analysis of tranformations. Journal of
the Royal Statistical Society, v.26, p.211-252, 1964.
BRODY, S. Bioenergetcs and growth: with special reference to the efficiency complex of domestic animals. New York: Hafner, 1945. 1023p.
CONTRERAS-GUZMÁN, E. Bioquímica de pescados e derivados. Jaboticabal: FUNEP, 1994. 409p.
DAN, N.; LITTLE, D. The culture performance of monosex and mixed-sex new-season and overwintered fry in the three strains of Nile tilapia (Oreochromis niloticus) in northern Vietnam. Aquaculture, v.184, n.3/4, p.221-231, 2000.
EL-SAYED, A. Tilapia culture. London: CABI, 2006. 277p. FITZHUGH JUNIOR, H. Analysis of growth curves and strategies for
altering their shapes. Journal of Animal Science, v.42, p.1036-1051, 1976.
FOX, J.; WEISBERG, S. An R companion to applied regression. 2.ed. Sage: Thousand Oaks, 2010. 472p.
GOMIERO, J.S.G.; FREITAS, R.T.F.; SANTOS, V.B. et al. Curvas de crescimento morfométrico de piracanjuba (Brycon orbignyanus). Ciência e Agrotecnologia, v.33, n.3, p.882-889, 2009.
GOMPERTZ, B. On the nature of the function expressive of the law of human mortality. Philosophical Transactions of the Royal Society of London, v.36, p.513-585, 1825.
GONÇALVES, T.M.; ALMEIDA, A.J.L.; OLIVEIRA, H.N. Avaliação de características de carcaças de tilápias do Nilo
(Oreochromis niloticus). In: REUNIÃO ANUAL DA SOCIEDADE
BRASILEIRA DE ZOOTECNIA, 38., 2001, Piracicaba. Anais... Piracicaba: SBZ, 2001. p.1450-1451.
HOTHORN, T.; BRETZ, F.; WESTFALL, P. Simultaneous inference in general parametric models. Biometrical Journal, v.50, n.3, p.346-363, 2008.
JELIHOVSCHI, E.; FARIA, J.C.; OLIVEIRA, S. [2012]. The ScottKnott Clustering Algoritm. Available at: <http://cran.r project.org/web/packages/ScottKnott/ScottKnott.pdf> Accessed on: Dec. 10, 2010.
LAHAV, E.; RA’NAN, Z. Salinity tolerance of genetically produced tilapia (Oreochromis) hybrids. Israel Journal of Aquaculture, v.49, n.3, p.160-165, 1997.
MALTHUS, T. An essay on the principle of population. London: J. Johnson, 1798. 126p.
NELDER, J.A. The fitting of a generalization of the logistic curve. Biometrics, v.17, p.89-94, 1961.
NIELSEN, H.; ØDEGAR, J.; OLESEN, I. et al. Genetic analysis of common carp (Cyprinus carpio) strains: I., genetic parameters and heterosis for growth traits and survival. Aquaculture, v.304, n.1/4, p.14-21, 2010.
OSURE, G.; PHELPS, R. Evaluation of reproductive performance and early growth of four strains of Nile tilapia (Oreochromis niloticus, L) with different histories of domestication. Aquaculture, v.253, n.1/4, p.485-494, 2006.
R DEVELOPMENT CORE TEAM. R: a language and environment for statistical computing. Vienna: R Foundation for Statistical Computing, 2010. Available at: <http://www.R-project.org>. Accessed on: Nov. 10, 2010.
REGAZZI, A.; SILVA, C. Teste para verificar a igualdade de parâmetros e a identidade de modelos de regressão não-linear: I. Dados no delineamento inteiramente casualisado. Revista de Matemática e Estatística, v.22, n.3, p.33-35, 2004.
SANTOS, V.B. Crescimento morfométrico e alométrico de linhagens de Tilápia (Oreochromis niloticus). 2004. 86f. Dissertação (Mestrado em Zootecnia) - Universidade Federal de Lavras, Lavras.
SANTOS, V.B.; FREITAS, R.T.F.; SILVA, F.F. et al. Avaliação de curvas de crescimento morfométrico de linhagens de tilápia do Nilo (Oreochromis niloticus). Ciência e Agrotecnologia, v.31, n.5, p.1486-1492, 2007.
SANTOS, V.B.; YOSHIHARA, E.; FREITAS, R.T.F. et al. Exponential growth model of Nile tilapia (Oreochromis niloticus) strains considering heteroscedastic variance. Aquaculture, v.274, n.1, p.96-100, 2008.
SHANER, G.; FINNEY, R. The effects of nitrogen fertilization on the expression of slow-mildewing in knox wheat. Phytopathology, v.70, p.1183-1186, 1977.