Complex fringes around magnetite porphyroclasts: Growth and deformation history
Leonardo Lagoeiro
a,⁎
, Paola Ferreira Barbosa
a, Frank Fueten
baDepartamento de Geologia, Universidade Federal de Ouro Preto, Ouro Preto, MG 35400
–000, Brazil bDepartment of Earth Sciences, Brock University, St. Catharines, ON, Canada L2S 3A1
a b s t r a c t
a r t i c l e
i n f o
Article history: Received 28 April 2010
Received in revised form 17 June 2011 Accepted 30 June 2011
Available online 12 July 2011
Keywords: Strain shadow Fringe structure Quartz microstructure
Crystallographic preferred orientation Dynamic recrystallization
Deformed strain fringes in iron formation rocks show complex quartzfiber patterns that grew alongside magnetite porphyroclasts embedded in a matrix of quartz and iron oxides during coaxial to non-coaxial deformation. These rocks have been deformed by a combination of processes involving microfracturing, pressure solution and dislocation glide at temperatures of approximately 300 °C. Detailed microstructural observation and crystallographic analysis show that quartzfiber growth is not controlled by the crystal faces.
Quartzc-axis orientations offibrous quartz indicate that these grains initially grew with theirc-axes parallel to thefiber length. Late solid-state deformation of crystallizedfibers comprised dislocation glide along basal plane and subsequent recrystallization. This produces aggregates of recrystallized grains consisting of equant to elongated quartz grains with straight and orthogonal grain boundaries.
© 2011 Elsevier B.V. All rights reserved.
1. Introduction
Rigid objects such as magnetite porphyroclasts in a deforming matrix cause perturbations of the local stressfield andflow patterns
leading to the growth of polycrystalline material in strain shadows adjacent to their faces (Mügge, 1928; Pabst, 1931). New crystalline material formed on both sides of the rigid objects is known as pressure- or strain shadows or strain fringes (Pabst, 1931; Passchier and Trouw, 2005; Ramsay and Huber, 1983; White and Wilson, 1978). Strain fringes are crystalline aggregates, mostly symmetrically disposed at both sides of the porphyroclast, withfibrous (Bons and Jessell, 1997) grains (high length to width ratio) and sharp boundaries to the matrix. The whole microstructure, i.e., the central part of the porphyroclast and the two crystal fibers is also named a fringe structure (Koehn et al., 2000; 2001). Strain fringes have attracted the attention of many structural geologists because they are thought to have grown syn-kinematically (Durney and Ramsay, 1973) and parallel to the displacement path of their wall-rock boundaries as they moved apart. They can record the deformation history of the rocks. For that reason, their microstructures are mostly used in structural analysis for determination of the deformation path (coaxial and non-coaxial) and, therefore the sense of shear (e.g.Aerden, 1996; Elliot, 1972; Koehn et al., 2000; 2003; Zwart and Oele, 1966).
Previous work on strain fringes provided detailed descriptions of the internal microstructures of the fringes and resulted in a classification of the shape orientation of the fibers with respect to
the porphyroclast faces (Ramsay and Huber, 1983). However, there are few data on the crystallographic orientations of thefibers during growth (e.g. Spencer, 1991) and little discussion of deformation processes affecting the fringe. Important aspects of thefiber formation
such as the crystallographic orientation of thefibers during growth and the way thatfibers behave during the progressive deformation of the entire system, i.e. matrix and the fringe structures, have not been addressed in any study we are aware of. In order to understand the behavior of thefibers during growth in terms of the crystallographic orientation and the progressive deformation of thefibers as a rigid
body, we examined samples of rocks containing porphyroclasts of magnetite of varying sizes embedded in a matrix of a mix of quartz and iron oxide.
2. Sample location and geological settings
The samples came from iron formation rocks outcropping in the southeast of Brazil (Fig. 1). They are part of a volcanic–sedimentary sequence of paleoproterozoic age (2.5–1.8 Ga;Babinski et al., 1993;
Machado et al., 1996) located at the south boundary of the São
Francisco Craton (Alkmim and Marshak, 1998; Dorr, 1969). The entire region is known as the Iron Quadrangle due to the large occurrence of iron formation rocks in the region that corresponds to an area of approximately 7,000 km2.
The most pervasive structure in these rocks is a regional foliation (S1-foliation) resulting from an intense folding and transposition of the original sedimentary layering (S0). In the iron formation rocks the S1 foliation is parallel to the compositional banding (Sb), which consists of alternating layers composed of mixtures of iron and quartz minerals in a wide range of proportions. The deformation is localized
Tectonophysics 510 (2011) 186–194
⁎ Corresponding author. Tel.: +55 31 35591859; fax: +55 31 35591606. E-mail address:lagoeiro@terra.com.br(L. Lagoeiro).
0040-1951/$–see front matter © 2011 Elsevier B.V. All rights reserved. doi:10.1016/j.tecto.2011.06.027
Contents lists available atScienceDirect
Tectonophysics
mainly parallel to the compositional layering of the iron formation in a set of banding-parallel shear zones. The asymmetry of the outcrop structural elements such as hand-scale folds (“S”and“Z”shapes), S–C, S–C’pairs of foliation and strain shadows along sides of magnetite porphyroclasts, is indicative of a non-coaxial regime of progressive deformation. The overall shear sense of the sample is dextral. Structures related to subsequent deformation are less pervasive with minor interference on previously formed structures (S1/Sb foliation). Thus, all features studied in this paper are considered to be produced during the same strain geometry.
Although iron formation rocks are not suitable for metamorphic studies due to the lack of minerals indicative of metamorphic grade, the mineral suite found in adjacent country rocks including epidote and sericite, indicates a metamorphic grade not higher than greenschist facies. In addition, previous studies on microstructures and crystallographic textures in country rocks as well as iron rocks (Hippertt et al., 2001; Lagoeiro, 1998) in adjacent areas indicated that the deformation mechanisms at grain scale operative in those rocks are compatible with temperatures around 300 °C and that both quartz and to a lesser degree iron oxide were dissolved into solution during the deformation.
3. Methods of analysis
Mesoscopically the rocks are characterized by a well-defined
foliation in which dark layers of high concentration of magnetite and hematite alternate with quartz-rich layers. Crystals of magnetite of square to rectangular shapes and up to approximately 5 mm in diameter are embedded in a matrix of iron oxide and quartz. At crystal faces perpendicular to the foliation asymmetric strain shadows of quartz are developed. The elongated crystalfibers plunge consistently
down the dip direction of the foliation plane defining a strong mineral
lineation. The thin section samples were cut parallel to the mineral elongation, which correspond to the direction of the X-axis, and perpendicular to the foliation (compositional layering), the XZ section of the finite strain ellipsoid. All observations were made in XZ sections.
The analyses of microstructures and quartzc-axis orientations of the strain fringes were performed in an optical microscope with an aid of a universal stage (u-stage;Sarantschina, 1963; and others) as well as with a digital video camera and a rotating polarizer stage (Fueten, 1997) mounted on the microscope. Regular thin sections containing clasts and fringes were sampled with the rotating polarizer stage under plane and crossed polarized light. Due to the size of the clasts and fringes, multiple sample frames were combined into a mosaic within GeoVision (Fueten, 1997), an in-house developed program. Images were segmented using the method of Fueten and Mason (2007)and the algorithm ofGoodchild and Fueten (1998), resulting in individually outlined quartz grainAll data were extracted for individual quartz grains, using these edges.
Quartz c-axes for grains were computed using the method of
Fueten and Goodchild (2001). Like all methods that rely on optical measurements from thin sections placed on flat stages alone, this
technique cannot completely resolve the plunge direction of thec -axis. The optical information obtained for a pixel with trend X is the same as for a pixel of trend X+180°. All data are initially calculated with a trend between 0 and 180°; for presentation purposes the data is then duplicated in the 180–360° range. As outlined byFueten and Goodchild (2001), the calculation of the plunge ofc-axis based on the Maximum Intensity Image (Fueten, 1997) is subject to a number of assumptions, or would require extensive calibration. For the purposes of this study we assumed that the brightest grain in the Maximum Intensity Image for any fringe has itsc-axis parallel to the plane of the
section. A grain with a verticalc-axis would have intensity similar to the opaque grains. The apparent alignment of data along a single trend visible in some fabric diagrams is an artifact of the calculation of the trend of grains, which is based on the mode of the Maximum Position Image (Fueten, 1997). It occurs in small grains which would more realistically have a scatter in the trend of only a few degrees. Allc-axes
data were contoured using Pangaea Scientific's Spheristat®
applica-tion (SpheriStat™2.2, 1998).
Since on the optical microscope only the optical axis can be measured, thin sections were prepared for a complete crystallographic analysis using the electron backscatter diffraction (EBSD) techniques. Samples for EBSD analysis were prepared according to the method
introduced byFynn and Powell (1979). A slab of the sample, cut parallel to the lineation and perpendicular to the foliation, was mechanically ground with diamond paste down to afinal particle size
of 0.25μm. Afinal lapping stage was accomplished using a high pH
silica solution (SYTON) for about 8 hours to remove surface damage. A carbon coat was avoided to prevent a decrease in the intensity of the backscattered diffraction pattern. After the sample surface was perfectly flat and damage-free the thin section was put into the microscope chamber tilted 70° to the horizontal position at a working distance of 32 mm. An accelerated electron beam of 20 kV was applied for a spot size of 70. At each point of the incidenct beam the crystallographic data were collected at an interval of 10μm. An
Oxford-HKL Nordlys detector attached to a SEM JEOL-5510 was used to acquire the electron backscatter patterns (EBSP), which were automatically indexed using the Flamenco module of the Channel 5 software package (Oxford-HKL). All EBSD job was performed in a MEV-EBSD system installed in the Laboratory of Microscopy and Microanalysis (MICROLAB) in the Department of Geology at the Federal University of Ouro Preto, Brazil. For a data acquisition we used a mean angular deviation (MAD) of 2°. For mapping as well as for pole and inverse polefigure calculations the MAD was set to≤1°. The orientation mapping was accomplished using the Tango module of the Channel 5 package. The zero solutions (misindexed or non-indexed points) were initially reduced by the spike correction of individual zero-solution measurements relative to the surrounding points. Afterwards, they were extrapolated based on the successfully indexed patterns of the adjacent non-indexed/misindexed measurements. The extrapolation was done three times, based on the measurement of four
well indexed neighboring points. This is considered a reasonable level to produce more realistic microstructural maps for quartz aggregates. Thefinal map, after the spike removal and extrapolation of successfully
measurements to zero-solution points, covered 90% of indexation in average. It means that 10% of the maps are made of non-indexed/ misindexed points whose MAD were higher than 2°.
4. Quartz microstructures in strain fringes
Fringe structures consist of magnetite porphyroclasts of varied shapes and sizes and their two strain fringes, which consist of quartz with only a minor amount of iron oxide (b1%). A typical fringe
structure consists of the porphyroclast, a set of strain fringes adjacent to their sides and narrow, long tails of predominantly equant grains or more complexfiber geometries (Figs. 2 and 3).
The length and width of thefibers can vary depending on their
positions with respect to the porphyroclasts. In general, quartzfibers of higher aspect ratio are found next to the clasts, particularly in direct contact with them. In this case,fibers can have aspect ratio as high as
10 to 1 (Figs. 2 and 3). The long axes of thefibers directly attached to the porphyroclast are usually oblique to its faces. Fibrous quartz crystals adjacent to clasts show the highest angle of curvature (~25°) which progressively decreases towards the matrix (~ 15°). Although curved singlefibers change shape orientation, quartzc-axis orienta-tion remains unchanged throughout thefiber length.
Fibers near the clast normally do not show optical signs of crystal plastic deformation. Deformation features consisting of sweeping undulatory extinction and subgrain development, with boundaries
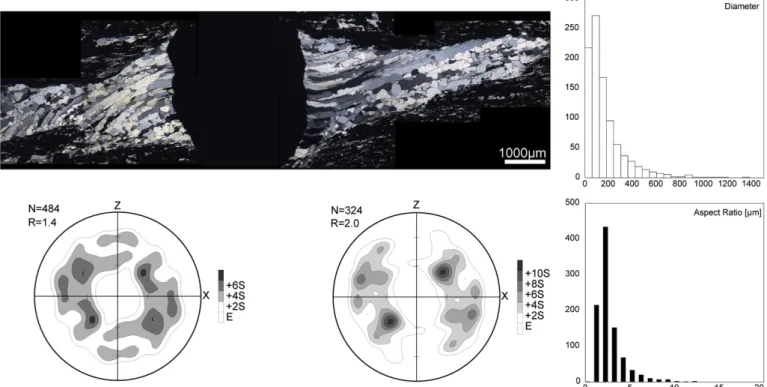
Fig. 2.A strain shadow type with two distinct domains. Photomicrograph at maximum intense light. N is the number of quartz grains measured and R is the mean aspect ratio for the entire fringe structure on both sides of the clast. The equal area projection is perpendicular to the foliation (trace of foliation is horizontal) and parallel to the lineation (also horizontal). Density of contoured polefigure is given as uniform distribution on a lower hemisphere. Fiber domains next to the clast and outer domain showing an aggregate of mixed equant and elongate grains.c-axis polefigures in both sides of the clast show similar fabrics. The grain size distribution an aspect ratio of quartz grains are shown in histogram of frequency.
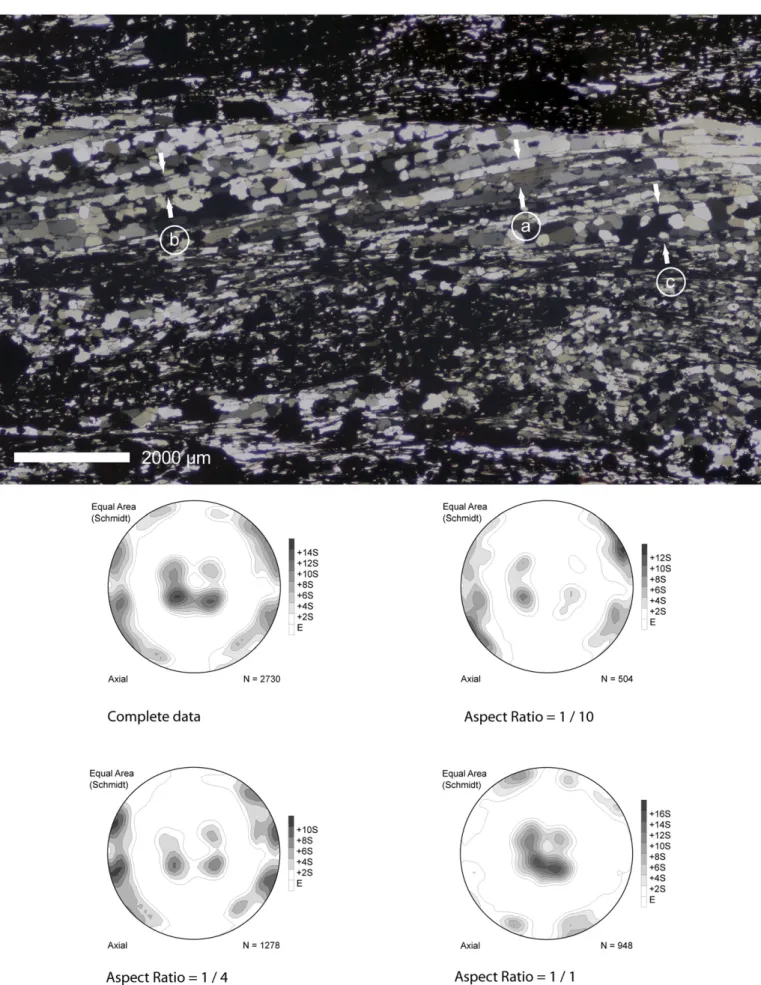
Fig. 3.The strain fringe taken for EBSD analysis. The mosaic was mounted from a set of EBSD maps and presented as an orientation map of the entire fringe. The polefigures and the inverse polefigures of the fringe domains calculated from Euler angles using the program Mambo, Channel 5, lower hemisphere, multiples of uniform distribution, non-polar projection. The polefigures are plotted for the complete data set in each side of the fringe, left and right. Polefigures are also calculated for equant (aspectb2) and elongate (aspect ratioN3) grains. The inverse polefigures (X-direction) are presented in the same way. In the orientation map of the inverse polefigures each pixel is color-coded and corresponds to the inverse polefigure color key (inset) of the X-direction. Grain size distribution and aspect ratio for both sides of the fringe are presented as histrogram of frequency for the complete set of grains as well as sorted for two classes of grains with lower and higher aspect ratios, away and closer to the clast object, respectively.
parallel and perpendicular to thefiber long axes, become visible as distance from the clast increases.
In domains away from the porphyroclasts long fibers are less commonly seen and aggregates consist mainly of elongate grains with acicular inclusions or equant quartz grains. Elongate grains have aspect ratios of up to 4:1 and straight boundaries meeting at 90°. The size and shape of these grains are similar to those of the subgrains within long quartzfibers and their short dimensions are similar to the width of the quartzfibers.
Equant quartz (aspect ratio around 1:1) grains vary in size between 50μm and 200μm. Their boundaries are straight and grains
are optically strain free. For some complex fringe structures the transition from proximal fiber domains to the distal elongate to equant domains is gradual on both sides of the strain shadows. In this transitional region aggregates consist of a mixture of remnantfibrous
grains, which are still recognizable by their straight boundaries and characteristic acicular inclusions, as well as by elongated and equant quartz grains.
5. Quartz microstructures in the matrix
Three main types of microstructures are shown by the quartz grains in the matrix (Fig. 4):fibrous, elongate or blocky-shaped grains and equant grains. The elongate quartz grains are characterized by aspect ratio up to 4:1 (longest to shortest ratio). Close to small clasts or fragments of magnetite grains or mixed with grains of slightly elongate to equant shape fibrous quartz crystals can still be recognized. Similarly to thosefibrous grains found closer to larger
magnetites grains thefibrous grains have about the same aspect ratios (10:1). Fibrous quartz in the matrix are usually optically strain-free, although in some of them it is possible to see undulatory extinction and subgrains. Another common feature of thefibrous quartz grains is the presence of small needle-shaped inclusions and tiny opaque minerals oriented parallel to thefiber length.
Other types of quartz grain, found mixed with thefibers, consist of
elongated or blocky grains in an array of longest and shortest interfaces parallel and perpendicular to the compositional banding, respectively. Commonly, quartz crystals of this type are of interme-diate aspect ratio between thefibrous and equant grains. In average the longest to shortest dimension ratios are of 4:1. Similarly to the quartzfibers, the blocky grains only show minor optical sign of crystal
plastic deformation such as sweeping undulatory extinction and limited subgrain development.
The last category of grains present in the matrix is that of equant shape. They usually have straight boundaries meeting at 120°. Crystals are completely free of any optical sign of crystal plastic deformation. Grains vary in a wide range of size and the aspect ratio is around 1:1. They are arranged in the quartz layers in lens shapes, surrounded by
fibrous and blocky grains. No inclusions of any type are observed in this type of grains.
6. c-axis preferred orientation
Quartz c-axes around the magnetite porphyroclasts show a
somewhat complex distribution (Figs. 2 and 3). The most remarkable one consists ofc-axes oriented at low angle to the foliation trace. This is a position for c-axis orientation around the X-direction that
coincides with the mineral lineation as shown in the pole and inverse pole figures in Fig. 3. For that orientation, the maxima have an asymmetrical distribution in a small circle centered around a direction that makes angles of 0–25° with the X-axis of the polefigure. The type
ofc-axis fabric at low angle to X is typically found in strain fringe domains wherefibrous quartz crystals are close or attached to the magnetite porphyroclasts. A similar crystallographic fabric can also be observed infibrous quartz crystals with a high (10:1) to moderate (4:1) aspect ratio in the fringe as well as in the matrix.
Contrastingly,c-axes are also clustered in an orientation close to the foliation pole (Z-axis) (Fig. 3). In this case the poles to the basal planes (0001) are slightly asymmetrically distributed around the Z-axis. The poles to {m} planes have a tendency to concentrate along the X-axis of the sample reference frame. The samec-axis patterns are also observed when thec-axes are plotted for equant grains (aspect ratio around 1) in the fringe domains (Fig. 3) and in the matrix (Fig. 4).
Thec-axes also concentrate close to the Y-axis and in a halfway
between the periphery and the Y-axis of the stereogram (Figs. 2, 3, and 4). The same distribution is also found for grains with blocky and equant shapes in the matrix. Thec-axis orientations that coincide with
a position of basal slip, i.e. with maxima close to the foliation pole, is more likely to occur for grains with a lower aspect ratio, such as the slightly elongate to equant grains found in the distal domains of the fringe structure as well as the in the matrix. Thec-axis concentration around the Y-direction is a typical crystallographic fabric for grains with aspect ratio close to 1, in both domains of the fringe and the matrix.
7. Discussion
7.1. Growth offibers in strain fringe
Fibers in contact with foliation in the matrix exhibit deformation features, while those in contact with the porphyroclast faces are mostly strain-free. This is consistent with existing models offiber growth at the clast–fringe interface (Ramsay and Huber, 1983). Curvature infibers is generally attributed to the rotation of clast-fringes during progressive opening of void space and growth offibers
(Durney and Ramsay, 1973; Kanagawa, 1996). Overall, the fringe
fibers examined here show a sense of curvature on either side of the clast that is consistent with fringe formation models of dextral deformation. That sense of shear agrees with mesoscopic shear sense indicators observed in the outcrop. Hence the fringe structures are considered as having been formed during a single episode of progressive deformation.
Away from the clast, fibers are frequently truncated by the
foliation atfiber-matrix interfaces. It is likely that this truncation is produced by dissolution, and a considerable part of the fringe shadow might be dissolved at iron oxide foliation/fiber interfaces.
Althoughfibers may be curved, the orientations of theirc-axes are constant along the entirefiber, as has been observed by Spencer (1991)in strain fringes of pyrite type. The formation offibers at the clast (the core object)-fringe interface may be viewed as a continuous growth model (e.g.Durney, 1976; Durney and Ramsay, 1973; Hilgers
and Urai, 2005). As new fiber growth is initiated during an
incremental extension, the dissolved quartz infills the narrow void
and afiber grows. The fast growth direction of quartz is along thec -axis (Tullis, 1989), hence it is likely that the long axes of newly growingfibers are initially parallel to the c-axes, similar to quartz
crystalsfilling voids or veins. It is argued below that quartz crystals in the fringes undergo reorientation by glide controlled lattice rotation asfibers extend beyond the immediate pressure shadow of the clast;
hence the most likely example offiber grains that preserve their initial growth orientation are the fibers close to the porphyroclasts (proximal domains). Thesefibers are at low angle to foliation and
have a c-axis fabric also at low angle to foliation. Progressive
deformation may lead to a rotation of the clast-fringe system and result in a change of the direction of growth, resulting in the formation of curvedfibrous quartz crystals. Although thefibers may curve or
undergo lattice rotation, the lattice of newly precipitated quartz near the clast is in continuity with that of the existing quartzfiber. In some cases the curvature of fibrous crystals can be explained by
deformation or grain boundary migration (Williams and Urai, 1989). However the curvedfibers are mostly strain-free close or at
the clast-fringe contacts and usually contain delicate inclusions of tiny acicular crystals, which would be destroyed or modified during
deformation or grain boundary migration (Bons and Jessell, 1997; Urai et al., 1991). This process of mineral growth allows for the formation of curved quartz fibers devoid of curvature related deformation features.
There are important similarities between thefibrous quartz grains of the fringes and those of the matrix. Both have nearly the same average size and shape (Figs. 2, 3 and 4). They also show similar crystallographic preferred orientation, with theirc-axes aligned at small angles to the X-direction. Quartzfibers of both domains are almost free of optical signs of crystal plastic deformation, apart from the subgrains present in some larger fibers. These characteristics present infibers from the fringe and the matrix suggest that those
fibrous quartz grains might have had a similar origin. It is very unlike
considering the deformation conditions for the development of these
fibers that the elongate quartz grains might have been formed by deformation through slip along the prism plane parallel to [c], since this would be expected for quartz aggregates deformed at much higher temperatures (Mainprice et al., 1986). Therefore the most likely scenario in this case would be the one wherefibrous grains precipitated from solution and grew with a consistent relationship between the elongation direction and the crystallographic orienta-tion. This suggests that thefibrous habit of the quartz grain of the fringe is an original feature produced in response to an active stress
field. The growth of crystals in a crystallographic continuity with adjacent quartz matrix corresponds to a displacement-controlled origin for thefibrous quartz in the strain fringe.
The equant to blocky quartz grains in the fringe domains might also be thought to have grown freely in an open space.Urai et al. (1991)presented a model for a growth behavior of crystals in veins, largely confirmed by numerical experiments and observations (Bons, 2001; Hilgers et al., 2001; Hilgers and Urai, 2002; Nollet et al., 2005), which might be applicable to explain the formation of this type of quartz grains in the fringe. According to the model competition between grains that grow into an open space may normally form aggregates of equidimensional or just slightly elongate crystals. It happens when crystal growth of all grains is slower than the opening rate of space, resulting to crystals grow freely in afluid-filled space. Crystal growth can be whether isotropic or anisotropic. Isotropic growth, i.e. independent of crystallographic direction, produces grains approximately equidimensional. In the anisotropic case crystal would grow more rapidly in some crystallographic direction than in others. This would produce euhedral crystal faces and a crystallographic preferred orientation in the grains that survive growth competition (Bons, 2001; Nollet et al., 2005). However the equant quartz grains in the fringe domains have a strong crystallographic preferred orienta-tion (maxima around the Y-axis) and they do not develop euhedral crystal faces, which are features not expected for polycrystals formed by a freely growth intofluidfilled space. In a free growth, crystals grow from the wall rock into an open cavity. The only interference is between the growing crystals. Crystals with favorable orientation and position survive and are able to grow to large crystals. The surviving crystals have the most favorable growth orientation. It is most common for crystals with the fastest growth direction perpendicular to the surface wall (Thijssen et al., 1992). Crystallographic preferred orientation (CPO) developments are reported for quartz rocks deformed dominantly by some form of dissolution-precipitation creep (DPC). It was argued that these CPOs were a result of crystallographic orientation-dependent dissolution and growth of quartz grains (Hippertt, 1994; Stallard and Shelley, 1995; Takeshita and Hara, 1998). Experiments (den Brok, 1992; 1996;Heidelbach et al., 2000) and observation in naturally deformed quartz rocks (Becker, 1995) have shown the occurrence of such orientation-dependent dissolution and/or growth. Modeling byTullis (1989)and numerical simulation byBons and den Brok (2000)showed a CPO development
due to DPC considering a crystallographic controlled anisotropy in the rates of dissolution and growth under non-hydrostatic stress. Based on these results, it appears that crystallographic directions with slow dissolution and growth rates end up in orientations facing the maximum shortening direction, while crystallographic directions with fast dissolution and growth rates, which are parallel to the quartzc-axes, end up facing maximum extensions direction. Consid-ering the fact that quartz grains grow at fastest rates perpendicular to the substrate walls and that the fast growth rates are parallel to the [c] direction, it is very unlikely that growth influid-filled open space would have CPO fabric parallel to the Y-direction of the sample, here coincident with the intermediate shortening direction of thefinite
strain ellipsoid. In addition, these grains have microstructures and CPO fabric similar to the equant grains in the matrix. This makes the hypothesis of freely crystal growth in an open space very improbable for the fringe domains. These microstructures might have been produced by recrystallization-accommodated dislocation creep as discussed in the following section.
7.2. Post-crystallization deformation of quartzfibers
While near clast fringec-axis orientations support the argument
thatfibers grow along theirc-axes, fringes also display maxima at a considerable angle to the fiber axis. Once precipitated, the quartz
fibers are subjected to the strain within the rocks, increasingly so with
distance from the protective clast. Several of the curvedfibers are truncated by matrix. Fibers are recrystallized into elongate grains with nearly straight boundaries approximately parallel and perpendicular to thefiber long axis. The correspondingc-axis fabrics show a strong maximum perpendicular to thefiber length. We suggest that this domain deformed by a combination of pressure solution and plastic deformation of a fringe that initially approximated the clast in width. The truncation of the fibers suggests dissolution of quartz fibers. Foliation perpendicular dissolution of the fringe can account for the reduction in width of the fringe with no need for foliation parallel extension which would be required in a constant volume deformation.
Thec-axis fabrics at high angle to the foliation can be accounted for
as the result of lattice rotation with slip on the basalbaNglide system
(Christie et al., 1964; Schmid and Casey, 1986). Quartz withc-axes nearly parallel to the foliation would be in a meta-stable position for this glide system, with the glide plane parallel to the assumed shortening direction. Quartz grains withc-axes at an angle to the foliation have glide planes inclined to the shortening direction and thus they are susceptible to rotation. The expected rotation ofc-axis orientations using the basalbaNglide system is away from the
foliation plane. Hence, we suggest that c-axis orientations with maxima at a high angle to the fiber axes are produced by lattice
rotation. Fibers with a c-axis fabric at high angle to the foliation represent the end position of the lattice rotation outlined above; their basal planes have rotated into a position at low angle to the foliation. In addition to that, a component of slip on rhomb planes might also have played a role in the production of the crystallographic fabric in quartz aggregates alongside the clasts. This is suggested by the crystallographic orientation ofc-axes almost halfway between the periphery and the central part of the polefigures. A component of prismbaNslip is still suggested particularly for lower aspect ratio or
more equant grains, where the maxima are asymmetrically distrib-uted around the Y-direction in the polefigures (Schmid and Casey, 1986). Although c-axis distribution patterns like these are more common at higher temperatures of deformation, in the studied case the presence of water, suggested by several dissolution-precipitation features, might be accounted for the activation of multiple slip system in the quartz aggregates. It is well known since the work ofGriggs and
Blacic (1965)that even small amounts of water might lower the
crystal plasticflow strength of quartz samples. This might have caused
a decrease in the critical resolved shear stress necessary to activate the slip sytems which are supposed to be active at higher temperature. The perpendicular boundaries of the elongate quartz grains can be accounted for as subgrain boundaries perpendicular to the glide plane which became grain boundaries by increasing misorientation (Urai et al., 1986; White, 1977).
7.3. Progressive deformation of the clast-fringe system
Quartzfibers precipitate in the strain shadow of the clast with their initial growth direction parallel to theirc-axes. Progressive deforma-tion resulting in a rotadeforma-tion of the clast fringe system leads to curved growth of individualfibers. The newly precipitated quartz near the clast is added in continuity with the existing crystallographic orientation.
Asfibers grow and extend beyond the strain shadow of the clast they are subjected to the strainfield of the matrix. The quartz of the fringe then becomes a competent unit itself. Deformation of the fringe proceeds by lattice rotation and the sense of rotation is consistent with a primarily co-axial deformation near the clasts and a more general shear with an additional dextral component away from the clast. Fiber grains recrystallize by subgrain rotation which separates the long fiber into smaller elongate-shaped grains with two boundaries parallel to the originalfiber boundaries and two at high angles. As recrystallization proceeds, it may become impossible to identify fibers. The fringe is pressure solved as illustrated by the truncatedfibers and the assumed reduction in volume. In long fringes, strain may impose deformation beyond the already discussed lattice rotation and recrystallization and extensional shears may form.
Thefinal length of fringe, as a function of clast size illustrated in
Fig. 2far exceeds those commonly illustrated. This clast and fringe are better described as a competent quartz layer with a central inclusion. This layer has grown parallel to the foliation and as argued above perpendicular to the maximum compression direction of a largely coaxial deformation. As long as the deformation conditions do not change, periodic fracturing along the clast-fringe interface should be able to extend this layer indefinitely. Such near-infinite fringe growth is unlikely to exist in any rock with a significant component of simple
shear as folding would most likely disrupt long fringes.
8. Conclusions
The observation of microstructures and crystallographic orienta-tions offibrous quartz grains around magnetite porphyroclasts in iron formation rocks yield the following conclusions.
The formation and deformation of fringe structures involve a combination of processes including microfracturing, pressure solu-tion, and crystal plastic deformation. Fibers likely nucleate at the clast boundary and initially grow parallel to their c-axis. The elongate nature of the fibers and the consistent relationship between the elongation direction, crystallographic orientation andfiber curvature
can be interpreted to be formed by a deformation history with changingflow parameters with respect to the developing fringe and the foliation in the wall rock. Quartzfibers grew away from the matrix
towards the clast in a crystallographic continuity with adjacent wall rock quartz due to the chemical affinity betweenfibers and matrix. Fibers are displacement-controlled and track the opening direction between the core object and the matrix. Progressive deformation may impose rotation of the fringe structure leading to curved fibers, however the newly precipitated quartz is added in continuity with the existing lattice orientation.
Near the clast, quartzfibers are devoid of deformation features, however beyond the immediate strain shadow of the clast they are subjected to the deformation of the surrounding matrix. The main deformation mechanisms are lattice rotation and dislocation glide along crystallographic basal planes. The recovery mechanism
includ-ed recrystallization by formation of elongatinclud-ed subgrains with boundaries approximately parallel and perpendicular to the grain longest axis. The rotation of subgrains resulted in an aggregate of elongated recrystallized grains. In distal domains recrystallization may be extensive, although some remnantfiber grains may still be recognizable. The fringe itself is subject to pressure solution, leading to the truncation offibers at the matrix boundary.
The fringe grows from the clast, and should continue to do so until deformation conditions change. The microfracture during one growth increment may only be present on one side of the clast and lead to the development of asymmetrical fringe feature. It may also prevent the rotation of the clast into a foliation parallel end position.
Acknowledgements
Paula MacKinnon is thanked for comments on an earlier version of this manuscript. The authors wish to acknowledge Heather Racher for microfrabric data acquisition using GV program. Chris Hilgers, Hans Thybo and two anonymous referees are thanked for their suggestions, which greatly improved the manuscript. The editorial handling by Andres Villacicencio is greatly acknowledged. L. Lagoeiro is grateful forfinancial support by CNPq project 478776/2009-8. This project was partially funded by an NSERC discovery grant to F. Fueten.
References
Aerden, D.G.A.M., 1996. The pyrite-type strain fringes from Lourdes (France): indicators of Alpine thrust kinematics in the Pyrenees. Journal of Structural Geology 18, 75–91.
Alkmim, F.F., Marshak, S., 1998. Transamazonian Orogeny in the Southern São Francisco Craton Region, Minas Gerais, Brazil: evidence for Paleoproterozoic collision and collapse in the Quadrilátero Ferrıífero. Precambrian Research 90, 29–58. Babinski, M., Chemale Jr., F., Van Schmus, W.R., 1993. A idade das formações ferrıíferas
bandadas do Supergrupo Minas e sua correlação com aquelas da África do Sul e Austrália. Anais II Simpósio do Cráton do Sao Francisco, Salvador: Soc. Bras. Geol., Núcleo Bahia/Sergipe, pp. 152–153.
Becker, A., 1995. Quartz pressure solution: influence of crystallographic orientation. Journal of Structural Geology 17, 1395–1397.
Bons, P.D., 2001. Development of crystal morphology during unitaxial growth in a progressively widening vein: I The numerical model. Journal of Structural Geology 23, 865–872.
Bons, P.D., den Brok, B., 2000. Crystallographic preferred orientation development by dissolution-precipitation creep. Journal of Structural Geology 22, 1713–1722. Bons, P.D., Jessell, M.W., 1997. Experimental simulation of the formation offibrous
veins by localised dissolution–precipitation creep. Mineralogical Magazine 61, 53–63.
Christie, J.M., Griggs, D.T., Carter, N.L., 1964. Experimental evidence of basal slip in quartz. Journal of Geology 72 (6), 734–756.
den Brok, S.W.J., 1992. An experimental investigation into the effect of water on the
flow of quartzite. Geologica Ultraiectina 95, 178.
den Brok, B., 1996. The effect of crystallographic orientation on pressure solution in quartzite. Journal of Structural Geology 18, 859–860.
Dorr II, J.V.N., 1969. Physiographic, stratigraphic and structural development of the Quadrilátero Ferrıífero, Minas Gerais, Brazil. United States Geological Survey Prof. Paper 641-A. United States Geological Survey, pp. 1–110.
Durney, D.W., 1976. Pressure-solution and crystallization deformation. Philosophical Transactions of the Royal Society of London A: 283, 229–240.
Durney, D.W., Ramsay, J.G., 1973. Incremental strains measured by syntectonic crystal growths. In: DeJong, K.A., Scholten, R. (Eds.), Gravity and Tectonics. Wiley, New York, pp. 67–95.
Elliot, D., 1972. Deformation paths in structural geology. Bulletin Geological Society of America 83, 2621–2638.
Fynn, G.W., Powell, W.J.A., 1979. The Cutting and Polishing of Electro-Optic Materials. Adams Hilger, London.
Fueten, F., 1997. A computer controlled rotating polarizer stage for the petrographic microscope. Computers and Geosciences 23, 203–208.
Fueten, F., Goodchild, J.S., 2001. Quartz c-axes orientation determination using the rotating polarizer microscope. Journal of Structural Geology 23, 895–902. Fueten, F., Mason, J., 2007. An artificial neural net assisted approach to editing edges in
petrographic images collected with the rotating polarizer stage. Computers and Geosciences 33, 1176–1188.
Goodchild, J.S., Fueten, F., 1998. Edge detection in petrographic images using the rotating polarizer stage. Computers and Geosciences 24, 745–751.
Griggs, D.T., Blacic, 1965. Quartz: anomalous weakness of synthetic crystals. Science 147, 292–295.
Hilgers, C., Koehn, D., Bons, P.D., Urai, J.L., 2001. Development of crystal morphology during unitaxial growth in a progressively widening vein: II Numerical simulations of the evolution of antitaxialfibrous veins. Journal of Structural Geology 23, 873–885.
Hilgers, C., Urai, J.L., 2002. Microstructural observations on natural syntectonicfibrous veins: implications for the growth process. Tectonophysics 352, 257–274. Hilgers, C., Urai, J.L., 2005. On the arrangement of solid inclusions infibrous veins and
the role of the crack-seal mechanism. Journal of Structural Geology 27, 481–494. Hippertt, J.F., 1994. Microstructures and c-axis fabrics indicative of quartz dissolution in
sheared quartzites and phyllonites. Tectonophysics 229, 141–163.
Hippertt, J., Lana, C., Takeshita, T., 2001. Deformation partitioning during folding of banded iron formation. Journal of Structural Geology 23, 819–834.
Kanagawa, K., 1996. Simulated pressure fringes, vorticity, and progressive deformation. In: Structural Geology and Personal Computers. In: De Paor, D.G. (Ed.), Computer Methods in the Geosciences, 15. Pergamon, Elsevier, Oxford, pp. 259–283. Koehn, D., Aerden, D.G.A.M., Bons, P.D., Passchier, C.W., 2001. Computer experiments to
investigate complexfibre patterns in natural antitaxial strain fringes Submitted to the Journal of Metamorphic Geology 19, 217–231.
Koehn, D., Bons, P.D., Passchier, C.W., 2003. Development of antitaxial strain fringes during non-coaxial deformation: an experimental study. Journal of Structural Geology 25 (2), 263–275.
Koehn, D., Hilgers, C., Bons, P.D., Passchier, C.W., 2000. Numerical simulation offibre growth in antitaxial strain fringes. Journal of Structural Geology 22, 1311–1324. Lagoeiro, L., 1998. Tranformation of magnetite to hematite and its influence on the
dissolution of iron oxide minerals. Journal of Metamorphic Geology 16, 415–423. Machado, N., Schrank, A., Noce, C.M., Gauthier, G., 1996. Ages of detrital zircon from
Archean-Paleoproterozoic Sequences: Implications for Greenstone Belt setting and evolution of a Transamazonian foreland basin in Quadrilátero Ferrıífero, southeast Brazil. Earth Planet. Science Letters 141, 259–276.
Mainprice, D., Bouchez, J.L., Blumenfeld, P., Tubia, M., 1986. Dominant C-slip in naturally deformed quartz: implications for dramatic plastic softening at high temperature. Geology 14, 812–822.
Mügge, O., 1928. Ueber die Entstehung faseriger Minerale und ihrer Aggregationsfor-men. Neues Jahrbuch für Mineralogie, Geologie und Paläontologie 58A, 303–438. Nollet, S., Urai, J.L., Bons, P.D., Hilgers, C., 2005. Numerical simulations of polycrystal
growth in veins. Journal of Structural Geology 27, 217–230.
Pabst, A., 1931.‘Pressure shadows’and the measurement of the orientation in rocks. Journal of the Mineralogical Society of America 16, 55–70.
Passchier, C.W., Trouw, R.A.J., 2005. Microtectonics. Springer, Heidelberg. 371 pp. Ramsay, J.G., Huber, M.I., 1983. The Techniques of Modern Structural Geology, 1: Strain
Analysis. Academic Press, London.
Sarantschina, G.M., 1963. Die Fedorow-Method. VEB Deutscher Verlag der Wissenschaften, Berlim.
Schmid, S., Casey, M., 1986. Complete fabric analysis of some commonly observed quartz c-axis patterns. In: Hobbs, B.E., Heard, H.C. (Eds.), The Paterson Volume Geophysical Monograph, 36, pp. 263–286.
Spencer, S., 1991. The use of syntectonicfibres to determine strain estimates and deformation paths: an appraisal. Tectonophysics 194, 13–34.
SpheriStat™2.2, 1998. Pangaea Scientific. Commercial orientation analysis program. http://www.pangaeasci.com/1998.
Stallard, A., Shelley, D., 1995. Quartz c-axes parallel to stretching directions in very low-grade metamorphic rocks. Tectonophysics 249, 31–40.
Takeshita, T., Hara, I., 1998. c-Axis fabrics and microstructures in a recrystallized quartz vein deformed underfluid-rich greenschist conditions. Journal of Structural Geology 20, 417–431.
Thijssen, J.M., Knops, H.J.F., Dammers, A.J., 1992. Dynamic scaling in polycrystalline growth. Physical Review B 45 (15), 8650–8656.
Tullis, T.E., 1989. Development of preferred orientation due to anisotropic dissolution/ growth rates during solution-transfer creep. Eos Transactions AGU 70, 457–458. Urai, J.L., Means, W.D., Lister, G.S., 1986. Dynamic recrystallization of minerals. In:
Mineral and rock deformation: laboratory studies. The Paterson Volume: In: Hobbs, B.E., Heard, H.C. (Eds.), Geophysical Monographs, 36, pp. 161–199.
Urai, J.L., Williams, P.F., van Roermund, H.L.M., 1991. Kinematics of crystal growth in syntectonicfibrous veins. Journal of Structural Geology 13, 823–836.
White, S.H., 1977. Geological significance of recovery and recrystallization processes in quartz. Tectonophysics 39 (1–3), 143–170.
White, S.H., Wilson, C.J.L., 1978. Microstructure of some quartz pressure fringes. Neues Jahrbuch Mineralogie Geologie Paleontologie 134, 33–51.
Williams, P.F., Urai, J.L., 1989. Curved vein fibres: an alternative explanation. Tectonophysics 158, 311–333.
Zwart, H.J., Oele, J.A., 1966. Rotated magnetite crystals from the Rocroi Massif (Ardennes). Geologie en Mijnbouw 45, 70–74.