S t a b i l i t y A n a l y s i s o f
Famagusta Churches: St.
George of the Latins
DECLARATION
Name: Alejandro Trujillo Rivas
Email: [email protected]
Title of the Msc Dissertation:
Stability Analysis of Famagusta Churches: St. George of the Latins
Supervisor(s): Paulo B. Lourenço Year: 2008 - 2009
I hereby declare that all information in this document has been obtained and shown in accordance with academic rules and ethical conduct. I also declare that, as required by these rules and conduct, I have fully cited and referenced all material and results that are not original to this work.
I hereby declare that the MSc Consortium responsible for the Advanced Masters in Structural Analysis of Monuments and Historical Constructions is allowed to store and make available electronically the present MSc Dissertation.
University: Universidade de Minho Date: 15th of July of 2009
Signature:
___________________________
A mi familia porque gracias a su amor y paciencia he cumplido mis sueños. A mi amor por la incondicionalidad, paciencia y felicidad.
ACKNOWLEDGEMENTS
I want to give a special acknowledgement to the European Commission and the Master Consortium for the Erasmus Mundus scholarship which was given to me. Thanks to the scholarship I was able to live abroad with all the facilities, only worried about studying for the Master.
Special thanks to Professor Pere Roca F. for his hospitality and kind help during the course work in Barcelona at Universitat Politècnica de Catalunya. Also thank you for the nice site visits, especially the one to Mallorca Cathedral. Gracias por todo!!!
I also want to give a special acknowledgement to my thesis supervisor Professor Paulo B. Lourenço, at Universidade de Minho, who was always available for solving my questions and answer my doubts despite of his multiples occupations. Thank you also for your great advises Prof Lourenço; I learned a lot from you. Muito obrigado pela sua ajuda!!!
I want to highlight the huge collaboration received from the PhD student Nuno Mendes, he was always available to help me run the analyses and to solve my doubts about different technical issues; and he prepared the RESUMO. Also special thanks to Prof. Luis Ramos for his valuable advices during the calibration of the model process. Muito obrigado pele seu tempo!!!
Also, I want to thank the helpful collaboration of Maria Teresa for her valuables corrections in my English grammar.
It is important to remark the hard work of Sandra Pereira and Dora Coelho, the old and new Master’s Secretariat; thanks for solving our visa, accommodation and payment issues while living abroad, sorry for bother you that much. Muito obrigado e beijinhos!!!
Finally, I would like to say that this experience was a time life one, because I was able to meet people from all over the world during my course work in Barcelona and during my dissertation in Guimarães. It was very important for me to learn from different cultures, their costumes and thoughts, to open my mind and see the different ways in which each of us see the world’s reality. I really enjoyed exploring Catalan and Portuguese cultures with my friends, I think something new we learned. Thank you guys for those nice moments, these memories will be always in my mind and in my heart, hope not to lose contact with you and wish you the best for your life!!!
ABSTRACT
This thesis addresses the study of the stability of Saint George of the Latins church, which is located in Famagusta (Cyprus), under self-weight and seismic loading. In the first part of the work, the state of the art is presented, including brief review on Famagusta history, its seismicity and the inspection and diagnosis works carried out on the church. The limit analysis of collapse mechanisms, both force based and displacement based, was used for a first safety assessment. After that, a numerical model was prepared using finite elements and it was updated using the dynamic identification results. The updated model was subjected to non-linear static (pushover) analysis in different directions (global and principal) using two lateral load patterns: proportional to the mass and proportional to the mode shape of the structure in the applicable direction. The results of the pushover analyses were compared with the limit analysis results. As final step, non-linear dynamic analyses with time integration were carried out and the dynamic behavior of the structure was compared with the results of limit analysis and pushover analysis.
By analyzing simplified collapse mechanisms (2D), an absolute lower bound of the structure capacity was obtained. Then by performing pushover analyses in different directions, the plastic hinge distribution assumed for the collapse mechanisms was validated and higher values for the loading capacity of the structure than those obtained from limit analyses were obtained, but all of them are lower than the Eurocode 8 seismic demand. Finally, from the stability seismic assessment of the structure by means of non-linear dynamic analysis was possible to determine that the structure is safe under PGA equal to 0.06g, but it was not possible to analyze the response for higher seismic load (0.07g), leading to the conclusion that the structure is in the limit of its loading capacity or the numerical model should be improved to perform these non-linear dynamic analyses.
RESUMO
Análise de estabilidade de igrejas de Famagusta: Saint George of the Latins
Esta tese tem por objectivo o estudo da estabilidade da igreja de “Saint George of the Latins”, situada em Famagusta (Chipre), sob acção do peso próprio e acção sísmica. Na primeira parte do trabalho é apresentada a revisão dos conhecimentos, incluindo uma breve revisão sobre a história de Famagusta, a sua sismicidade e os trabalhos de diagnóstico e inspecção levados a cabo na igreja. Na primeira verificação da segurança recorreu-se à análise limite, baseada quer em força quer em deslocamento, através da definição dos mecanismos de colapso. Seguidamente, foi preparado um modelo número de elementos finitos, tendo sido calibrado de acordo com os resultados da identificação dinâmica. O modelo calibrado foi utilizado em análises não-lineares estáticas segundo diferentes direcções (globais e principais) e com dois padrões de forças laterais: proporcional à massa e proporcional ao modo de vibração da estrutura na direcção em estudo. Os resultados das análises estáticas não-lineares foram comparados com os resultados da análise limite. Por último, foram feitas análises não-lineares dinâmicas com integração no tempo, tendo sido comparada a resposta dinâmica da estrutura com os resultados obtidos na análise limite e nas análises estáticas não-lineares.
O limite inferior de capacidade de carga da estrutura foi obtido com recurso à análise dos mecanismos simplificados (2D) de colapso. A distribuição das rótulas plásticas assumida na análise limite foi validada através das análises não-lineares estáticas em diferentes direcções, demonstrando que estas análises apresentam valores de capacidade de carga superiores aos obtidos na análise limite, no entanto ambas as análises apresentam capacidades inferiores às exigências definidas no Eurocódigo 8. Por último, através da avaliação da estabilidade sísmica da análise não-linear dinâmica foi possível determinar que a estrutura está estável quando submetida a uma aceleração de pico na base igual a 0.06g,no entanto não foi possível analisar a resposta da estrutura para uma acção sísmica superior (0.07g), sugerindo que a estrutura está no seu limite de capacidade de carga ou que o modelo numérico deve ser melhorado para levar a caco estas análises não-lineares dinâmicas.
RESUMEN
Análisis de Estabilidad de las Iglesias de Famagusta: “St. George of the Latins”
Esta tesis está encaminada al estudio de estabilidad de la iglesia “St. George of the Latins”, la cual está localizada en la ciudad de Famagusta (Chipre), bajo la acción de peso propio y acciones sísmicas. En la primera parte del trabajo, el estado del arte fue hecho incluyendo una corta revisión de la historia de Famagusta, su sismicidad así como también la inspección y diagnostico llevados a cabo en la iglesia. Análisis límite de mecanismo de colapso, basados en fuerza y desplazamiento, fueron usados tener un primer estimativo de las condiciones de seguridad. Posteriormente, un modelo numérico de la iglesia fue construido utilizando elementos finitos y fue actualizado utilizando los resultados de la caracterización dinámica de la iglesia. El modelo actualizado fue sometido a análisis estáticos no lineales (pushover) en diferentes direcciones (global y principal) utilizando dos patrones de carga: uno proporcional a la distribución de masa y el otro proporcional a los modos de vibración de la estructura en la dirección de aplicación. Los resultados de los análisis pushover fueron comparados con los resultados obtenidos en los análisis límite. Finalmente, análisis dinámicos no lineales con integración en el tiempo fueron llevados a cabo y el comportamiento dinámico de la estructura fue comparado con los resultados obtenidos en los análisis límite y los análisis estáticos no lineales.
Mediante el análisis de mecanismos de colapso simplificados (2D) fue posible encontrar el menor valor absoluto de la capacidad de la estructura. Después, mediante la aplicación de análisis pushover en diferentes direcciones, la distribución de rotulas plásticas asumida para los mecanismos de colapso fue validada y valores mayores a los encontrados en los análisis limite fueron encontrados para la capacidad de carga de la estructura, pero todos ellos mucho menores que la demanda sísmica estipulada en el Eurocode 8. Finalmente, de la valoración de estabilidad sísmica de la estructura y mediante el uso de análisis dinámicos no lineales, fue posible determinar que la estructura es segura cuando es sometida a una aceleración pico del terreno igual a 0.06g, pero no fue posible analizar la respuesta de la estructura ante carga sísmica mayor (0.07g), llegando a la conclusión que la estructura está en su estado limite de capacidad de carga o que el modelo numérico debe ser mejorado para llevar a cabo estos análisis dinámicos no lineales.
TABLE OF CONTENTS
DECLARATION ... I ACKNOWLEDGEMENTS ... V ABSTRACT ... VII RESUMO ... IX RESUMEN ... XITABLE OF CONTENTS ... XIII
LIST OF FIGURES ... XV
LIST OF TABLES ... XXIII
1. INTRODUCTION ... 1
2. STATE OF THE ART ... 5
2.1 LOCATION AND HISTORY FAMAGUSTA ... 5
2.2 FAMAGUSTA SEISMIC HAZARD ... 10
2.2.1 Tectonic Hazard ... 10
2.2.2 Historical Records and Instrumental Records ... 11
2.2.3 Earthquake Vulnerable Areas ... 12
2.3 SAINT GEORGE OF THE LATINS CHURCH ... 14
2.3.1 General description ... 14
2.3.2 Results from the Visual Inspection ... 16
2.3.3 Experimental results from dynamic Identification test ... 17
2.3.4 Experimental Results from Sonic Tests ... 20
3. LIMIT ANALYSIS OF COLLAPSE MECHANISM ... 23
3.1 INTRODUCTION ... 23
3.2 WEST FAÇADE AREA ... 27
3.2.1 Overturning in ‐X direction (Outwards) ... 28
3.2.2 Overturning in –Y direction (Outwards) ... 28
3.2.3 Collapse Mechanisms Results ... 29
3.3 NORTH FAÇADE AREA ... 30
3.3.1 Overturning in X direction (Inwards)... 31 3.3.2 Collapse Mechanism Results ... 32 3.4 APSE AREA ... 33 3.4.1 Overturning of Pier Wall 5 Outwards ... 34 3.4.2 Overturning of Pier Walls 6 and 7 Outwards ... 35 3.4.3 Overturning of Pier Wall 8 Outwards ... 36 3.4.4 Collapse Mechanism Results ... 37
3.5 ANALYSIS OF THE RESULTS ... 39
4. DEFINITION OF THE NUMERICAL MODEL ... 41
4.1 INTRODUCTION ... 41
4.2 GENERAL DESCRIPTION OF THE NUMERICAL MODEL ... 44
4.3 DEFINITION OF DIFFERENT NUMERICAL MODELS AND RESULTS OF LINEAR STATIC AND MODAL RESPONSE ANALYSES ... 45
4.3.5 Model MODTRIAL1... 60 4.3.6 Model MODTRIAL2... 64 4.3.7 Model MODTRIAL3... 68 4.3.8 Model MODTRIAL3‐A ... 72 4.3.9 .Model MODTRIAL3‐B ... 76 4.3.10 Model MODTRIAL3D ... 80
4.4 COMPARISSON BETWEEN THE MODELS ... 86
5. CALIBRATION OF THE NUMERICAL MODELS ... 89
5.1 INTRODUCTION ... 89
5.2 MATHEMATIC MODEL FOR THE CALIBRATION PROCESS ... 90
5.3 CALIBRATION OF MODEL MODTRIAL2 ... 91
5.4 CALIBRATION OF MODEL MODTRIAL3‐D ... 95
5.5 COMPARISSON BETWEEN CALIBRATED MODELS ... 99
6. NON LINEAR STATIC (PUSHOVER) ANALYSIS ... 103
6.1 INTRODUCTION ... 103
6.2 DEFINITION OF MASONRY CONSITUTIVE LAW AND NON‐LINEAR MATERIAL PROPERTIES ... 105
6.3 INTEGRATION SCHEME ... 107
6.4 DESCRIPTION OF ITERATION METHOD ... 108
6.5 PUSHOVER ANALYSES PROPORTIONAL TO MASS IN GLOBAL DIRECTIONS ... 109
6.5.1 Pushover analysis in X global direction ... 109
6.5.2 Pushover analysis in –X global direction ... 113
6.5.3 Pushover analysis in Y global direction ... 117
6.5.4 Pushover analysis in –Y global direction ... 120
6.6 PUSHOVER ANALYSES PROPORTIONAL TO MODE SHAPES CONFIGURATION ... 124
6.6.1 Selection of structural modes for the pushover analyses ... 124
6.6.2 Pushover analysis proportional to 1st mode ... 125
6.6.3 Pushover analysis proportional to 3rd mode ... 129
6.7 PUSHOVER ANALYSES PROPORTIONAL TO MASS IN PRINCIPAL AXES DIRECTION ... 131
6.7.1 Definition of the principal axes in plan of the structure ... 131
6.7.2 Pushover analysis in X’ direction ... 133
6.7.3 Pushover analysis in ‐X’ direction ... 135
6.7.4 Pushover analysis in Y’ direction ... 138
6.7.5 Pushover analysis in –Y’ direction ... 140
7. NON-LINEAR TIME HISTORY (DYNAMIC) ANALYSES ... 143
7.1 INTRODUCTION ... 143
7.2 ARTIFICAL ACCELEROGRAMS ... 144
7.3 MATERIAL DAMPING ... 149
7.4 TIME INTEGRATION METHOD ... 151
7.5 RESULTS OF THE ANALYSES ... 153
8. CONCLUSIONS ... 161
9. REFERENCES ... 167
LIST OF FIGURES
Figure 2.1. Location of Cyprus Island and Famagusta (Google, 2009)... 5
Figure 2.2. Famagusta city by (Miller, 1735) ... 7
Figure 2.3. General view of the state of conservation (2008) in (a) St George of the Latins Church, (b) St George of the Greeks Church and (c) Carmelite Church ... 9
Figure 2.4. (a) Lithospheric plates in the Cyprus region (Unit of Environmental Studies, 2004) and (b) Cyprus Arc estimation (Kythreoti & Pilakoutas, 2000) ... 10
Figure 2.5. Distribution of catastrophic and damaging earthquakes on Cyprus between 1896 and 2000 (Unit of Environmental Studies, 2004) ... 12
Figure 2.6. Definition of reference peak ground acceleration (PGA) on rock among Cyprus territory (CYS EN 1998-1:2005, 2007) ... 13
Figure 2.7. Geological map of Cyprus from Geological Survey Department (Unit of Environmental Studies, 2004). ... ...13
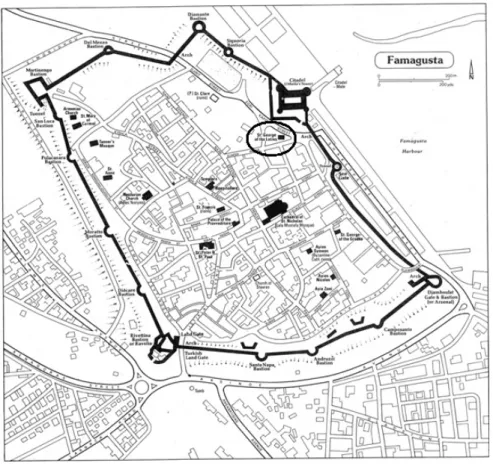
Figure 2.8. Map of Famagusta with St. George of the Latins location (Enlart, 1913) ... 14
Figure 2.9. Drawings carried out of (a) Front view of north Façade and (b) details on façade’s door (Kell, 1982)... ... 15
Figure 2.10. Geometrical survey of (a) church’s plane and (b) church’s height ... 16
Figure 2.11. Historical photographs: (a) 1940 situation vs. current condition and (b) presence of new (lighter) stone (Lourenço & Ramos, 2008) ... 16
Figure 2.12. Details of current condition of the church from the inspection carried out by (Lourenço & Ramos, 2008).. ... 17
Figure 2.13. Test measurements in St. George of the Latins church: (a) top plan and (b) North façade (Lourenço & Ramos, 2008) ... 18
Figure 2.14. Results of dynamic test: (a) Setup configuration and (b) measured frequencies and damping coefficients for the first six modes (Lourenço & Ramos, 2008) ... 19
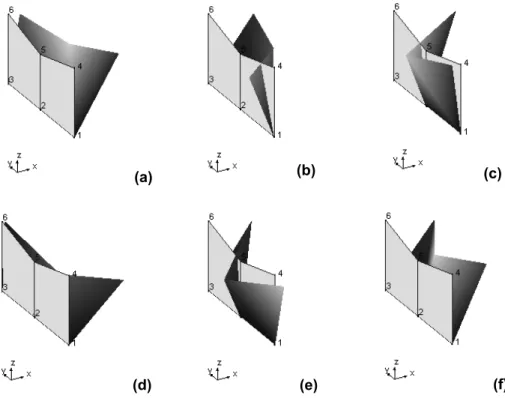
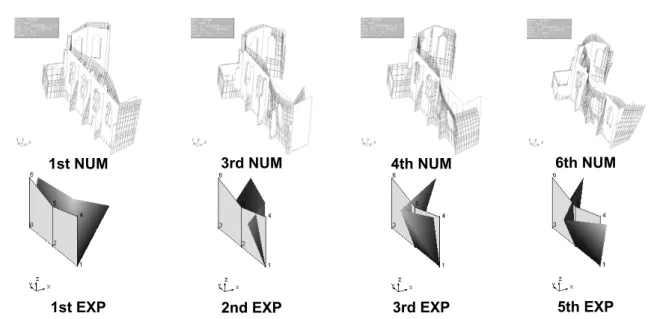
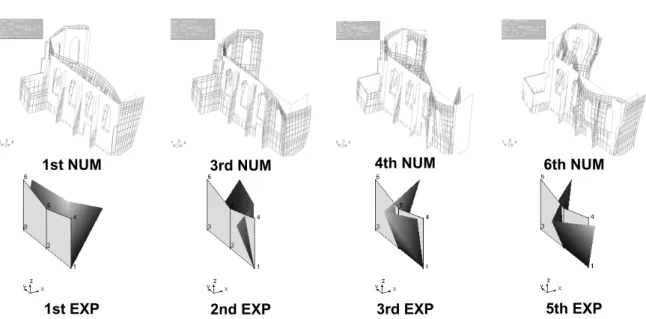
Figure 2.15. Mode shapes calculated with the experimental data: (a) 1st Mode shape configuration; (b) 2nd Mode shape configuration; (c) 3rd Mode shape configuration; (d) 4th Mode shape configuration, (e) 5th Mode shape configuration and (f) 6th Mode shape configuration ... 19
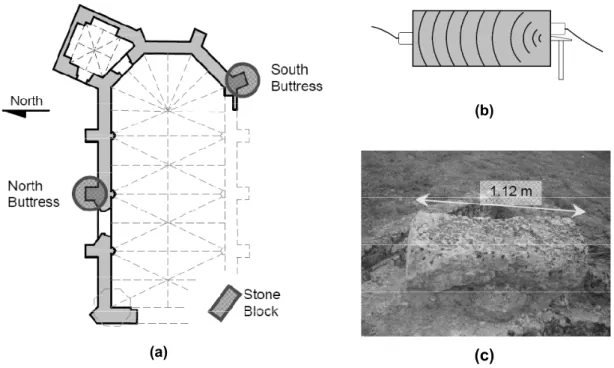
Figure 2.16. Sonic tests in St. George of the Latins church: (a) selected buttresses and block stone; (b) test setup for the stone block; and (c) image of the stone block (Lourenço & Ramos, 2008) ... 20
Figure 2.17. Sonic tests in North buttresses: (a) location of measured points and (b) velocity map (Lourenço & Ramos, 2008) ... 21
Figure 2.18. Sonic tests in South buttresses: (a) location of measured points and (b) velocity map (Lourenço & Ramos, 2008) ... 22
Figure 3.2. Numbering of pier walls and buttresses for two different reference directions: (a) global
directions and (b) rotated directions (parallel to the apse’s walls) ... 25
Figure 3.3. Applied Kinematic Models for out-of-plane mechanisms: (a) Vertical strips (Avorio, Borri, & Corradi, 2002) and (b) Horizontal strips (Bernardini, Gori, & Modena, 1988) ... 26
Figure 3.4. West façade: (a) general view, (b) upper part disconnection due to tower rotation, (c) severe deterioration of stones in the connection with North façade, (d) severe stone deterioration in the lower part and (e) replaced (lighter) stones during conservation works in 1940 ... 27
Figure 3.5. Macro-element selected for its overturning in –X direction ... 28
Figure 3.6. Macro-element selected for its overturning in –Y direction ... 29
Figure 3.7. Capacity curves of mechanism: (a) CM_W_X and (b) CM_W_Y ... 30
Figure 3.8. North façade: (a) interior view, (b) upper part of the second window (from left to right), (c) upper part of the third window (from left to right), (d) exterior view, (e) crack opening and sliding in the connection with West façade and (f) crack opening and sliding in the connection with the Apse .. 31
Figure 3.9. Selected macro-element (CM_N_X) for its overturning in X direction ... 32
Figure 3.10. Capacity curve of mechanism CM_N_X ... 33
Figure 3.11. Apse region: (a) internal view, (b) external view of buttress number 8, (c) internal view of lower portion of buttress number 8, (d) external view, (e) plastic hinge in the top point of the vault (sliding) and (f) general view of the vaults ... 34
Figure 3.12. Macro-element selected for its overturning in -X direction (CM_A5_X) and Y’ direction (CM_A5_RY)... ... 35
Figure 3.13. Selected macro-element for its overturning in Y direction (CM_A67_Y) ... 36
Figure 3.14. Selected macro-element for its overturning in X direction (CM_A8_X) and X’ (CM_A8_RX)... ... 37
Figure 3.15. Capacity curve of mechanism: (a) CM_A5_X, (b) CM_A5_RY, (c) CM_A67_Y, (d) CM_A8_X and (e) CM_A8_RX ... 38
Figure 3.16. Histogram with the load coefficients obtained from the kinematic analysis in X direction of collapse mechanism ... 39
Figure 3.17. Histogram with the load coefficients obtained from the kinematic analysis in Y direction of collapse mechanism ... 40
Figure 4.1. (a) General view of the church and (b) numerical model definition with (DIANA, 2008) 44 Figure 4.2. (a) Shell elements characteristics and (b) local axes convention (DIANA, 2008) ... 45
Figure 4.3. Maximum (a) and minimum (b) principal stresses of model MODDEF ... 46
Figure 4.4. First (a), second (b), third (c), fourth (d), fifth (e) and sixth (f) mode shapes of model MODDEF... ... 47
Figure 4.5. Qualitative comparison between model MODDEF and experimental mode shapes .... 49
Figure 4.6. Definition of the numerical model MODDEF (VAULTS) ... 50
Figure 4.8. First (a), second (b), third (c), fourth (d), fifth (e) and sixth (f) mode shapes of model MODDEF (VAULTS) ... 51
Figure 4.9. Additional mass of the tower (a) and the vaults (b) included in the numerical model ... 52
Figure 4.10. Selected regions in North façade with appreciable damage ... 54
Figure 4.11. Selected region in the Apse with appreciable damage ... 54
Figure 4.12. Damaged region in west façade due to loss of elements and severe stone deterioration... 55
Figure 4.13. Maximum (a) and minimum (b) principal stresses of model MODTRIAL ... 56
Figure 4.14. First (a), second (b), third (c), fourth (d), fifth (e) and sixth (f) mode shapes of numerical model MODTRIAL ... 57
Figure 4.15. Qualitative comparison between model MODTRIAL and experimental mode shapes . 58
Figure 4.16. Definition of the numerical model MODDEF (NO APSE) ... 59
Figure 4.17. First (a), second (b), third (c), fourth (d), fifth (e) and sixth (f) mode shapes of model MODDEF (NO APSE) ... 60
Figure 4.18. Interior (a) and exterior (b) views of the walls in the North façade, and cross section view (c) of the walls in the west façade ... 61
Figure 4.19. Definition of Numerical Model MODTRIAL1 ... 62
Figure 4.20. Maximum (a) and minimum (b) principal stresses of model MODTRIAL1 ... 62
Figure 4.21. First (a), second (b), third (c), fourth (d), fifth (e) and sixth (f) mode shapes of numerical model MODTRIAL1 ... 63
Figure 4.22. Qualitative comparison between model MODTRIAL1 and experimental mode shapes 64
Figure 4.23. Definition of Numerical Model MODTRIAL2 (a) and blind arch located in West façade (b)... ... 65
Figure 4.24. Maximum (a) and minimum (b) principal stresses of model MODTRIAL2 ... 66
Figure 4.25. First (a), second (b), third (c), fourth (d), fifth (e) and sixth (f) mode shapes of numerical model MODTRIAL2 ... 67
Figure 4.26. Qualitative comparison between model MODTRIAL2 and experimental mode shapes 67
Figure 4.27. Three different zones in the walls of the church with a possible difference in the stiffness... ... 69
Figure 4.28. Maximum (a) and minimum (b) principal stresses of model MODTRIAL3 ... 70
Figure 4.29. First (a), second (b), third (c), fourth (d), fifth (e) and sixth (f) mode shapes of numerical model MODTRIAL3 ... 71
Figure 4.30. Qualitative comparison between model MODTRIAL3 and experimental mode shapes 72
Figure 4.31. Model definition (a) of possible weakness in connection between North and West façades in the upper part of the wall (b) ... 73
Figure 4.34. Qualitative comparison between model MODTRIAL3-A and experimental mode shapes... ... 76
Figure 4.35. Model definition (a) of possible weakness in connection between North and West façades and damage in the lower part of the wall (b) ... 77
Figure 4.36. Maximum (a) and minimum (b) principal stresses of model MODTRIAL3-B ... 78
Figure 4.37. First (a), second (b), third (c), fourth (d), fifth (e) and sixth (f) mode shapes of numerical model MODTRIAL3-B ... 79
Figure 4.38. Qualitative comparison between model MODTRIAL3-B and experimental mode shapes... ... 79
Figure 4.39. Plan view of the church (a) with the numbering of the buttresses. Photos of East façade buttresses (b) and North façade buttresses (c) ... 81
Figure 4.40. Maximum (a) and minimum (b) principal stresses of model MODTRIAL3-D ... 84
Figure 4.41. First (a), second (b), third (c), fourth (d), fifth (e) and sixth (f) mode shapes of numerical model MODTRIAL3-D ... 84
Figure 4.42. Qualitative comparison between model MODTRIAL3-D and experimental mode shapes... ... 85
Figure 5.1. Maximum (a) and minimum (b) principal stresses of model MODTRIAL2 after calibration... ... 93
Figure 5.2. Qualitative comparison between model MODTRIAL2 (After calibration) and experimental mode shapes ... 94
Figure 5.3. Maximum (a) and minimum (b) principal stresses of model MODTRIAL3-D after calibration... ... 98
Figure 5.4. Qualitative comparison between model MODTRIAL3-D after calibration and experimental mode shapes ... 98
Figure 5.5. Graphical comparison of mode shapes displacements between the experimental and numerical data for models MODTRIAL2 (a) and MODTRIAL3-D (b) after calibration process ... 101
Figure 6.1. (a) Orientation of the axes in global direction and selected top nodes to measure displacement and (b) plan view of principal axes orientation located in the center of mass ... 104
Figure 6.2. (a) Tensile behavior, (b) compressive behavior and (c) shear behavior adopted for masonry (DIANA, 2008)... 105
Figure 6.3. Integration Scheme: (a) in-plane for triangular element CT30S, (b) in-plane for quadrilateral element CQ40S and (c) in thickness direction for both element types (DIANA, 2008) .. 108
Figure 6.4. Scheme of Regular Newton-Raphson iteration method (DIANA, 2008) ... 109
Figure 6.5. (a) Capacity curve of pushover analysis in X global direction, (b) applied load direction and (c) selected control point ... 110
Figure 6.6. Principal tensile strains at stage (1) of the capacity curve calculated at (a) bottom and (b) top surfaces of the shell elements for pushover in X global direction ... 111
Figure 6.7. Principal tensile strains at stage (2) of the capacity curve calculated at (a) bottom and (b) top surfaces of the shell elements for pushover in X global direction... 112
Figure 6.8. Principal tensile strains at stage (3) of the capacity curve calculated at (a) bottom and (b) top surfaces of the shell elements for pushover in X global direction... 112
Figure 6.9. Principal tensile strains at stage (4) of the capacity curve calculated at (a) bottom and (b) top surfaces of the shell elements for pushover in X global direction... 113
Figure 6.10. (a) Capacity curve of pushover analysis in -X global direction, (b) applied load direction and (c) selected control point ... 114
Figure 6.11. Principal tensile strains at stage (1) of the capacity curve calculated at (a) bottom and (b) top surfaces of the shell elements for pushover in -X global direction ... 115
Figure 6.12. Principal tensile strains at stage (2) of the capacity curve calculated at (a) bottom and (b) top surfaces of the shell elements for pushover in -X global direction ... 116
Figure 6.13. Principal tensile strains at stage (3) of the capacity curve calculated at (a) bottom and (b) top surfaces of the shell elements for pushover in -X global direction ... 116
Figure 6.14. Principal tensile strains at stage (4) of the capacity curve calculated at (a) bottom and (b) top surfaces of the shell elements for pushover in -X global direction ... 117
Figure 6.15. (a) Capacity curve of pushover analysis in Y global direction, (b) applied load direction and (c) selected control point ... 118
Figure 6.16. Principal tensile strains at stage (1) of the capacity curve calculated at (a) bottom and (b) top surfaces of the shell elements for pushover in Y global direction... 119
Figure 6.17. Principal tensile strains at stage (2) of the capacity curve calculated at (a) bottom and (b) top surfaces of the shell elements for pushover in Y global direction... 119
Figure 6.18. Principal tensile strains at stage (3) of the capacity curve calculated at (a) bottom and (b) top surfaces of the shell elements for pushover in Y global direction... 120
Figure 6.19. (a) Capacity curve of pushover analysis in -Y global direction, (b) applied load direction and (c) selected control point ... 121
Figure 6.20. Principal tensile strains at stage (1) of the capacity curve calculated at (a) bottom and (b) top surfaces of the shell elements for pushover in -Y global direction ... 122
Figure 6.21. Principal tensile strains at stage (2) of the capacity curve calculated at (a) bottom and (b) top surfaces of the shell elements for pushover in -Y global direction ... 122
Figure 6.22. Principal tensile strains at stage (3) of the capacity curve calculated at (a) bottom and (b) top surfaces of the shell elements for pushover in -Y global direction ... 123
Figure 6.23. Principal tensile strains at stage (4) of the capacity curve calculated at (a) bottom and (b) top surfaces of the shell elements for pushover in -Y global direction ... 123
Figure 6.24. Principal tensile strains at stage (5) of the capacity curve calculated at (a) bottom and (b) top surfaces of the shell elements for pushover in Pushover in -Y global direction ... 124
Figure 6.26. (a) Capacity curve of pushover analysis proportional to 1st mode, (b) applied load direction and (c) selected control point ... 126
Figure 6.27. Principal tensile strains at stage (1) of the capacity curve calculated at (a) bottom and (b) top surfaces of the shell elements for pushover proportional to 1st mode ... 127
Figure 6.28. Principal tensile strains at stage (2) of the capacity curve calculated at (a) bottom and (b) top surfaces of the shell elements for pushover proportional to 1st mode ... 127
Figure 6.29. Principal tensile strains at stage (3) of the capacity curve calculated at (a) bottom and (b) top surfaces of the shell elements for pushover proportional to 1st mode ... 128
Figure 6.30. Principal tensile strains at stage (4) of the capacity curve calculated at (a) bottom and (b) top surfaces of the shell elements for pushover proportional to 1st mode ... 128 Figure 6.31. (a) Capacity curve of pushover analysis proportional to 3rd mode, (b) applied load direction and (c) selected control point ... 129
Figure 6.32. Principal tensile strains at stage (1) of the capacity curve calculated at (a) bottom and (b) top surfaces of the shell elements for pushover proportional to 3rd mode ... 130
Figure 6.33. Principal tensile strains at stage (2) of the capacity curve calculated at (a) bottom and (b) top surfaces of the shell elements for pushover proportional to 3rd mode ... 130
Figure 6.34. Principal tensile strains at stage (3) of the capacity curve calculated at (a) bottom and (b) top surfaces of the shell elements for pushover proportional to 3rd mode ... 131 Figure 6.35. (a) Capacity curve of pushover analysis in X’ direction, (b) applied load direction and (c) selected control point ... 133
Figure 6.36. Principal tensile strains at stage (1) of the capacity curve calculated at (a) bottom and (b) top surfaces of the shell elements for pushover in X’ direction ... 134
Figure 6.37. Principal tensile strains at stage (2) of the capacity curve calculated at (a) bottom and (b) top surfaces of the shell elements for pushover in X’ direction ... 134
Figure 6.38. Principal tensile strains at stage (3) of the capacity curve calculated at (a) bottom and (b) top surfaces of the shell elements for pushover in X’ direction ... 135
Figure 6.39. (a) Capacity curve of pushover analysis in –X’ direction , (b) applied load direction and (c) selected control point ... 136
Figure 6.40. Principal tensile strains at stage (1) of the capacity curve calculated at (a) bottom and (b) top surfaces of the shell elements for pushover in –X’ direction ... 137
Figure 6.41. Principal tensile strains at stage (2) of the capacity curve calculated at (a) bottom and (b) top surfaces of the shell elements for pushover in –X’direction ... 137
Figure 6.42. Principal tensile strains at stage (3) of the capacity curve calculated at (a) bottom and (b) top surfaces of the shell elements for pushover in –X’ direction ... 138
Figure 6.43. (a) Capacity curve of pushover analysis in Y’ direction, (b) applied load direction and (c) selected control point ... 139
Figure 6.44. Principal tensile strains at stage (1) of the capacity curve calculated at (a) bottom and (b) top surfaces of the shell elements for pushover in Y’ direction ... 139
Figure 6.45. Principal tensile strains at stage (2) of the capacity curve calculated at (a) bottom and (b) top surfaces of the shell elements for pushover in Y’ direction ... 140
Figure 6.46. (a) Capacity curve of Pushover analysis in –Y’ direction, (b) applied load direction and (c) selected control point ... 141
Figure 6.47. Principal tensile strains at stage (1) of the capacity curve calculated at (a) bottom and (b) top surfaces of the shell elements for pushover in –Y’ direction ... 142
Figure 6.48. Principal tensile strains at stage (2) of the capacity curve calculated at (a) bottom and (b) top surfaces of the shell elements for pushover in –Y’ direction ... 142
Figure 7.1. Shape of the elastic response spectrum defined in (EN 1998-1, 2004) ... 145
Figure 7.2. Values of the parameters that describe elastic response spectrum type1 (CYS EN 1998-1:2005, 2007) ... 146
Figure 7.3. Elastic response spectrum for Famagusta and ground conditions type E ... 146
Figure 7.4. Earthquake 1 artificial accelerograms (in each global direction) with the applied time history of displacements ... 147
Figure 7.5. Earthquake 2 artificial accelerograms (in each global direction) with the applied time history of displacements ... 148
Figure 7.6. Elastic response spectrum: (a) in X direction and (b) in Y direction ... 148
Figure 7.7. Rayleigh damping distribution along the modes for coefficients equal to 1.37432 and 0.00065... 151
Figure 7.8. Principal tensile strains distribution (damage progress) along different time steps: (a) 4.96s, (b) 7.46s, (c) 12.50s and (d) 15.00s for the Earthquake 1 ... 154
Figure 7.9. Output of the scan of the maximum principal tensile strains along all the time steps for Earthquake 1 calculated for (a) bottom and (b) top surfaces of shell elements ... 155
Figure 7.10. Load coefficient evolution in X direction along time for Earthquake 1 in (a) node 918 and (b) node 1831 ... 155
Figure 7.11. Load coefficient evolution in Y direction along time for Earthquake 1 in (a) node 195 and (b) node 3005 ... 156
Figure 7.12. Principal tensile strains distribution (damage progress) along different time steps: (a) 7.46s, (b) 9.96s, (c) 12.50s and (d) 15.00s for the Earthquake 2 ... 157
Figure 7.13. Output of the scan of the maximum principal tensile strains along all the time steps for Earthquake 2 calculated for (a) bottom and (b) top surfaces of shell elements ... 158
Figure 7.14. Load coefficient evolution in X direction along time for Earthquake 2 in (a) node 918 and (b) node 1831 ... 159
Figure 7.15. Load coefficient evolution in Y direction along time for Earthquake 2 in (a) node 195 and (b) node 3005 ... 159
LIST OF TABLES
Table 2.1. Catastrophic and Damaging Earthquakes on Cyprus 1896-2000 (Unit of Environmental Studies, 2004). ... 11
Table 3.1. Results from the kinematic analysis of the collapse mechanism CM_W_X and CM_W_Y... ... 29
Table 3.2. Results from the kinematic analysis of the collapse mechanism CM_N_X ... 32
Table 3.3. Results from the kinematic analysis of the collapse mechanisms (CM_A5_X), (CM_A5_RY), (CM_A67_Y), (CM_A8_X) and (CM_A8_RX) ... 38
Table 4.1. Physical and material properties used in models MODDEF and MODDEF (VAULTS) 46
Table 4.2. Comparison between experimental and numerical results in model MODDEF ... 48
Table 4.3. Comparison between experimental and numerical results in model MODDEF (VAULTS)... ... 52
Table 4.4. Additional masses used in the numerical model MODTRIAL ... 53
Table 4.5. Physical and material properties used in model MODTRIAL ... 55
Table 4.6. Comparison between experimental and numerical results in model MODTRIAL ... 58
Table 4.7. Material and physical properties used for model MODTRIAL1 ... 61
Table 4.8. Comparison between experimental and numerical results in model MODTRIAL1 ... 64
Table 4.9. Material and physical properties used for model MODTRIAL2 ... 65
Table 4.10. Comparison between experimental and numerical results in model MODTRIAL2 ... 68
Table 4.11. Material and physical properties used for model MODTRIAL3 ... 70
Table 4.12. Comparison between experimental and numerical results in model MODTRIAL3 ... 72
Table 4.13. Material and physical properties used for model MODTRIAL3-A ... 73
Table 4.14. Comparison between experimental and numerical results in model MODTRIAL3-A ... 76
Table 4.15. Material and physical properties used for model MODTRIAL3-B ... 77
Table 4.16. Comparison between experimental and numerical results in model MODTRIAL3-B ... 80
Table 4.17. Values of Elastic modulus according to the equation 4.14... 82
Table 4.18. Material and physical properties used for model MODTRIAL3-D ... 83
Table 4.19. Comparison between experimental and numerical results in model MODTRIAL3-D ... 85
Table 4.20. Comparison between the different models in terms of frequency estimation error and mode shape correlation (MAC) ... 86
Table 5.1. Base values, upper and lower bounds of the calibration variables of model MODTRIAL2.... ... 91
Table 5.2. Frequency values for the different combination of variables model MODTRIAL2 calibration MODTRIAL2 (b: base value, lower: lower bound and upper: upper bound) ... 92
Table 5.5. Comparison between experimental and numerical results in model MODTRIAL2 after calibration... ... 94
Table 5.6. Base, upper and lower values of the calibration variables of model MODTRIAL3-D .... 95
Table 5.7. Frequency values for the different combination of variables in the calibration of model MODTRIAL3-D (b: base value, lower: lower bound and upper: upper bound) ... 95
Table 5.8. Calibration constants for model MODTRIAL3-D ... 96
Table 5.9. Material and physical properties for model MODTRIAL3-D after model calibration ... 97
Table 5.10. Comparison between experimental and numerical results in model MODTRIAL3-D after calibration... ... 99
Table 5.11. Comparison between the different models in terms of frequency estimation error and mode shape correlation (MAC) ... 100
Table 6.1. Non linear properties used in the pushover and dynamic analyses ... 106
Table 6.2. Moment of inertia along the principal axes and principal axes orientation ... 132
1. INTRODUCTION
The city of Famagusta, located in Cyprus island, has been since many centuries ago a strategic location for the commercial interchange between the West and the East, and also a religious center for both Islamic and Christian people. All of this is reflected in its historical constructions, which have been built by several communities as Armenian, Jewish, Nestorian, Maronite and Jacobite. The heritage treasures of this city include several impressive examples of gothic style as medieval churches as well as mosques and military buildings with some impressive city walls. Once, Famagusta was known as the most important city in the world, where very rich people used to live, but now the city is completely abandoned and neglected and threatened by earthquakes. Besides, it was place on the 2008 World Monuments Watch List of 100 Most Endangered Sites by the World Monument Fund.
A joint collaboration between University of Minho, Eastern Mediterranean University (EMU) and the Municipality of Famagusta was established with the aim to analyze the stability of the Medieval Churches. A previous work on visual inspection and non-destructive testing was carried out by (Lourenço & Ramos, 2008), which included three churches: (a) St. George of the Latins; (b) St. George of the Greeks and (c) The Carmelite Church. The obtained results of this work provide a basis for the studies regarding the safety assessment of the churches; nevertheless the stability assessment under gravity loads and seismic loads was not carried out. Appealing for the claim of the world to save Famagusta heritage, the stability assessment of Saint George of the Latins church under gravity loading and earthquake loading was performed.
Due to the complex nature of historical constructions a scientific approach is required to understand its behavior and its response to external actions. Therefore structural analysis is one of the four different tools among: history, inspection of the present condition, monitoring and structural modeling, which can be considered to investigate a historical structure. The contribution of structural analysis is essential in combination with the other tools because it contributes with the possibility of simulating the performance of the structure when subjected to past actions and thus conclude about their possible influence on the present condition and existing damage (Roca & Kabele, 2008-2009).
Modeling often takes the form of mathematical formulations, which may be solved by computers, therefore the analysis lose control of the situation. Furthermore, simple models are still needed to check and assess results. This can also be justified by the need to obtain difficult material properties and boundary conditions among the structure. The structural model must take into account all the aspects that influence the structural response such as geometry, material properties, actions, exiting alterations and damages, and the interaction of the structure with the soil (Roca & Kabele, 2008-2009).
The hypotheses are implicitly formulated by the considerations taken into account during the construction of the structural model. Finally the model is validated by comparing the results with the empirical evidence provided by history, inspection and monitoring. Once the model is validated, it will be used to predict unknown aspects of the structural response such as seismic capacity (Roca & Kabele, 2008-2009).
Within this process important considerations arise and they are: the extension of the validation, the level of validation, the application of different actions from those used in the validation process and the available possibilities to calibrate the models. Those are inherent uncertainties and there is space for subjectivity and they should be based on experience and judgment of the analysts (Roca & Kabele, 2008-2009).
There are several challenges posed by historical heritage: (i) the material characterization is complex and the mechanical properties and strength are variable along the direction; (ii) the geometry usually is rather complex composed by domes, arches, vaults and other slender or massive members; (iii) the morphology and connections are non-homogenous caused by fillings, cavities, insertions; (iv) actions of different nature that act along historical time (centuries), specially characterized by long returned periods; (v) the real condition of the structure require the simulation of damages and deformed and cracked members; (vi) the data acquisition is limited by the respect of the original conditions of the monument and non destructive and minor destructive tests are available with limited scope; (vii) by the history it is possible to know the construction process, later alterations and additions, documented destruction, reported natural actions, etc (Roca & Kabele, 2008-2009)
Applying the scientific approach to analyze the structure; taking into account historical and empirical information and the limitations posed by historical heritage; the assess of stability under gravity and seismic loadings was carried out for Saint George of the Latins church using different levels of approach from the simplest to the complex one in terms of analyses procedures and comparing the results obtained by the different approaches.
First, a very brief state of the art was done including the history of Famagusta, its seismic hazard and the actual conditions of the church as well as some historical facts. In a subsequent step, the safety assessment of the church using collapse mechanism limit analysis was carried out, both force based and displacement based.
A next step was to model the church using finite elements and the available information from the inspection and diagnosis report carried out by (Lourenço & Ramos, 2008). For this purpose, model updating using the available dynamic identification results was carried out. After having the model calibrated, it was subjected to a push-over analysis in using two different load patterns: (1) an uniform pattern based on lateral forces that are proportional to the mass regardless their height distribution among the structure and (2) a modal pattern proportional to lateral forces consistent with the lateral force distribution determined in the modal response. The results were compared with the collapse limit
analysis. A third pushover analysis was performed in the direction of the principal axes and the results were also compared with the previous analyses results.
The final step was to carry out advanced dynamic analysis using time integration non-linear dynamic analysis using two different earthquakes with different peak ground accelerations. The results were compared with the results of the collapse limit analysis and the standard pushover analysis. At the end of the report, several conclusions and recommendations on further works are made based on the experience and inconvenient suffered along the process.
The thesis is organized in 9 chapters as follows:
• Chapter 1: Presents the motivation, the aim, the scope and the methodology for approach to the problem.
• Chapter 2: Presents a brief review on the state of the art, including a short history of Famagusta, the seismic hazard in Cyprus and Famagusta and the general description of Saint George of the Latins church, its present conditions and the experimental tests carried out on it. • Chapter 3: Presents the limit analysis of the defined collapse mechanism by the kinematic
approach; both displacement based and force based.
• Chapter 4: Presents the definitions of the model, with all the attempts to represent the real conditions of the structure (damages and deterioration).
• Chapter 5: Presents the process to calibrate the modal response of the model based on the results of dynamic identification tests.
• Chapter 6: Presents the pushover analyses carried out in the global directions, the principal directions and following the modal pattern distribution.
• Chapter 7: Presents the non-linear dynamic analysis which was performed using two different earthquakes with different intensities.
• Chapter 8: Presents several conclusions made about the applied process, the results of each analysis approach, the calibration of the model, the numerical procedures and the material properties. Also some recommendation about further works that can be carried out to improve the obtained results and to have a better approach to face the problem.
2. STATE OF THE ART
2.1 LOCATION AND HISTORY FAMAGUSTA
Cyprus Island is located in the Eastern portion of the Mediterranean Sea; south of Turkey, west of Syria, Lebanon, and Israel, east of Greece, and north of Egypt; its location is shown in Figure 2.1. It is the third largest island in the Mediterranean and the world’s 81st largest one (Republic of Cyprus, Ministry of Finance, 2006). It is located at a confluence of Western Asia, Southern Europe and Northern Africa and has had periods of influence of several dynasties such as Byzantine, Lusignan, Genoese, Venetian, Ottoman and British. At the same time it has been the home of Armenian, Jewish, Nestorian, Maronite and Jacobite communities (Walsh, 2007). The city of Famagusta is located in North-East Cyprus, it has been over many centuries at the crossroads between the West and the East, and has played a pivotal role between the Christian and Islamic Worlds
Figure 2.1. Location of Cyprus Island and Famagusta (Google, 2009)
The first city that appeared in the East coast of Cyprus was Enkomi, around 16th century B.C. This small town was dependant on the exportation of copper, which was easily commercialized thanks to the port located nearby the town. The city became an important center of distribution because of the
Salamis was the capital of the Island for more than one thousand years and was considered one of the most important sites in the Mediterranean. During the 13th century B.C, the Greek colonists established themselves and introduced the Western culture to the island; hence it was open to commercial and cultural exchanges between the Western World and the Near East. At the end of the 8th century, the island was a bastion of the Hellenic culture but later on during year 525 B.C., Cyprus surrendered to the Persians and became a tributary province of Persian Empire. After several years of Persian rules, the Island control went back to the Greeks during year 411 B.C., and the Island became an independent kingdom. The Greeks established the peace with the Persians by paying them an annual tribute. They were able to accumulate health and embark, by means of several works including fortification of the walls of the city, which elevated Salamis to the wondrous splendor (Municipality of Famagusta, 2009).
In year 294 B.C., Ptolemy I conquered Cyprus and incorporated into his kingdom. Later on, his son founded three cities with the name of his sister Arsinoe, one of them was located next to Salamis. Arsinoe and the harbor were built during year 274 B.C. since Salamis had been destroyed by earthquakes. In fact, the complete destruction of Salamis came about in 332 and 342 A.D after consecutive earthquakes stroke the city. Emperor Constantios II took control of the Eastern Roman state and assisted in the reconstruction of the city under the Christian name of Constantia. The city became a religious and administrative metropolis, and recovers its forms size and grandeur, as that of Salamis. Constantia played an important role for the Christianity; as Apostles Paul and Barnabas embarked on their first missionary enterprise and preached in the synagogues of the city. After Barnabas death and from year 396 on, Cyprus was part of the Eastern Byzantine Empire, hereby the Patriarch decided to grant autonomy to Cyprus church because he offered to the Emperor the original of St Matthew’s hand written gospel that he found on Barnabas chest. (Municipality of Famagusta, 2009).
The Arabs’ sudden incursion started at the middle of 7th century finished with the destruction of Constantia and Arsinoe; which were permanent abandoned. Arabs gained the complete command of the Eastern Mediterranean and the privileged position of Cyprus made it possible that the Island was not affected by the war and, just the opposite, it played an important role. First, the island was proclaimed as neutral territory, but later on the Arabs secured the island for themselves, and they transfered the peoples from Constantia to Asia Minor. The Arabs raids lasted until year 965, when Nicephorous Phocas forced them to leave, being Salamis-Constantia completely abandoned, and Famagusta was established a few kilometers to the south of its original place (Municipality of Famagusta, 2009).
Figure 2.2. Famagusta city by (Miller, 1735)
There is a gap in the history of Famagusta from the 3rd century to year 1200, with no material that could give information on Byzantine Famagusta (Municipality of Famagusta, 2009). There are some written source dated from the end of the 12th century but there is no relevant information regarding the city.
Between years 1191 and 1489, Famagusta played an important role in the Lusignan dynasty becoming the largest distribution center of western products to the east. Also it was the harbor with most activity and the most beautiful city in Cyprus. The most magnificent period of the city occurred after the fall of Acre in 1291 (Walsh, 2007) when Christian refugees settled in Famagusta. During this time, the great fortification works were undertaken; the harbor, the castle, the bastions and the tower were built to protect the inner part of the harbor. The city was divided in two quarters; the Latin Quarter in the north-east part of the city and the Orthodox quarter located in the south-east part
Between 1300 and 1370 Famagusta was a most glamorous city due to the presence of powerful merchants; it became the most important port for eastern trade in the Mediterranean. Around 300 churches were built during this period, including The Cathedral of St. Nicholas where the crusader kings were crowned (Walsh, 2007) and St George of the Greeks, which are two examples of Orthodox cathedrals. They were surrounded by many churches and houses built in the finest Gothic style (Walsh, 2007). The splendor came down during the middle of the 14th century after the epidemic Black Death, and also when a conflict of interest arose between Genoese and Venetian (Municipality of
In 1374, the Genoese sent their troops to Famagusta and destroyed a huge part of the city. They arrested the King and forced him to pay a huge indemnity. This was the beginning of the fall of Famagusta; hence all the economical and commercial activity was gradually disappearing. During the subsequent 90 years, the City and the harbor were under Genoese rules (Municipality of Famagusta, 2009). After four years of blockade, the Lusignans were able to get rid from the Genoese and due to the marriage between King of Cyprus with the “daughter of St. Mark”, patron saint of Venice, Cyprus lead Venice to consolidate its position in the Eastern Mediterranean. After this king’s death, the Queen was forced to concede the power to the Vice Admiral of the Venetian Republic, in a ceremony that took place in the Cathedral of St Nicolas (Municipality of Famagusta, 2009).
The Venetian took over the island which was strategically important for its war against the Ottomans, especially after the fall of Constantinople. The domination of Cyprus lead Venice to gain commercial, economic and political power in the Eastern Mediterranean; but the city itself was completely abandoned and people was living in miserable conditions. In order to safeguard the city from the Ottomans, the Venetian decided to strength the defensive structures of Famagusta. They brought expert masons and engineers to restructure the walls of the city and the Othello tower (Walsh, 2007) and to build another important structures, such as the castle of the harbor, new bastions (the Ravelin, the Tower of the Arsenal and Martinengo) and a string of islets and rocks and two towers to protect the inner harbor (Municipality of Famagusta, 2009).
Despite the restoration and improvement works to make the city safe, the Ottomans took control in 1571 after a long period of attacks that ended in the defeat of the city. The Venetians negotiated an agreement that allowed the Christian Greeks to stay in the city under Ottoman control. However they did not keep up their promise and they destroyed almost everything they found. Then, the Greeks went southwards and take refuge in fields where they founded the New Famagusta. From 1571 on, Ottoman occupation began and no Christian was allowed within the walls, neither Christian ships could approach the harbor; the situation led the city to an inevitable decline (Municipality of Famagusta, 2009).
Four and a half centuries of neglect combined with exposure to hard environmental conditions and natural phenomena such as earthquakes, plague and flooding left the city almost ruined by the time the British arrived in 1878 (Walsh, 2007); the historical sites and treasures of the city were completely destroyed. Despite the ambitious British’ plan for restoration of Famagusta, there were only few restoration works carried out and the British gave priority to new prospects that were opened for trading (Municipality of Famagusta, 2009). However, after the Second World War, a new era started in Famagusta, its population increased significantly and the city expanded. The inhabitants start to build their houses again and the sea font started to be filled with hotels, which was a first re-birth for the city in intellectual and economical terms.
Once again, the city was taken apart during 1974, when the Turkish troops entered to the north part of the Island and took control of Famagusta. Nowadays, Cyprus is divided in two different territories; one
is the self-proclaimed Turkish Republic of Northern Cyprus, which is not internationally accepted and the other is the Greek section of the island which is fully recognized internationally and it is part of the European Union. The present conditions have leaded the Northern Cyprus un-funded and un-assisted, with the exception of substantial financial aid from Turkish government. Hence the Cultural heritage of the city has been neglected for over three decades, it serves as politically motivated pawn (Walsh, 2007), and meanwhile there is a big effort to include several Famagusta’s cultural sites in an European Foundation in order to fund the conservation of specific monuments.
According to (Walsh, 2007) the sandstone which is the construction material of almost all the historic Monuments in Famagusta (Around 200) is highly deteriorated (see Figure 2.3), and the collapse of domes, arches and ribbed vaults will be inevitable if no action is taken, in particular, the exterior of St Nicolas Cathedral and St George of the Latins; one of the finest Gothic buildings of medieval Christendom. Due to severe state of deterioration, Famagusta was recently placed on the 2008 World Monuments Watch List of 100 Most Endangered Sites by the World Monument Fund (Lourenço & Ramos, 2008).
Numerous natural and man-made threats endangered the old city, mainly geotechnical instability, drainage problems, vegetation growth, presence of water, inappropriate prior conservation, neglect and inadequate maintenance, rapid development and haphazard town planning, and a lack of conservation expertise, and after a decade of continued neglect the result will be a further decline with possible catastrophic structural failures (Walsh, 2007).
(a) (b) (c)
Figure 2.3. General view of the state of conservation (2008) in (a) St George of the Latins Church, (b) St George of the Greeks Church and (c) Carmelite Church
2.2 FAMAGUSTA SEISMIC HAZARD
2.2.1 Tectonic Hazard
Cyprus is located in a tectonically complex zone where three continental plates assemble; they are the African plate to the south, the Eurasian plate to the north and the Arabian plate to the east. The movements between these three plates are: rifting (the plates separate from each other), collision (the plates move towards each other and collide or crash) and wrenching (the plates move parallel to each other but in different directions). The combination of all these movements has produced features in this region such as the Hellenic Arc to the west and its continuation to the east and Cyprus itself (the Troodos Ophiolite) (Unit of Environmental Studies, 2004).
The Alpine-Himalaya belt is the second most intensive seismic zone of the earth, where the earthquakes that occur represent about 15% of the world seismic activity, and Cyprus is located among this region, in the southern side of the Anatolian Plate. Its seismicity is attributed to the “Cyprus Arc” which is the tectonic boundary between the African and Eurasian plates (it extends from gulf of Antalia, passes from west to south of Cyprus and goes towards the Gulf of Isknedurn; see Figure 2.4). There is subduction of the African Plate under the Eurasian Plate; hereby many epicenters are concentrated along the arc because the tectonic movements are the main cause for earthquakes, some of them are strong. Recently, several active faults inside the island have shown that earthquakes also occur along them (Unit of Environmental Studies, 2004).
(a) (b)
Figure 2.4. (a) Lithospheric plates in the Cyprus region (Unit of Environmental Studies, 2004) and (b) Cyprus Arc estimation (Kythreoti & Pilakoutas, 2000)
2.2.2 Historical Records and Instrumental Records
According to several historical references and archaeological findings, Cyprus was stroke by strong earthquakes in the past, which destroyed and damaged towns such as Salamis (today’s Famagusta), Kition, Amathus, Kourion, Pafos and Nicosia. This data indicates that 16 earthquakes with intensities of VIII (on modified Mercalli scale) or higher occurred between years 26 B. C. and 1900 A. D., especially two of them had big impact in Salamis (today’s Famagusta) and destroyed the whole town; one occurred in 76 A. D. and the other occurred in 332 A. D. (Unit of Environmental Studies, 2004). It was only in year 1896 that more accurate data started to be collected when seismological stations started to operate on neighboring countries. Later on 1984, the accuracy and completeness of this data was improved by the establishment of a seismological station in Cyprus, therefore a continued expansion and upgrading began. Hereby the areas with high seismic activity among Cyprus territory were clearly recognized and during this time period (1896-2004) more than 400 earthquakes had epicenters on Cyprus and the surrounding region, with 14 of those causing severe damages as well as victims (Unit of Environmental Studies, 2004) as it is shown in Table 2.1. It is important to highlight that from those 14 strong earthquakes, 2 stroke Famagusta; one in February 18th of 1924 with a magnitude of 6.0 caused small damage in Famagusta and the other stroke in January 20th of 1941 and caused severe damage in the district of Famagusta.
Date Magnitude Description of damage
29/6/1896 6.5 Damage in the area of Limassol. Many aftershocks followed. 5/1/1900 5.7 Small damage in Mesaoria.
23/2/1906 5.3 Small damage in Limassol and Kolossi. Felt all over the island. 18/2/1924 6.0 Small damage in Famagusta.
13/12/1927 5.0 Small damage in Limassol and in villages to the north. 9/5/1930 5.4 Damage in Pafos and the surrounding area.
26/6/1937 4.7 Damage in southwest Cyprus.
20/1/1941 5.9 Severe damage in the district of Famagusta, especially at Paralimni, where 24 people were injured and many houses collapsed. Limited damage in the districts of Nicosia, Larnaca and Kyrenia.
10/9/1953 6.1 Destructive earthquake in the district of Pafos with 63 dead, 200 injured and 4000 homeless. Many houses were destroyed in 158 villages.
15/1/1961 5.7 Small damage in Larnaca town and the surrounding area. 28/3/1984 4.5 Small damage in the town and district of Larnaca.
23/2/1995 5.7 Destructive earthquake in the Pafos district with two dead. Many houses collapsed in the nearby villages.
9/10/1996 6.5 Very strong earthquake in the southwest of Cyprus (Pafos, Limassol, Nicosia, Larnaca and Paralimni). Twenty people were slightly injured and two lost their lives from indirect causes. Limited damage in Pafos and Limassol.
11/8/1999 5.6
Strong earthquake close to Gerasa caused damage to buildings in Limassol and the villages to the north of the town. Felt all over Cyprus. Forty people were slightly injured. Many aftershocks followed.
Regarding all the earthquakes within the island, the most catastrophic earthquakes were those of 1941, 1953, 1995, 1996 and 1999. The study of these records has shown that the distribution along time of Cyprus seismic activity is not regular, with intense periods following by calm periods. For instance, there was an important increase in seismic activity between years 1995 and 1999, when several strong earthquakes stroke the island with magnitudes ranging from 5.6 to 6.5 (Unit of Environmental Studies, 2004). A spatial distribution of catastrophic and damaging earthquakes is shown in Figure 2.5 where it is important to highlight the presence of one earthquake near Famagusta region with magnitude between 5.3 and 6.0.
Figure 2.5. Distribution of catastrophic and damaging earthquakes on Cyprus between 1896 and 2000 (Unit of Environmental Studies, 2004)
2.2.3 Earthquake Vulnerable Areas
Notwithstanding that Cyprus lies in high activity seismic zone, the area where most number of historical records and instrumental data has been recorded is the coastal zone that extends from Pafos through Limassol and Larnaca and then to Famagusta. Large number of medium to strong earthquakes have epicenters in the sea, which may cause small to negligible damage, but many other earthquakes have epicenter in the west and south regions of the island, affecting more these areas of the country rather than the others (Unit of Environmental Studies, 2004). According to the Seismic Hazard Map of Cyprus (shown in Figure 2.6), the maximum peak ground acceleration (PGA) on rock for the south and west regions, where Famagusta is included, is about 0.25g. This value is the highest within the whole territory compared with the minimum PGA of 0.15g, which is shown in the north and center regions.
Figure 2.6. Definition of reference peak ground acceleration (PGA) on rock among Cyprus territory (CYS EN 1998-1:2005, 2007)
Another important parameter that increases the vulnerability of a region is the ground condition. In this manner, areas covered with loose deposit, mainly coast areas are more vulnerable than areas that are wholesale covered of rock, such as the center of the territory (Unit of Environmental Studies, 2004), meaning that Famagusta is more prone to have strong impact of earthquakes. According to Figure 2.7, Famagusta is located over Terrace deposits which are mainly formed by Calcarenites, sands and gravels.
2.3 SAINT GEORGE OF THE LATINS CHURCH
2.3.1 General description
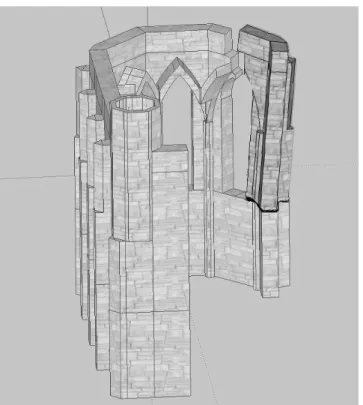
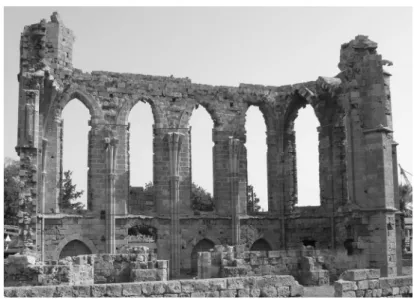
The Church of Saint George of the Latins is located inside the city walls, in front of Citadel Othello’s tower, in Kapou Street, however, it seems that it was built before the city was walled because it has been a fortified church (Supporting Activities that Value the enviroment, 2008); its location within the city is circled and it is shown in Figure 2.8. Although is in a ruinous state of preservation, there is enough evidence to demonstrate that this building is an impressive example of Gothic architecture with excellent masonry because all the church was built with three-leaf masonry, with ruble masonry inside and carved sandstone blocks joined together with thinner course of lime mortar as a veneer. It has compact proportions and rich stone carving decoration, hereby the superb quality of the masonry and workmanship suggests that it was built by master masons of the Cathedral workshop (Supporting Activities that Value the enviroment, 2008). The church however still preserves its northern half, the lower section of the apse and a part of its south side (Lourenço & Ramos, 2008).
Figure 2.8. Map of Famagusta with St. George of the Latins location (Enlart, 1913)
The church is dated to the end of the 13th century, and it is recorded to be the oldest building in Famagusta. Also it is recorded as one of the most picturesque because it is built in the best French style of the 13th century (Supporting Activities that Value the enviroment, 2008). Its layout is quite
simple because it is a single-aisled building with four groin vaults which are supported by a grouping of three thin columns located in the north and south walls. Like in most Gothic churches, it has large and high windows, which used to have carved stone decoration. The church has some impressive gargoyles depicting human figures and winged dragons. A small conch adorned with richly decorated pediments is formed in the church’s apse and was probably used to receive a sculpture (Lourenço & Ramos, 2008);
(a) (b)
Figure 2.9. Drawings carried out of (a) Front view of north Façade and (b) details on façade’s door (Kell, 1982)
A geometrical survey of the church was carried out by (Lourenço & Ramos, 2008) using a laser distance meter and drawings obtained from (Kell, 1982). The church has 20.00 meters long and 8.91 meters of internal width, the separation inside two consecutive buttresses is about 3.52 meters, it has a lateral chapel which perimeter measures are 3.84, 5.43 and 4.89 meters and the width of the walls varies according to the element of the church. The Buttresses thickness is between 0.90 and 0.96 meters, the North façade and Apse thickness is about 1.02 meters and the West façade thickness is about 1.29 meters; with its plan arrangement shown in Figure 2.10-a. The height from the ground to the windows cornice is ranging from 4.55 to 4.87 meters, the height from the ground to the second cornice is about 13.60 meters, the mean height of the tower located in the connection between the West and the North façades is about 3.87 meters, the height of the windows is variable with values close to 7.24 meters and their width is between 1.80 and 1.85 meters; its height distribution is shown in Figure 2.10-b.
(a)
(b)
Figure 2.10. Geometrical survey of (a) church’s plane and (b) church’s height
2.3.2 Results from the Visual Inspection
According to the inspection works carried out by (Lourenço & Ramos, 2008), the present condition of the church seems not to differ significantly from the condition around 1940 (See Figure 2.11-a). Severe deterioration of the stones is reported in drawings from 1882 and several stones have been replaced in the conservation works around 1940 (see Figure 2.11-b)
(a) (b)
Figure 2.11. Historical photographs: (a) 1940 situation vs. current condition and (b) presence of new (lighter) stone (Lourenço & Ramos, 2008)
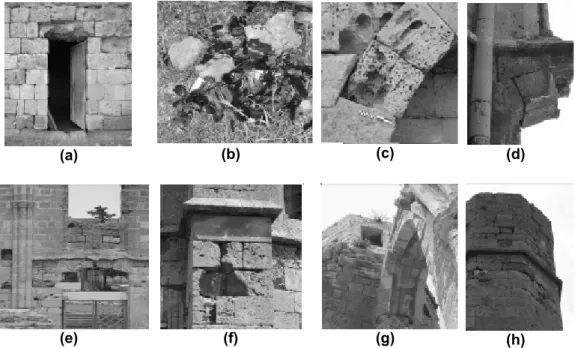
The present condition, shown in Figure 2.12, is characterized by: (a) & (b) lack of cleaning / possible misuse of one room (sacristy); (c) severe stone deterioration; (d) loose stone elements, which must be consolidated or removed; (e) highly corroded reinforced concrete lintel in main door; (f) inefficient buttresses due to stone deterioration; (g) & (h) a crack / rotation of the tower, possibly due to a previous earthquake / foundation problems (Lourenço & Ramos, 2008).
(a) (b) (c) (d)
(e) (f) (g) (h)
Figure 2.12. Details of current condition of the church from the inspection carried out by (Lourenço & Ramos, 2008)
2.3.3 Experimental results from dynamic Identification test
The dynamic identification analysis is a procedure that combines vibration testing techniques and analytical methods to determine modal parameters of structures, such as frequencies, mode shapes and damping coefficients. Those parameters are helpful to understand how a structure responds to dynamic excitations, such as earthquakes or winds, and to calibrate the computational model of a structure. With this purpose, output-only modal identification techniques were applied and the structure was excited with ambient vibration.
During the inspection on St. George of the Latins church in Famagusta city carried out by (Lourenço & Ramos, 2008), three accelerometers with 10 V/g sensitivity, able to measure 0.07mg (g is gravity