André Sobral de Castro Lopes
Licenciado em Ciências do Mar, ramo Ambiente
From consumption to production –
development of fisheries and
aquaculture in Portugal
Dissertação para obtenção do Grau de Mestre em Engenharia e Gestão da Água
Orientador: João Pedro Salgueiro Gomes Ferreira,
Professor Associado com Agregação, Faculdade de
Ciências e Tecnologia, Universidade Nova de Lisboa
Júri:
Presidente: Prof. Doutor Rui Jorge Fernandes Ferreira Santos Arguente: Engenheiro Carlos Alberto Garcia do Vale Vogal: Prof. Doutor João Pedro Salgueiro Gomes Ferreira
ii From consumption to production – development of fisheries and aquaculture in Portugal
Copyright © André Sobral de Castro Lopes, Faculdade de Ciências e Tecnologia, Universidade Nova de Lisboa.
iii
Acknowledgments
To my advisor, João Gomes Ferreira, who during the first classes made me remember why I’ve initially chosen Oceanography and Marine Sciences, and why I liked it.
To the thesis examiners, in particular Carlos Vale and Rui Ferreira dos Santos, for helpful comments and suggestions, and to Johan Johansen, for biometric conversion data for cod. To Ana Rodrigues, who also made me remember why I love the ocean. In addition she also told me to do something I liked for my thesis, which was an important part of my choice. The same goes for Cláudia, who told me: “If you have to do something so large and important, you might as well do it about something you like.”
To Pedro, for all the time, grammar corrections, constructive criticism and friendship.
To Carlos, Jorge, Daniel, Susana, Eduardo and Eva, thank you for all the friendship and for raising my standards.
To Mel for the long walks and being a good listener.
To Vanda, for all the pressure, tough love and for being a role model.
v
Abstract
Seafood is considered an important element of a healthy diet; therefore, worldwide consumption has been increasing. This growth has been partly based in the development of the aquaculture industry, which contrasts with the depleted status of an increasing number of fish stocks worldwide. Countries with high seafood consumption rates tend to develop high seafood deficits, as well as an external seafood dependency. In Portugal, roughly 2/3 of availability is met by imports. In addition, seafood consumption rates are the highest in Europe; the combination of these two factors puts considerable pressure on the seafood trade balance and the production sector.
Current consumption estimates only consider official availability data, by means of the apparent consumption method, which may induce errors in overall seafood consumption. Furthermore, the use of individual surveys has been shown to be a useful tool to obtain consumption data, regarding preferences and frequency of consumption. In order to estimate consumption, and the demand-based potential for an increase in production, a new methodology was developed. Official external trade volumes, as well as catch production and aquaculture yields, were combined with illegal fishing data, in order to estimate availability volumes. Therefore, through the integration of these estimates with the individual seafood consumption surveys, it was possible to estimate the growth potential of the aquaculture and fisheries sectors in Portugal.
Eight products (cod, sardine, hake, horse mackerel, tuna, salmon, gilthead seabream and European seabass), which encompass between 63% and 71% of total seafood consumption, were identified as the most consumed. The unmet seafood demand was estimated to be between 13 396 and 41 024 tonnes, which corresponds to a potential growth of the current Portuguese seafood market of between 2.5% and 7.6%. The most promising areas identified were in the farmed fish sector. Other axes of intervention, such as the mitigation of illegal fishing or the improvement of the ecological status of fish stocks, were also identified as promising areas in order to increase overall seafood production.
vii
Resumo
O peixe e outros produtos marinhos fazem parte de uma dieta saudável e equilibrada, daí o gradual aumento do seu consumo um pouco por todo o globo. Este aumento é em parte explicado pelo aumento da produção aquícola, o que contrasta com o debilitado estado de conservação dos stocks pesqueiros um pouco por todo o mundo. Os países com consumos elevados de peixe e outros produtos marinhos, por vezes desenvolvem um elevado défice comercial, e uma dependência externa para suprir a procura interna de pescado. No caso Português, aproximadamente 2/3 da disponibilidade de pescado é composta por importações, o que, combinado com o elevado consumo de peixe, coloca pressão sob a balança comercial, bem como sob o sector das pescas e aquacultura.
Os métodos actualmente aplicados para estimar o consumo de pescado, utilizam os dados oficiais de disponibilidade dos países, o que pode gerar erros nestas estimativas. Além disso, o uso de inquéritos individuais já foi comprovado como sendo um método válido para obter informação no que concerne as preferências e frequência de consumo de pescado. De forma a calcular o consumo, bem como potencial de aumento de produção, baseado na procura, uma nova metodologia foi desenvolvida. As estatísticas oficiais de importações e exportações de pescado, capturas e produção aquícola, foram compiladas com informação acerca de pesca ilegal, de forma a estimar o volume total de pescado disponível. Desta forma, e através da integração destas estimativas com inquéritos individuais sobre preferências de consumo, foi possível estimar o potencial de crescimento dos sectores da pesca e aquacultura Portugueses.
O consumo de peixe em Portugal é concentrado em oito produtos principais (bacalhau, sardinha, pescada, carapau, atum, salmão, dourada e robalo), que concentram entre 63% e 71% do consumo total de pescado. A procura não satisfeita de pescado em Portugal foi estimada entre as 13 396 e as 41 024 toneladas, o que corresponde a um crescimento potencial do actual sector de produção de pescado entre 2.5% e 7.6%. As mais promissoras oportunidades identificadas foram no sector da aquacultura. Outras áreas de intervenção foram também detectadas na redução da pesca ilegal e na melhoria ecológica dos stocks
pesqueiros explorados.
ix
Table of contents
1.
INTRODUCTION --- 1
1.1.
Problem definition --- 1
1.2.
Objectives and expected outcomes --- 2
1.3.
Thesis layout --- 2
2.
STATE OF THE ART --- 5
2.0.1.
Consumption and production in the seafood sector --- 5
2.0.2.
From wild to farmed fish --- 6
2.1.
European Union framework--- 7
2.1.1.
Portugal’s maritime dimension within
the EU --- 7
2.1.2.
Legal and political framework --- 9
2.1.2.1. Common Fisheries Policy (CFP) --- 9
2.1.2.2. European Maritime Fisheries Fund (EMFF) --- 11
2.1.2.3. Marine Spatial Planning (MSP) and the Marine Strategy Framework Directive (MSFD) 11 2.1.2.4. Maximum Sustainable Yield (MSY) --- 13
2.2.
Portuguese seafood sector --- 14
2.1.1
From history and tradition to politics and production --- 14
2.1.2
Shift in sourcing seafood and growth of the foreign fish deficit --- 16
2.1.2.1. Recent evolution of trade balance --- 22
2.1.3
Recent fisheries yields --- 25
2.1.4
Fishing effort reduction and fleet evolution --- 28
2.1.5
Impact of illegal, unreported and unregulated (IUU) catches --- 29
2.1.6
Historic seafood consumption --- 31
2.1.7
Aquaculture status in Portugal --- 33
2.1.6.1. Recent evolution of farmed species --- 35
3.
METHODOLOGY --- 39
3.0.1.
Data sources --- 40
3.1.
Section 1
–
From consumption to production --- 41
3.1.1.
Consumption --- 41
x
3.1.2.1. Internal production --- 47
3.1.2.2. IUU catches and discards --- 48
3.1.2.3. Foreign trade --- 48
3.1.3.
Total availability --- 48
3.1.4.
Aggregate availability and consumption data --- 49
3.2.
Section 2
–
Growth potential --- 50
4.
RESULTS --- 53
4.1.
From consumption to production --- 53
4.1.1.
Consumption volumes and identification of key species --- 53
4.1.2.
Consumption-availability aggregate and optimal consumption level --- 55
4.1.4.
Impacts of presentation over consumption and availability - Cod --- 59
4.1.5.
Product-specific analysis --- 64
4.1.5.1. Tuna --- 64
4.1.5.2. Horse mackerel --- 65
4.1.5.3. Hake --- 66
4.1.5.4. Gilthead seabream --- 67
4.1.5.5. Sardine--- 68
4.1.5.6. European Seabass --- 69
4.1.5.7. Salmon --- 70
4.1.6.
Seafood sector overview --- 71
4.2.
Growth potential --- 73
4.2.1.
Product classification according to origin --- 73
4.2.2.
Product classification according to consumption satisfied --- 74
4.2.3.
Potential assessment --- 76
5.
DISCUSSION --- 79
5.1
Strategic areas of intervention --- 80
5.1.1
Product valorisation --- 80
5.1.2
IUU control and mitigation --- 81
5.1.3
Biological stock status improvement --- 81
5.1.4
Farmed fish production--- 82
5.2
Alternative considerations --- 83
5.3
Consumption and live weight
–
importance of salted and dried cod --- 85
5.4
Issues --- 86
xi
6.1
Review --- 89
6.2
Future studies and developments --- 91
6.2.1
Portuguese farmed seafood sector growth --- 91
6.2.2
Extended application of methodology --- 93
xiii
List of figures
xvii
List of tables
xix
Acronyms list
CCMAR – Centro de Ciências do Mar
CEC – Council of the European Communities CEU – Council of the European Union
DGRM – Direcção-Geral de Recursos Naturais, Segurança e Serviços Marítimos
EC – European Commission
ECDGMAF – European Commission Directorate General for Maritime Affairs and Fisheries
FAO – Food and Agriculture Organization of the United Nations
FAOSTAT – Statistics Division of the Food and Agriculture Organization of United Nations
ICCAT – International Commission for the Conservation of Atlantic Tunas ICES – International Council for the Exploration of the Sea
IH – Instituto Hidrográfico
INE – Instituto Nacional de Estatística
IPMA – Instituto Português do Mar e da Atmosfera
MADRP – Ministério da Agricultura, do Desenvolvimento Rural e das Pescas
MAR – Ministério da Agricultura e do Mar MSC – Marine Stewardship Council
NAFO – Northwest Atlantic Fisheries Organization
ONU – Organization of the United Nations
xxi
English, Portuguese () and
Latin
names of the most common species
referred in the text:
Cod (bacalhau) –Gadus morhua
Sardine (sardinha) – Sardina pilchardus
Horse mackerel (carapaus) – Includes: Trachurus trachurus,Trachuruspicturatus and Trachurus mediterraneus
Tuna (atuns) – Includes: Katsuwonus pelamis, Thunnus spp, Auxis spp, Sarda sarda
Gilthead seabream (douradas) – Includes: Sparus aurata, Diplodus spp, other Sparidae
European seabass (robalos) –Dicentrarchus labrax
Hake (pescadas e abróteas) – Includes: Merluccius merluccius, Urophycis tenius, other
Merluccidae
Salmon (salmão) –Salmo salar
1
1.
Introduction
1.1.
Problem definition
The Portuguese imported fish deficit has grown considerably in the last four decades, motivated by a large consumer demand and reductions in fishery volumes. These variations were not accompanied by an equivalent growth of alternative production sources, such as aquaculture, which led to an increased dependency on imported fish since the 1970s.
In many countries, the search for sustainable alternatives to fisheries has been motivated by food security reasons. Despite a number of outstanding issues regarding environmental impacts, marine spatial planning, and the particular biogeographic conditions of the Portuguese coast, aquaculture is a valid option in order to reduce the imported fish deficit and the consequent external dependency. This has motivated the creation of governmental plans and strategies, guided by the European framework. The support of scientific knowledge has also been crucial in breaking new ground regarding the variety of farmed species, as well as in the use of new marine areas.
2
1.2.
Objectives and expected outcomes
In order to understand the Portuguese seafood sector from consumers to internal production, and identify the potential for an increase in fisheries and aquaculture yield, a step by step methodology was developed and followed, with a series of intermediate goals:
Identify the key species and/or seafood products consumed in Portugal;
Examine the total availability of key seafood products in Portugal, and categorize the origin of these species;
Compare the availability and estimated consumption for each of the key species in order to obtain an optimized consumption volume, according to real availabilities;
Quantify the potential for a production increase of the identified key species, based on consumption demand and available opportunities in Portugal.
1.3.
Thesis layout
The study is divided into five chapters. The first section is an introduction to the work plan, definition of the problem, including a layout of the main objectives, as well as expected outcomes.
Chapter 2 contains the state-of-the-art. This is focused on important issues, such as the European Union framework, which are important in defining the evolution of the Portuguese seafood sector. This section also addresses the historical evolution and current status of the Portuguese seafood sector.
3 Results are presented in the Chapter 4, following the same arrangement. The first section shows the results regarding availability and consumption, including consumption estimates and identification of key species in the Portuguese seafood market. The second section presents the growth potential estimates, based on seafood consumption.
Chapter 5 contains the discussion. This includes the description of strategic areas of intervention, and how they best fit each key product. This chapter also includes some alternative considerations, as well as a sub-section describing issues identified regarding methodology and results.
5
2.
State of the art
2.0.1. Consumption and production in the seafood sector
Seafood is widely accepted as part of a healthy and balanced diet, and the high demand for these products places considerable pressure on the environment. Traditionally the fishing sector has supplied the bulk of seafood demand, although roughly since the 1970’s aquaculture has grown into a valid alternative. Both sectors have negative impacts on ecosystems at various levels. In addition, the large economic dimension of the seafood sector and the amount of people it employs are adequate motivation for understanding demand in a demand-driven sector, which is paramount to a more effective shaping of policies and marketing strategies (Carlucci et al., 2015).
6 2.0.2. From wild to farmed fish
Worldwide aquaculture production has grown annually since the late 1970’s, aided in
part by a collapse of fish stocks, and taking total fish production worldwide to 167 million tonnes, 87% of which is destined to human consumption. World per capita levels of seafood consumption are at an all-time high of 20kg/person/year (FAO, 2016; Merino et al., 2012; Naylor et al., 2000). These production levels took farmed fish from slightly over 25% to approximately 50% of the seafood consumed worldwide in little over a decade, which creates the expectation of aquaculture becoming a solution to food security problems worldwide, as well as a vital complement to global capture fisheries. Asian countries have been leading this aquaculture “blue revolution”, with over 90% of total production originating in their marine, brackish and freshwater environments – China alone accounts for 60% of global production levels (Campbell and Pauly, 2013; Ferreira et al., 2014; Naylor et al., 2000). Europe currently has a troubling seafood trade deficit, and with the expected increase in consumption, allied with a growing purchasing power on China and SE Asia countries, aquaculture products are likely to become scarcer and more expensive (Ferreira et al., 2014). With the collapse of fish stocks, the reliance on farmed fish is expected to increase, in order to support an increasingly larger world population and its demand for fish-based protein (Naylor et al., 2000).
7 social, and economic) as well as market factors, have inhibited the expansion of this sector in European Union countries, limiting annual growth to 1% per year, or resulting in growth stagnation. In Europe, the licensing of aquaculture explorations has been characterized by a clear concern about the carrying capacity of ecosystems, and environmental legislation has implicitly promoted the Ecosystem Approach to Aquaculture (EAA) objectives (Nunes et al., 2011).
Aquaculture production increases remain a mixed blessing, since growth has been partly at the cost of wild caught fish (Naylor et al., 2000). Improvements in fisheries management can either benefit or stifle aquaculture growth, depending on the exploitation level of fish stocks, targeted species, and the emergence of new farmed products. There are some cases where successful fisheries management led to a restraint in aquaculture growth potential (Jensen et al., 2014). Despite difficulties in obtaining realistic estimates for potential aquaculture growth, the majority of studies have shown an increase in global aquaculture production, in contrast with the stagnation or decrease of wild fish landings. This has been a recurring tendency since 1980, which has helped in maintaining current seafood supply, and this tendency can prove a valuable ally for the future of seafood production (Campbell and Pauly, 2013; Gjedrem et al., 2012; Natale et al., 2013).
2.1.
European Union framework
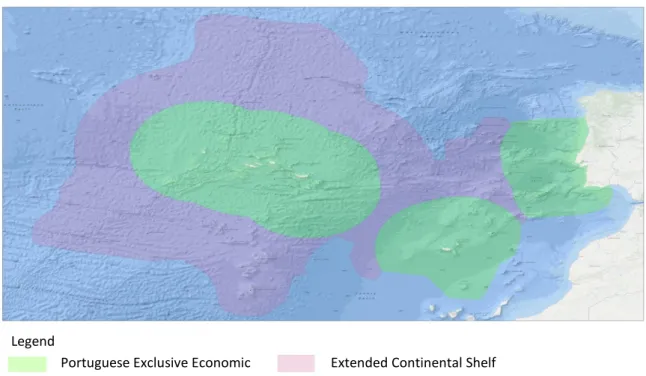
2.1.1. Portugal’s maritime dimension within the EU
8 and aquaculture claims, and the development and application of maritime spatial plans (MSP) is crucial, in order to avoid conflicts between different uses and achieve conservation objectives (Calado and Bentz, 2013).
Portugal is part of the Atlantic Arc peripheral maritime region and plays an important role in achieving the EU strategic objectives for the Atlantic Ocean, as well as the implementation of the ecosystem approach (EC, 2011, 2009a). The OSPAR convention for the protection and conservation of the Northeast Atlantic includes the Portuguese coastline and its waters. As for Regional Fisheries Management Organisations (RFMO’s), the Portuguese EEZ is located within the area of influence of the International Commission for the Conservation of Atlantic Tuna (ICCAT) and the North East Atlantic Fisheries Commission (NEAFC). The Northwest Atlantic Fisheries Organization (NAFO) also plays an important role in influencing some of Portugal’s catches (EC, 2009a). Portugal, as a part of the EU, must also implement the Marine Strategy Framework Directive (MSFD), which is considered to be the environmental pillar of the EU Integrated Marine Policy (IMP) (Santos et al., 2012).
Legend
Portuguese Exclusive Economic Zone
Extended Continental Shelf
9 2.1.2. Legal and political framework
The Integrated Maritime Policy for Europe has, for some time, been work in progress, and an objective regarding the required connection between all sectors which impact and operate on the sea (Fritz and Hanus, 2015; Santos et al., 2014a). This link among a series of cross-cutting policies is of critical importance for several maritime-related subjects. Marine knowledge and economic growth are issues that affect several EU policies, and the fishing and aquaculture sectors have vested interests in a series of these guidelines (ECDGMAF, 2014). 2.1.2.1. Common Fisheries Policy (CFP)
The Common Fisheries Policy dates back to the early 1970’s. In those early days the
main goal of political decision-makers was to avoid conflicts. Regulation was developed where Member States were allowed somewhat free access to each other’s waters, thus maintaining traditional fishing grounds and practices, which in turn, caused its own set of issues (EC, 2009b; Hoefnagel et al., 2015). The initial set of regulations mainly referred market and structural measures. In 1983 the legislation adopted a more administrative concern over the community fisheries. This structural policy has been reviewed regularly every ten years since (Salomon et al., 2014). The annual Total Allowable Catch (TACs) and quotas system was created in 1976, as part of the CFP, in order to manage total catches, fishing area restrictions, and time, as well as gear limitations. It was legally established in 1983 (CEC, 1983) and was considered the CFP ’cornerstone of all conservation measures‘. In the establishment of annual TACs the Scientific and Technical Committee for Fisheries plays an important role, estimating these based on the solid scientific data available—analytical TAC’s—or based on a precautionary approach— precautionary TAC’s—in order to assure a certain degree of conservation of relevant stocks (Karagiannakos, 1996; PCEU, 2013).
10 shift the management approach on fish stocks from aiming to avoid stock collapse to increasing yields with clear benefits to environment, producers, and consumers. On the other hand the unambitious capacity ceilings and the entry/exit schemes are more a reflection of the current status quo, and therefore do not offer much promise in the much-needed reduction of the overall EU fleet capacity. The quota swapping is also a problematic issue, which has the potential to induce conflicts between states with an established scheme (or with the intention of creating one) and states that refuse to adhere to such practices. The mandatory and publicly available report from Member States on the balance between fishing opportunities and capacity is a positive tool which allows the Commission to identify and address structural overcapacity. The same can also be said about the required establishment by member states of multiannual strategic plans with objectives for aquaculture development (PCEU, 2013; Salomon et al., 2014).
The reduction of bycatch through the use of more selective fishing gear and elimination of non-commercial species is at the root of the discards ban implementation in the CFP reform. A discards ban requires considerable amounts of data on the fisheries in order to succeed, as well as incentives for compliance, and the prior implementation of methods that mitigate bycatch. Despite the positive intentions, some consider the discards ban an extreme measure, which could lead to more negative economic, social, and ecological impacts than benefits, especially in the small-scale fisheries segment. The low capitalization of this sub-sector, lack of incentives to ensure compliance, and shortage of enforcement authorities, all add to the increased vulnerability of this segment (Veiga et al., 2016).
11 need to be reformed in order to solve certain issues and guide the EU fisheries in a more sustainable manner (Cressey, 2013a; Hoefnagel et al., 2015; Salomon et al., 2014).
2.1.2.2. European Maritime Fisheries Fund (EMFF)
If the TAC and quotas system has been in the past, and in part still is, considered as the essence of ecological concerns of the CFP, the EMFF and its predecessor the EFF (European Fisheries Fund), provide the financial backbone for fisheries, aquaculture and IMP measures and subsidies (CEU, 2006; PCEU, 2014). While overcapacity has been identified as one of the main causes for overfishing for some time, in the past the greatest portion of EU fisheries subsidies has been used for the enhancement and modernization of fishing fleets, which ultimately increases fishing capacity and fuels overfishing (Cressey, 2013b; Villasante, 2010).
In the EMFF reform, the EU Parliament voted against the proposal of subsiding new vessels. Despite this setback, capacity enhancing subsidies remained, and it will be possible to substitute old engines with new models, with improved fuel-efficiency, which contributes positively to climate change mitigation, in spite of the harmful effects to overfishing. The allocation of funds to research and data collection is a positive development (PCEU, 2014; Salomon et al., 2014).
2.1.2.3. Marine Spatial Planning (MSP) and the Marine Strategy Framework Directive (MSFD)
12 The interaction between these two directives is part of what allows the ecologically and economically sustainable development of all maritime endeavours in the EU marine space (Rätz et al., 2010). The key role of indicators for the assessment of environmental conditions, or management measures, is evident in the MSFD and is a significant part of the ecosystem approach to management (Reiss et al., 2010). These indicators serve as ’qualitative descriptors‘ to adapt management measures with the objective of achieving GES (PCEU, 2008).
Some authors distinguish between an ecosystem-based management of the marine space and a blue growth orientation. The first is based on ecological criteria, ecosystem goods and services oriented to human use and a precautionary approach, with the objective of ensuring sustainability. The second defines environmental sustainability as a pillar or sector of MSP, next to others such as fisheries, tourism or navigation. When considering these two distinct approaches to MSP in the EU framework, it becomes evident that both are priorities in several directives, as the CFP or MSFD. The adaptive management approach can be considered as a conciliation of these two attitudes towards MSP, and even perhaps the one which integrates the most EU goals. It is based on the systematic advance in knowledge about ecosystems via monitoring and assessment, adapting policies and management choices, which are reflected by acquired results. The precautionary approach is inherent in this method (Santos et al., 2014a).
13 to provide an evolution to MSP, management measures and policies that can ensure the long-term sustainability of marine uses (Santos et al., 2014b, 2012).
2.1.2.4. Maximum Sustainable Yield (MSY)
The objective of MSY regarding fisheries is to keep fish stocks at a biological level that avoids a reduced recruitment of fish and therefore optimizes production levels, thus achieving a constant renewal of the stock. This concept is defined as “a scientific appraisal of the safe upper limits of harvest which can be taken consistently year after year without diminishing the stock” (Froese and Quaas, 2013; Mesnil, 2012; Steadman et al., 2014).
14
2.2.
Portuguese seafood sector
2.1.1 From history and tradition to politics and production
Traditional occupation and exploration of resources by Portuguese coastal communities created a profound knowledge of the natural cycles and riches provided by the sea, which shaped a multitude of fishing methods, boats and even dwellings (Abreu and Fernandes, 1987). As a result of this connection, certain coastal communities have subsisted and still subsist, some almost exclusively, from exploitation of marine resources, most notably fishing activities which have been historically achieved through small-scale fishing (Leitão et al., 2014).
Despite such a strong coupling between populations and nearby coastal and estuarine ecosystems, the most important seafood product to Portuguese consumers has been, and still is, cod (Dias et al., 2001). The root of such a predominance of this product, which is not an endemic species in Portuguese waters, especially in such a peculiar presentation – dried and salted – has been variously studied in literature. Initially, the abundance of this species in the North Atlantic, mainly in Newfoundland, shaped the history of certain coastal communities and seafood consumption patterns (Davies and Rangeley, 2010). Subsequently, politics helped form what would become part of tradition and culture, which left an indelible mark on Portuguese diet and traditions. Later, cod would help shape the Portuguese foreign fish deficit, with the end of free access to resources due the introduction of the two hundred nautical miles EEZ regime, and the stock collapse in the Newfoundland area, as the main drivers in the decline of cod landings (Almeida et al., 2015; Bjørndal et al., 2015; Coelho et al., 2011).
15 the loss of free access to resources—the pillar on which the ’cod campaign‘ had been built— collapsed. From 1976 to 1978, landings dropped from 71 000 to 20 000 tonnes. With Portugal’s entry into the EC in 1986 and the transposition of bilateral agreements—where certain historical fishing rights and its large consumption market were enforced—into the EC framework, quotas decreased, swiftly followed by total landings (Coelho et al., 2011). In 1992, a moratorium was declared on cod fishing in the Grand Banks, closing commercial exploration (Schrank, 2005). In the same year Portuguese landings dropped to current levels of under 10 000 tonnes per year (Figure 2) (Bjørndal et al., 2015; Dias et al., 2001; NAFO, 2014).
Operations of the Portuguese long distance fleet were not confined to cod fishing in the North Atlantic. Hake catches suffered an abrupt decline in 1990. Other species have suffered considerable catch reductions over the decades, such as horse mackerel (Bjørndal et al., 2015). The 1974 (political) revolution, and the loss of control over certain important seafood resources of former Portuguese colonies, also contributed to landing reductions (Almeida et al., 2015; Mendes, 2005). Sardine production was mainly driven by the commercial interests of the canning industry. Sardine and other fish common in Portuguese waters, such as tuna or chub mackerel, were the drivers of the first canning industries near coastal villages and fishing ports. This led to the creation of strong bonds between populations and these marine activities, and the generated know-how became part of these communities’ heritage and was passed down and improved through generations (Duarte, 2004).
0 200 000 400 000 600 000
1950 1955 1960 1965 1970 1975 1980 1985 1990 1995 2000 2005 2010
To
n
n
es
Cod Sardine Hake Horse mackerel Other Species
16 Although the end of free access to resources in 1977 marked a tipping point in the Portuguese fleet catches, signs of the lack of sustainability of fishing practices in the Grand Banks area had been present since the late 1960’s, when the first drops in cod landings were
registered. From 1976, sardine became the most fished species, marking an evolution of the Portuguese fleet from predominantly targeting distant species to taking the majority of the catch in national or EU waters. The impact of joining the EC in 1986 represented an increase in total landings and a change in composition, with a wider range of landed species (Figure 2) (Almeida et al., 2015; Bjørndal et al., 2015; Schrank, 2005). In 2009, Portugal had the most heterogeneous landing composition of the EU, declaring a total of 349 species (OCEANA, 2012). This shift in exploited waters and targeted species was supported by an adjustment in terms of fleet composition. Currently the largest fleet section is the multi-gear fishery, responsible for the highest variety of species and the largest portion both in volume and value of landed fish (Gamito et al., 2015; INE, 2014a).
2.1.2 Shift in sourcing seafood and growth of the foreign fish deficit
17 In 1974, national seafood production accounted for 69% of total availability, and during the fisheries crisis period (1972 to 1985) this ratio between imports and production remained somewhat constant at the expense of total availability. In 1986 Portugal joined the EC, production grew, and the ratio between internal and external seafood origin shifted in favour of production (56% and 52% of internally produced seafood in 1986 and 1987 respectively). From 1988 to 2011 Portugal gradually increased its dependence on external seafood, as production decreased and imports grew in order to sustain a similar per capita
consumption level (Figure 4 and Figure 5)(Almeida et al., 2015; FAOSTAT, 2015).
The evolution from internal to external seafood is clear in Figure 4, as is the impact on the foreign fish deficit. The growth tendency of the foreign fish deficit started during the fisheries crisis period (Almeida et al., 2015). In 1987 the seafood deficit grew substantially with Portugal’s entry in the EC. Imports and overall catch production grew as well, however the import growth after entering the EC was a consistent tendency. Portugal’s seafood self-sufficiency decreased from 52% in 1990 to 24% in 2009 (Esteban and Crilly, 2012). In 1961, imports played a lesser role in supplying the national market with 12% of availability from an external source, while national fleet landings accounted for the remaining 88% (FAO, 2015). The increase in imports combined with a landings reduction had an impact, not only in volume, but also in the value of the Portuguese seafood budget (Figure 5). The foreign fish deficit more than doubled in ten years (1988 to 1998), reaching a value of 838 738 X 103€ in 2011. The
Figure 3. Historic profile of the seafood availability in Portugal from 1961 to 2011(FAOSTAT, 2015). 0
200 000 400 000 600 000 800 000
1961 1966 1971 1976 1981 1986 1991 1996 2001 2006 2011
Ton
n
es
18 continued reduction of fish landings contributed to the increase in imports (Figure 4) (Bjørndal et al., 2015; Dias et al., 2001).
A noticeable factor for Portugal’s shift from a distant water fishing state, capable of supporting the majority of its seafood demands, to a country with considerable foreign fish dependence, was the adhesion to the EC. The Gross Domestic Product per capita (GDP) growth and the monetary resource transference from the central EC economies to peripheral countries allowed an increase of imports. The increase of available income per capita also allowed for the maintenance of seafood consumption at pre-1974 levels, at the expense of higher imports (Baer and Nogueira Leite, 2003; Baer et al., 2013; Bjørndal et al., 2015).
Despite the overall upward trend of Portugal’s foreign fish dependency since 1976, the export value also increased, especially after 2002. The increase in value of both trade flows is partially caused by inflation, but the growth of exported and imported volumes (Figure 5) corroborates this upward tendency. Although reliant on external trade to meet consumer demand, the seafood sector in Portugal evolved. The processing industry, more notably the canning industry of tuna, sardine, and other small pelagic fishes, remained capable of adding value to wild caught and imported fish (FAO, 2015; FAOSTAT, 2015).
-€ 1 200 000 -€ 600 000
€ 0
€ 600 000
€ 1 200 000
600 000 300 000 0 300 000 600 000
1961 1966 1971 1976 1981 1986 1991 1996 2001 2006 2011
Se afoo d d ef ici t (m € ) Ton n es
Imports Production Seafood deficit (m€)
19 The Portuguese imports profile after 1976 (Figure 6 and Table 1) reflects the decrease in landings of certain fish species shown in Figure 2. The impact of the cod position on national diet is patent in its share of imports in either volume or value. Cod, despite not being an exploited species in Portuguese waters, has an important role in balancing the foreign fish deficit. In 2011 it is the most exported species in value, attesting the importance of the processing sector in the valorisation of these products (Dias et al., 2001). Other species have gained a more relevant role in the national seafood market during this period. Tuna imports and exports increased both in volume and value since 1976. Small pelagic fish such as sardine or mackerel, common in the Portuguese coast, constitute an important part of exports in volume—43% of the average tonnage—and value—28% of average worth (FAO, 2015). Sardine has experienced a reduction in production and exports since 2011, due to low stock biomass levels (ICES, 2015a). Since 2012, chub mackerel became the most produced and exported fish species in Portugal in volume (INE, 2015, 2014a, 2013a, 2012a, 2011a, 2010a, 2009a, 2008a, 2007a, 2006a).
20 Table 1. Most relevant imported and exported seafood products to Portugal in 1976 and 2011 (FAO, 2015).
Imports 1976 2011
Ton m€ Ton m€
Cod 44.185 38.9% 65.138 66.4% 99.711 24.7% 525.948 29.1%
Sardine 3.737 3.3% 659 0.7% 13.331 3.3% 24.904 1.4%
Tunas 4.701 4.1% 2.715 2.8% 25.284 6.3% 93.203 5.2%
Hake 17.426 15.4% 9.041 9.2% 36.679 9.1% 138.493 7.7%
Jack and Horse
mackerels 0 0.0% - 0.0% 13.962 3.5% 25.140 1.4%
Other 43.460 38.3% 20.586 21.0% 214.899 53.2% 999.353 55.3%
Total 113.509 100.0% 98.139 100.0% 403.866 100.0% 1.807.042 100.0%
Exports 1976 2011
Ton m€ Ton m€
Cod 1.453 3.0% 515 0.9% 17.904 9.4% 142.754 14.7%
Sardine 29.288 60.0% 33.740 58.3% 33.741 17.6% 104.765 10.8%
Tunas 1.685 3.5% 2.612 4.5% 11.531 6.0% 65.935 6.8%
Mackerel 3.054 6.3% 4.315 7.5% 28.336 14.8% 68.402 7.1%
Other 13.333 27.3% 16.677 28.8% 99.880 52.2% 586.448 60.6%
Total 48.813 100.0% 57.859 100.0% 191.392 100.0% 968.304 100.0%
-€ 1 200 000 -€ 500 000
€ 200 000
€ 0
€ 400 000
€ 800 000
€ 1 200 000
€ 1 600 000
€ 2 000 000
1976 1981 1986 1991 1996 2001 2006 2011
Se afoo d d ef ici t (m € ) Tra d e fl ow val u e (m € )
Exports Imports Seafood deficit
-€ 1 200 000 -€ 500 000
€ 200 000
0 150 000 300 000 450 000
1976 1981 1986 1991 1996 2001 2006 2011
Se afoo d d ef ici t (m € ) To n n es
Exports Production Imports Seafood deficit
Figure 5. Evolution of the Portuguese seafood trade and foreign fish deficit (in m€) from 1976 to 2011 (top). Evolution of Portuguese imports, exports and seafood production in tonnes from 1976 to 2011. Evolution of the
21 Differences between each sector reflect the traded and, to some extent, the consumed species (Figure 7). Portugal’s foreign fish dependency is clearer in certain sectors, with variable impact on the overall deficit depending on volume and value. Frozen fish has the highest contribution of all the sectors on both value and volume regarding the trade flow balance. Frozen fish is also the most imported and exported seafood in volume, however imports are more than double of the exported volume explaining the higher impact of this sector on the overall deficit (INE, 2014a, 2013a, 2012a, 2011a, 2010a, 2009a, 2008a, 2007a, 2006a).
The second most traded products are dry, smoked, and salted fish. In this sector the most important species is cod, explaining the high volumes and values involved due to its importance in Portuguese diet. Another factor that highlights this sector importance is the
0 150 000 300 000 450 000
1976 1986 1996 2006
To
n
n
es
€ 0
€ 500 000
€ 1 000 000
€ 1 500 000
€ 2 000 000
1976 1986 1996 2006
m
€
Other Tunas
Jack and Horse mackerels Sardine
Hake Cod 0 50 000 100 000 150 000 200 000
1976 1986 1996 2006
To
n
n
es
€ 0
€ 200 000
€ 400 000
€ 600 000
€ 800 000
€ 1 000 000
1976 1986 1996 2006
m
€
Cod Sardine Tunas Mackerel Other
Figure 6. Portuguese seafood trade balances of the most important species between 1976 and 2011. Imports and exports in tonnage are represented in the top left and right panes respectively. Imports and exports in value (m€) are
22 difference between the volumes shown in Figure 7 and the live weight, which is approximately three times the dry weight—1 kg of fresh cod corresponds to 0.233 kg of dried cod, and 0.333 kg of salted cod (INE, 2015). Canned fish—mainly of three species, sardine, tuna and chub mackerel—is the only sector with a positive balance in both volume and value. These positive values are more expressive in value than in volume, supporting the industry’s historic know -how and capacity of adding value to seafood products (Duarte, 2004; INE, 2014a, 2013a, 2012a, 2011a, 2010a, 2009a, 2008a, 2007a, 2006a).
2.1.2.1. Recent evolutionof trade balance
Overall seafood deficit in both volume and value has decreased in recent years. From 2005 to 2013 the import/export ratio declined by 7.6%. Variation in traded values was slightly larger (9.4% reduction). These differences did not originate in the reduction of imports or
-€ 400 000 -€ 300 000 -€ 200 000 -€ 100 000
€ 0
€ 100 000
Frozen fish Fish fillets
Fresh and chilled fish Dry, smoked and salted fish Molluscs Canned and other processed fish Crustaceans Bal an ce (m € )
2005 2006 2007 2008 2009 2010 2011 2012 2013
-130 000 -90 000 -50 000 -10 000 30 000 To n n es
2005 2006 2007 2008 2009 2010 2011 2012 2013
23 increases in production, which increased and decreased respectively, but in the considerable growth of exports (INE, 2014a, 2013a, 2012a, 2011a, 2010a, 2009a, 2008a, 2007a, 2006a).
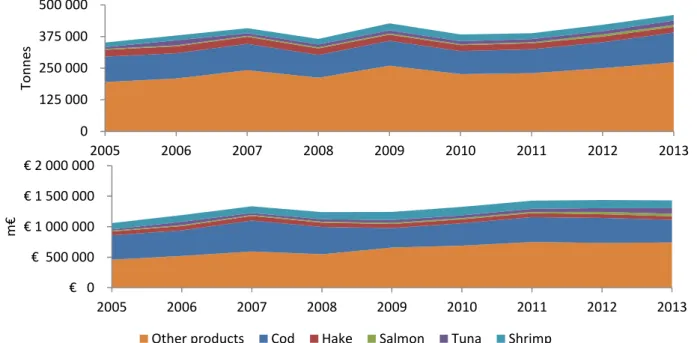
Total seafood imports to Portugal have increased recently. Between 2005 and 2013 an increase of 31.0% was registered from 351 344 tonnes to 460 261 tonnes. The variation in value was higher, and corresponded to a 35.1% increase (Figure 8). This increase was more expressive in salmon, tunas and other unidentified species.
Imports are topped by cod, accounting for 25.1% of imported volume and 31.2% of value on average, for the period between 2005 and 2013. The remaining species have considerably lesser volumes and values of imports. Hake (6.3%), shrimps (5.7%), tunas (3.3%) and salmon (1.2%) are the other relevant species in terms of volume. Despite the prominent role of cod, fish imports are varied, and other products represent 58.5% of imported tonnage and 53.7% of value on average (INE, 2014a, 2013a, 2012a, 2011a, 2010a, 2009a, 2008a, 2007a, 2006a).
0 125 000 250 000 375 000 500 000
2005 2006 2007 2008 2009 2010 2011 2012 2013
To
n
n
es
€ 0
€ 500 000
€ 1 000 000
€ 1 500 000
€ 2 000 000
2005 2006 2007 2008 2009 2010 2011 2012 2013
m
€
Other products Cod Hake Salmon Tuna Shrimp
Figure 8. Most relevant seafood products imported between 2005 and 2013. Imports are displayed in volume per
24 Exports have increased considerably in both volume and value, more than doubling in recent years. Recorded growth of exports corresponds to an increase of 108.4% in tonnage, and 122.7% in value from 2005 to 2013 (Figure 9). Undifferentiated products are part of this development, with increases of 141.7% in volume and 151.5% in value. All products have grown in exported value, and in volume only sardine has decreased in this period, likely because of the reduced biomass levels and catch restrictions imposed (DGRM, 2012). Despite the reductions and considering the average exported volume from 2005 to 2013, sardine is still the most important species in exported volume (20.7%) and value (13.4%).
Chub mackerel is the product with the best growth rate in volume, growing by 302.4% for this period. Cod exports, which also increased, represent 13.2% in value and 7.9% in volume, making it the second most exported seafood product in tonnage (Figure 9).
Figure 9. Most relevant seafood products exported between 2005 and 2013. Exports are displayed in volume per
tonnes (top) and value per m€ (bottom) (INE, 2014a, 2013a, 2012a, 2011a, 2010a, 2009a, 2008a, 2007a, 2006a). 0
50 000 100 000 150 000 200 000 250 000
2005 2006 2007 2008 2009 2010 2011 2012 2013
To
n
n
es
€ 0
€ 400 000
€ 800 000
2005 2006 2007 2008 2009 2010 2011 2012 2013
m
€
25 2.1.3 Recent fisheries yields
Objectives and future plans for fisheries development in Portugal defend the long-term environmentally sustainable management of the sector, in order to contribute to food production while providing economic benefits (DGRM, 2014; MADRP, 2007; PCEU, 2013). The use of trawling and large-scale purse seining has not been permitted in the Azores region for some time (Gallagher et al., 2012), and the more recent regulation that limits the use of longlines and purse seine nets only for the capture of live fishing bait for use on board of licensed pole and line vessels in a vast area of the potential future Portuguese EEZ (Secretaria de Estado do Mar, 2014), both display a commitment for the reduction of the impacts of fishing on the marine environment. The fishing capacity of the national fleet is currently in balance with allocated opportunities and in compliance with the CFP objectives (EC, 2014a).
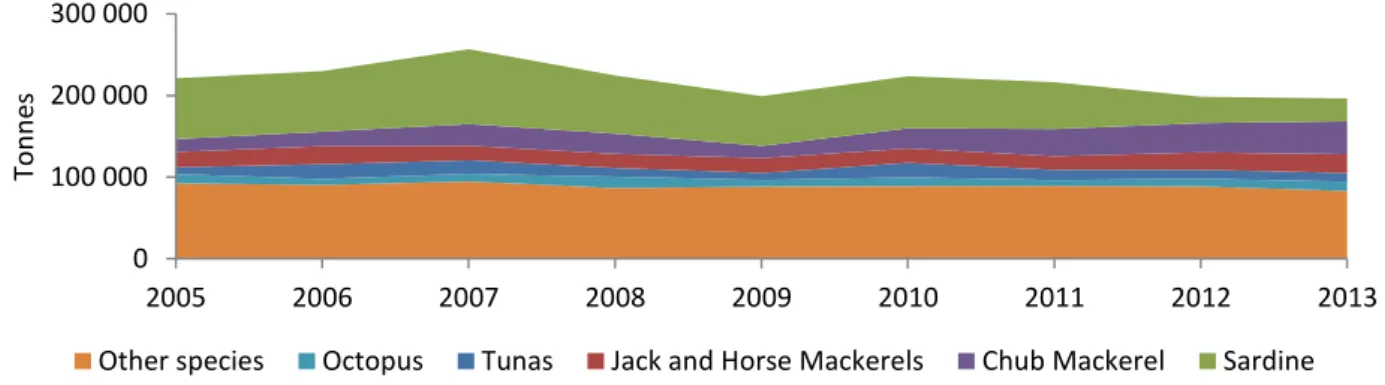
Fishing in Portugal between 2005 and 2013 has only decreased in volume, and remains somewhat constant regarding value. Yielded volume has decreased by 11%. Fisheries are highly diversified and composed by a vast number of species from different taxonomic groups (OCEANA, 2012). The most relevant species are small pelagic fish such as sardine or chub mackerel, common in Portuguese coastal waters. Octopus and other molluscs have also gained considerable importance in overall catches over the years (Almeida et al., 2015). Octopus
0 100 000 200 000 300 000
2005 2006 2007 2008 2009 2010 2011 2012 2013
To
n
n
es
Other species Octopus Tunas Jack and Horse Mackerels Chub Mackerel Sardine
26 represents 4.5% of total catches between 2005 and 2013. The high commercial value of this species and the valorisation and promotion campaigns developed for this product are likely to be significant factors for this increase (Figure 11 and Figure 10)(Docapesca, 2013; IPMA, 2013).
Sardine has historically been the cornerstone product of Portuguese coastal fisheries, however in 2012 and 2013 chub mackerel landings exceeded sardine. The sardine stock is subjected to a management plan from Portuguese and Spanish authorities (MADRP, 2010), and landings have declined more than 45 000 tonnes between 2005 and 2013 (Figure 10). The most recent ICES advice for 2016 recommends a catch limit of 1 587 tonnes (ICES, 2015b), which in real terms means the closure of this fishery. Both species are caught by purse seine fishing, and promotion campaigns for chub mackerel can also have an impact in the catch increase (DOCAPESCA, 2012). Jack and horse mackerels have also experienced a slight increase in catches, and the recent increase of the horse mackerel quota for 2015 is evidence of the good biomass levels for thisspecies (EC, 2015; ICES, 2015a).
The ICCAT is the competent organism in stock assessment and management of the vast majority of tuna fishing by Portuguese vessels. Portuguese catches are mostly composed of two species, skipjack (Katsuwonus pelamis) and bigeye tunas (Thunnus obesus) with 48% and 41% of total average catch (ICCAT, 2015, 2014). Tuna catches have remained somewhat constant, and correspond to 5.8% of total catch. The impact of the remaining species is
€ 0
€ 50 000
€ 100 000
€ 150 000
€ 200 000
€ 250 000
€ 300 000
2005 2006 2007 2008 2009 2010 2011 2012 2013
m
€
Other species Octopus Tunas Jack and Horse Mackerels Chub Mackerel Sardine
27 considerable (41% on average) attesting to the multispecies profile of Portuguese fisheries (Figure 10)(Almeida et al., 2015).
Figure 11 and Figure12 show the value and price variation for most important caught species over the period between 2005 and 2013. Octopus is the most important product, with 14.0% of overall average value. Chub mackerel catch is less relevant in value than volume, representing only 2.5%. The value of caught tuna has increased during this period, representing an average share of 7.8%.
Table 2. Average price and variation between 2005 and 2013, for most the important species landed by the Portuguese fleet (INE, 2014a, 2013a, 2012a, 2011a, 2010a, 2009a, 2008a, 2007a, 2006a).
Average price (€/kg) of landed species
Price variation for the (2005— 2013 period)
Overall average value for the 2005—2013 period (m€)
Octopus 3.91 -22.4% 37 716 14.0%
Tunas 1.82 37.2% 20 880 7.8%
Jack and Horse Mackerels 1.20 -38.6% 19 723 7.3%
Chub Mackerel 0.28 4.8% 6 765 2.5%
Sardine 0.81 119.0% 37 457 13.9%
Sardine total value has increased slightly, reflecting the scarcity of this species (ICES, 2015a), and motivating a rise in price. Sardine represents on average 13.9% of total value. The
- € 2,50 € 5,00 €
2005 2006 2007 2008 2009 2010 2011 2012 2013
Pri
ce
(
€
/kg)
Tunas Jack and Horse Mackerels Chub Mackerel Sardine Octopus
28 increase in jack and horse mackerel catches caused a decrease in value. The total percentual value of undifferentiated species for this period is 54.4%. The largest price increase registered was in sardine and tunas. Octopus, and jack and horse mackerel prices declined (Figure 11, Figure 12 and Table 2).
2.1.4 Fishing effort reduction and fleet evolution
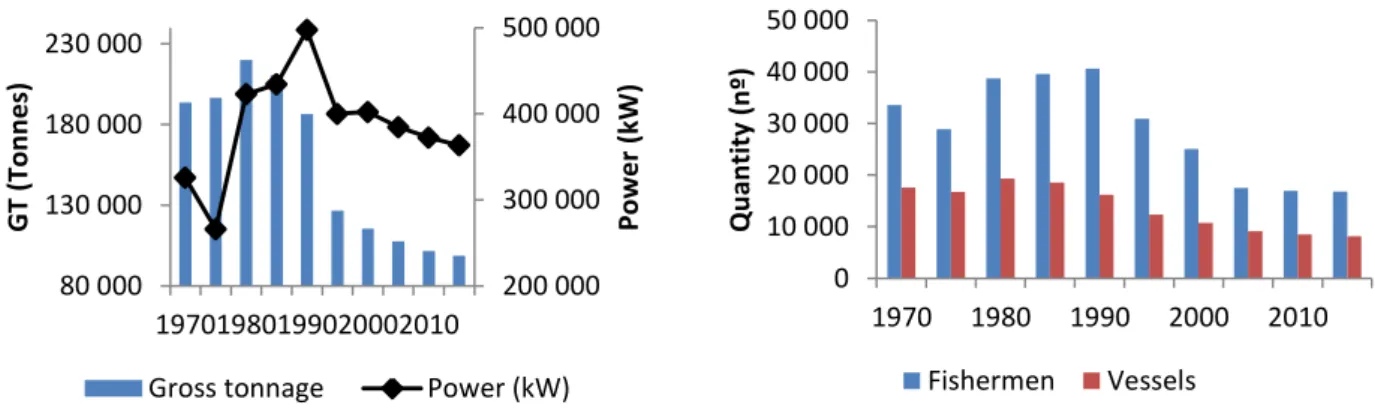
The considerable drop in landings registered during the late 1970’s and early 1980’s
was not accompanied immediately by a reduction in the number of vessels, which only declined after 1990. The number of fishermen registered a drop during the fishery crisis period (1972 to 1985), followed by a recovery to the previous pre-1970 values until 1990 (Leitão et al., 2014). In 1986 Portugal joined the EC and bound to the newly introduced Common Fisheries Policy (1983), the largest single management regime in the North Atlantic (Symes, 1997) to date. Since 1983 the EC developed a sequence of MAGP’s (Multi-Annual Guidance Plans) with the objective of programming the evolution of the community’s commercial fishing fleet. The
goal of reducing fishing effort and capacity was achieved through a reduction in number of vessels, crew members, gross tonnage, and power of each country fishing fleet (Figure 13) (Perez-Labajos, 2012). 0 10 000 20 000 30 000 40 000 50 000
1970 1980 1990 2000 2010
Qu an tity ( n º) Fishermen Vessels 200 000 300 000 400 000 500 000 80 000 130 000 180 000 230 000 19701980199020002010 Pow e r ( kW) GT (To n n e s)
Gross tonnage Power (kW)
29 In the first period (1970—1990) only the gross tonnage and number of vessels had seen their quantity and numbers reduced, by 4% and 8% respectively. The number of licensed fishermen increased by 21% and the effort in fleet modernization was patent in the increase of 53% in power (kW), and a considerable reduction of the number of non-motorized vessels. After 1990, the overall reduction of the EU fishing fleet fishing capacity was carried out by all Member States. Portugal reduced the number of fishermen and vessels by 59% and 49% respectively, as well as the gross tonnage (47%) and power (27%) (INE, 2015; Villasante, 2010).
2.1.5 Impact of illegal, unreported and unregulated (IUU) catches
30 Portugal meets some of the criteria that emphasize the importance of total catch underestimation, such as a highly differentiated fishing fleet, high seafood demand, or a reduced enforcement of fishery management (Coll et al., 2014). Average annual unreported catch for mainland fisheries is estimated at 123 000 tonnes which corresponds to approximately a third of the average reported catch. If all the commercial species from mainland catches had been used, nationally caught fish consumption per capita would rise from an average of 16 kg to 24 kg. Using the discarded commercial species would have covered seafood imports between 1969 and 1986, reducing the foreign fish deficit (Leitão et al., 2014).
Commercial fishing discards contribute the most to the total unreported catch in Portugal, and marketable species are among the more discarded or unreported. Sardine, chub mackerel, Atlantic horse mackerel, blue jack mackerel and hake are some of the most relevant species in the overall unreported catches according to Leitão et al (2014). These species are also some of the most relevant either in Portuguese consumption – case of the jack and horse mackerels, hake, and sardine (Cardoso et al., 2013) – or in foreign trade – for the chub mackerel (INE, 2014a, 2013a, 2012a, 2011a, 2010a, 2009a, 2008a, 2007a, 2006a).
19,3%
24,8%
54,4% 1,5%
Purse seine Multispecies Trawl Subsistence and Recreational 49%
30%
21%
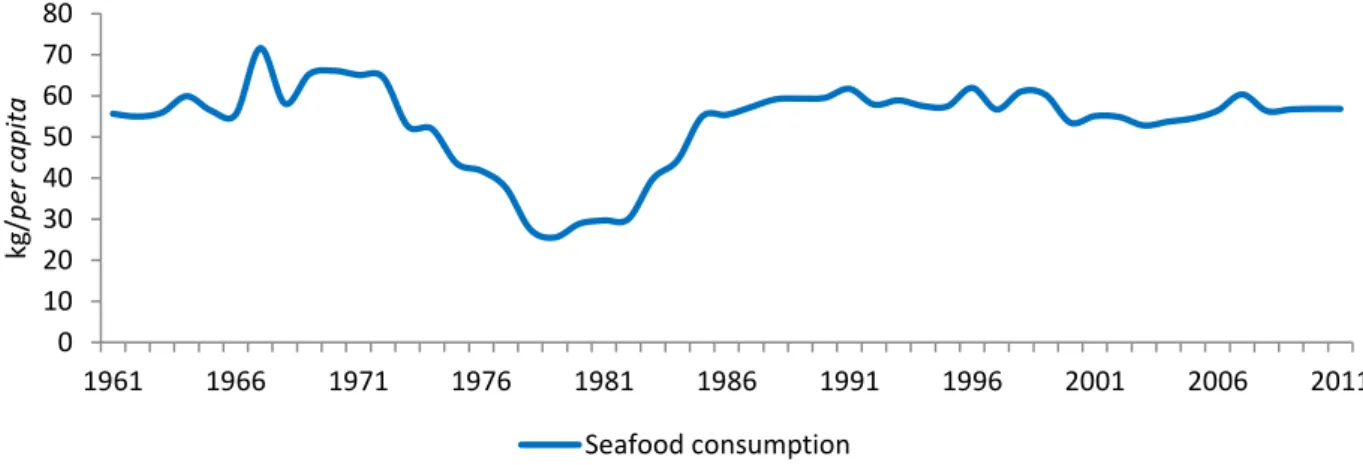
31 2.1.6 Historic seafood consumption
Portugal is the EU country with the highest seafood consumption per capita. With an average value of 53.5 kg between 1961 and 2011, seafood consumption has always been historically high (Figure 15). Only during ten years (1975 to 1984), after the 1974 revolution and throughout the fisheries crisis period, has the seafood consumption dropped below 50 kg/per capita (Almeida et al., 2015; FAOSTAT, 2015). Consumption values in Portugal are considerably higher when compared to the world average (20 kg per capita) and with the EU average (23.1 kg per capita) (EC, 2014b; FAO, 2016).
The causes for such elevated seafood consumption are several and the impacts of geography, resource availability, culture and politics have shaped the fish demand in Portugal (Almeida et al., 2015). In addition to these main drivers, other more personal factors also impact consumer opinions regarding their seafood choices, such as price, difficulty of preparation or health concerns (Carlucci et al., 2015). Gender and geography are as well aspects which determine consumption frequency and preferences (Cardoso et al., 2013).
0 10 20 30 40 50 60 70 80
1961 1966 1971 1976 1981 1986 1991 1996 2001 2006 2011
kg/
pe
r c
ap
ita
Seafood consumption
32 Cod and sardine are some of the products present in the Portuguese diet that illustrate these impacts. Despite the still considerable importance of these two species, the consumption of seafood in Portugal has diversified, especially since 1986. After entering the EC the Portuguese consumed less fish and more molluscs and crustaceans. This reflects the behaviour of catch and import tendencies (Figure 2 and Figure 6).
Seafood consumption is substantially concentrated in a small group of staple products, of which cod is the most relevant. “Soaked cod is an idiosyncratic Portuguese preference” (Cardoso et al., 2013). Reports of the exact volume consumed vary among studies, and it is difficult to estimate accurate values due to the different presentations in which this species is marketed. Despite these constraints it is widely assumed that cod is the most consumed seafood product in Portugal (Almeida et al., 2015; Dias et al., 2001; Willemsen, 2003).
Other staple products include tuna, sardine, hake, and horse mackerel which are predominantly found and consumed canned, fresh or chilled, and frozen. These species are mostly sourced via fishing or imports. The considerable penetration of farmed species, such as salmon and seabream, in the national diet highlights the diversification tendency that has been present since the mid-seventies. The increased importance of octopus or shrimps also shows this tendency to go beyond fish and to other taxa like molluscs or crustaceans. This is an opportunity that can be exploited by producers and distributors (Willemsen, 2003). Despite
37%
7% 6%
5% 5% 2%
2%
36%
Cod Tunas Hake Horse mackerel Sardine Octopus Black scabbardfish Others
33 the impacts of culture, tradition and resource availability attested by the high consumption frequency of cod, sardine or horse mackerel (Figure 16), farmed fish products as salmon, seabass, or seabream have already penetrated the national diet. Other products such as crustaceans and molluscs have intermediate consumption frequencies and a relative importance, but also attest to the increasingly varied sea-based diet in Portugal (Almeida et al., 2015; Cardoso et al., 2013).
2.1.7 Aquaculture status in Portugal
Geography, politics, market conditions, environmental constraints, and history pushed Portugal to search for alternative production solutions within its borders. According to official FAO data, aquaculture production in Portugal started in 1965 and rose above 10 000 tonnes in 1986. Despite this promising start, in 2009 Portuguese aquaculture only accounted for 1% of all available seafood and 3.3% of official production (Figure 17) (FAO, 2015). Notwithstanding favourable consumer-based market conditions, aquaculture development in Portugal has a number of constraints. These derive from its geographic location and natural conditions, corporate difficulties related to production associations, and access to hatcheries and nurseries for different species. Institutional and legal complications, mainly due to slow and complex licensing procedures and the large number of governmental institutions involved,
0 300 000 600 000 900 000
1961 1966 1971 1976 1981 1986 1991 1996 2001 2006
Ton
n
es
Landings IUU Foreign trade Aquaculture
34 have also been identified by responsible entities, and efforts are being made to simplify the licensing process (DGRM, 2014).
Realistic estimates for potential aquaculture growth are notoriously challenging to obtain. Nonetheless, projections show a clear increase in global aquaculture production (FAO, 2016, 2014), contrasting with the stagnation of wild fish catches (Campbell and Pauly, 2013; Gjedrem et al., 2012; Natale et al., 2013). This tendency is also patent in Portugal since the mid-1980’s (Bjørndal et al., 2015). Even considering the many differences among countries, and based on a simplistic estimate of production per km of coastline, Portugal has a much smaller aquaculture sector when compared with other European countries (Table 3).
Table 3. Aquaculture average yield between 2005 and 2013 in European countries. Values in tonnes/km. Adapted fromEC (2009a), Gjedrem et al (2012) and Maps of World (2015).
Tonnes/km/year
Portugal 4.97
Spain 51.76
France 43.71
Ireland 28.88
Greece 8.45
United Kingdom 15.81
Italy 20.50
Norway 43.37
35 solutions are gradually emerging as an effect of cooperation between private and public sectors and aided by scientific research (Belton et al., 2004; CCMAR, 2015; Kaiser et al., 2010; Salmar, 2015).
2.1.6.1. Recent evolution of farmed species
Farmed species production has increased by 33% in Portugal. The farmed/wild ratio for total production has grown in value, from 11.9% to 17.5%, and in volume, from 2.9% to 4.3%, attesting to the valuable products provided by this industry. In Portugal, this seafood production sector is mostly concentrated in four products, which encompass over 70% of the average total of farmed species between 2005 and 2013 (Figure 18).
Clam production, mainly of the Venerupis decussata species (grooved carpet shell) is the most important, with an average of 27% of the total between 2005 and 2013. Turbot production has recently increased, especially since 2009, from 4% to 16%. Two of the most important farmed products to consumers, gilthead seabream and seabass (Cardoso et al., 2013), have decreased their production in recent years. Seabream represented 23% (1 519 tonnes) in 2005 and in 2013 its quota of farmed products was 12% (1 201 tonnes). In seabass the reduction was more noticeable, from 1 530 tonnes (23%) to 455 tonnes, representing 5% of total aquaculture yield in 2013 (Figure 18) (INE, 2014a, 2013a, 2012a, 2011a, 2010a, 2009a, 2008a, 2007a, 2006a).
0 4 000 8 000 12 000
2005 2006 2007 2008 2009 2010 2011 2012 2013
To
n
n
es
Other species Clams Turbot Gilthead Seabream Seabass
36 Total production value of farmed species has also grown by 56.0% in this period (Figure 19). Production is more concentrated in value than in volume, and the four most important species are responsible for 89.6% of value. Clam and turbot concentrate 64.5% of average value (DGRM, 2014). Similar to the growth in volume, farmed turbot is the product most responsible for this progression in value, which rose a substantial 705.7% from 2005 to 2013. The price of farmed turbot registered a decrease for this period. Clam yield in this period also grew by 83.7%, with a recorded average price of 9.13 €/kg. This species is responsible for 44.4% of total value, making it the most important product in value of all farmed species (Table 4 and Figure 20) (INE, 2014a, 2013a, 2012a, 2011a, 2010a, 2009a, 2008a, 2007a, 2006a).
€ 0
€ 20 000
€ 40 000
€ 60 000
2005 2006 2007 2008 2009 2010 2011 2012 2013
m
€
Other species Clams Turbot Gilthead seabream Seabass
37 Conversely, gilthead seabream and seabass volume and value diminished. Seabass suffered the highest value reduction by 64.4%, while the production value of gilthead seabream decreased by 19.5%. Price variation of seabream was very small, with an average value of 5.05 €/kg. Seabass average value was 6.39 €/kg (Figure 20 and Table 4) (DGRM, 2014; INE, 2014a, 2013a, 2012a, 2011a, 2010a, 2009a, 2008a, 2007a, 2006a).
Table 4. Average price, price variation, and average overall value between 2005 and 2013, for the most important farmed species in Portugal (INE, 2014a, 2013a, 2012a, 2011a, 2010a, 2009a, 2008a, 2007a, 2006a).
Average price (€/kg) of farmed species
Price variation for the (2005—2013
period)
Overall average value for the 2005 –
2013 period (m€) Gilthead seabream 5.05 1.8% 6 584 14.2%
Turbot 6.53 -26.7% 9 300 20.0%
Seabass 6.39 19.7% 5 072 10.9%
Clams 9.13 29.7% 20 636 44.4%
€4,00
€8,00
€12,00
2005 2006 2007 2008 2009 2010 2011 2012 2013
Pri
ce
(
€
/kg)
Turbot Seabass Clams Gilthead seabream
39
3.
Methodology
In order to understand the Portuguese seafood market, the identification of the most important products, consumed volumes, the ratios at which these are imported, exported, farmed and fished by means of regulated, subsistence or illegal fishing is essential. Although Portugal has a high seafood consumption value, information regarding consumed species is limited (Almeida et al., 2015), and the highly aggregated data makes it unmanageable to detach individual from aggregated chains in most cases (Rodgers et al., 2008). The currently available consumption data has limitations contingent to the methodology used to collect and process them. Food balance sheets tend to overestimate consumption, and questionnaires are dependent on the methodologies employed; however, a combination of the two can lead to more thorough and complete results (Almeida et al., 2015). Therefore, and given these constraints, this thesis proposes a new approach to the problem, using distinct data sources and literature from other authors in order to accomplish the required steps.