Network analysis identifies weak and strong links
in a metapopulation system
Alejandro F. Rozenfelda,1,2, Sophie Arnaud-Haondb,c,2, Emilio Herna´ndez-Garcíad, Víctor M. Eguíluzd, Ester A. Serra˜ob, and Carlos M. Duartea
aInstituto Mediterraneo de Estudios Avanzados (Consejo Superior de Investigaciones Científicas–Universidad de las Islas Baleares), C/Miquel Marque´s 21,
07190 Esporles, Mallorca, Spain;bCentro de Cieˆncias do Mar do Algarve, Centro Interdisciplinar de Investigac¸a˜o Marinha e Ambiental–Laborato´rio
Associado, Universidade do Algarve, Gambelas, 8005-139 Faro, Portugal;dInstituto de Física Interdisciplinar y Sistemas Complejos (Consejo Superior de
Investigaciones Científicas–Universidad de las Islas Baleares), Campus Universitat de les Illes Balears, E-07122 Palma de Mallorca, Spain; andcInstitut Franc¸ais
de Recherche pour l’Exploitation de la Mer, Centre de Brest, BP70, 29280 Plouzane´, France
Edited by James H. Brown, University of New Mexico, Albuquerque, NM, and approved October 16, 2008 (received for review June 8, 2008) The identification of key populations shaping the structure and
connectivity of metapopulation systems is a major challenge in population ecology. The use of molecular markers in the theoret-ical framework of population genetics has allowed great advances in this field, but the prime question of quantifying the role of each population in the system remains unresolved. Furthermore, the use and interpretation of classical methods are still bounded by the need for a priori information and underlying assumptions that are seldom respected in natural systems. Network theory was applied to map the genetic structure in a metapopulation system by using microsatellite data from populations of a threatened seagrass, Posidonia oceanica, across its whole geographical range. The net-work approach, free from a priori assumptions and from the usual underlying hypotheses required for the interpretation of classical analyses, allows both the straightforward characterization of hi-erarchical population structure and the detection of populations acting as hubs critical for relaying gene flow or sustaining the metapopulation system. This development opens perspectives in ecology and evolution in general, particularly in areas such as conservation biology and epidemiology, where targeting specific populations is crucial.
conservation biology兩 gene flow 兩 networks 兩 population genetics
U
nderstanding the connectivity between components of ametapopulation system and their role as weak or strong links remains a major challenge of population ecology (1–3). Advances in molecular biology fostered the use of indirect approaches to understand metapopulation structure, based on describing the distribution of gene variants (alleles) in space within the theoretical framework of population genetics (4–7). Yet, the premises of the classical Wright–Fisher model (4, 6), such as ‘‘migration-drift’’ and ‘‘mutation-drift’’ equilibrium (8), ‘‘equal population sizes’’ or symmetrical rate migration among populations, are often violated in real metapopulation systems. Threatened or pathogen species, for example, are precisely studied for their state of demographic disequilibrium due to decline and local extinctions in the first case, or to their complex dynamics of local decline and sudden pandemic burst in the second. Furthermore, the underlying hypotheses of equal pop-ulation size and symmetrical migration rates hamper the iden-tification of putative population ‘‘hubs’’ centralizing migration pathways or acting as sources in a metapopulation system, which is a central issue in ecology in general, and in conservation biology or epidemiology in particular. Finally, complementary methods of genetic structure analyses, such as hierarchical AMOVA and coalescent methods rely on a priori information (or priors) as to the clustering or demographic state of popula-tions, requiring either subjective assumptions or the availability of reliable demographic, historical or ecological information that are seldom available.
Network theory is emerging as a powerful tool to understand the behavior of complex systems composed of many interacting
units (9–11). This approach has been applied to solve a broad array of problems (12–14). In an ecological context, it has been applied to represent geographical landscape connectivity (15, 16), but only recently it has been adapted to represent genetic relationships among populations or individuals (17, 18). Yet, relevant properties of networks, such as resistance (9) to per-turbations (i.e., node paralysis or destruction), the ability to host coherent oscillations (19) or the predominant importance of nodes or clusters of nodes in maintaining the integrity of the system or relaying information through it can be deducted from the network topology and specific characteristics (10, 11). Here, we apply network theory to population genetics data of a threatened species, the Mediterranean clonal seagrass Posidonia oceanica. This clonal seagrass endemic to the Mediterranean has the slowest clonal growth rate of all seagrasses (20) and, although major sexual reproduction events are rare in time (21), the relative contribution of sexual versus clonal reproduction may be relatively high in some populations (22). P. oceanica clones produce both male and female flowers, and the fruits are buoyant and can drift tens of kilometers before they lose buoyancy and the seed settles in the seafloor initiating a clone (21). P. oceanica can also disperse from fragments, which can be transported by currents and can eventually become rooted at distant populations, as shown by recent analysis of patch for-mation in P. oceanica populations (23). Moreover, limited dispersal has been inferred (22) from its high population genetic structure at geographic scales ranging from the whole Mediter-ranean to regional and even local meadow scales.
We start by analyzing data at the Mediterranean scale, where clustering of the populations distributed in 2 basins connected by a narrow strait and that were almost isolated during the last glaciation, was rather obvious a priori. This particular geograph-ical and historgeograph-ical context facilitated the classgeograph-ical analysis of molecular variance (AMOVA) and allows using this example to validate our network analysis and confirm its potential, without a priori knowledge or assumptions, to characterize population genetic structure and to identify populations that are critical to the dynamics and sustainability of the whole system. We then compared classical and network tools at the regional scale of the
Author contributions: A.F.R., S.A.-H., E.H.-G., V.M.E., E.A.S., and C.M.D. designed research; A.F.R., S.A.-H., and E.H.-G. performed research; A.F.R. and V.M.E. contributed new re-agents/analytic tools; A.F.R., S.A.-H., E.A.S., and C.M.D. analyzed data; and A.F.R., S.A.-H., E.H.-G., V.M.E., E.A.S., and C.M.D. wrote the paper.
The authors declare no conflict of interest. This article is a PNAS Direct Submission.
Freely available online through the PNAS open access option.
1To whom correspondence should be addressed. E-mail: alex@ifisc.uib.es. 2A.F.R. and S.A.-H. contributed equally to this work.
This article contains supporting information online atwww.pnas.org/cgi/content/full/ 0805571105/DCSupplemental.
Spanish coasts, a more common case in population genetics where no strong expectations can be suggested as to the distri-bution of connectivity among populations or clusters of popu-lations. The results open major perspectives in evolutionary ecology, and more specifically in conservation biology and epidemiology where the capacity to target populations requiring major efforts toward conservation or control is crucial. Results and Discussion
We build networks of population connectivity for a system of 37 meadows of the marine plant P. oceanica, sampled across its entire geographic range—the Mediterranean Sea—by using 7 microsatellite markers (22). The network was built by consider-ing any pair of populations as linked when their genetic distance [Goldstein distance (24)] is smaller than a suitably chosen distance threshold (see Materials and Methods). We highlight these links as the relevant genetic relationships either at the Mediterranean (the full dataset) or at the regional (28 popula-tions along Spanish coasts) scales.
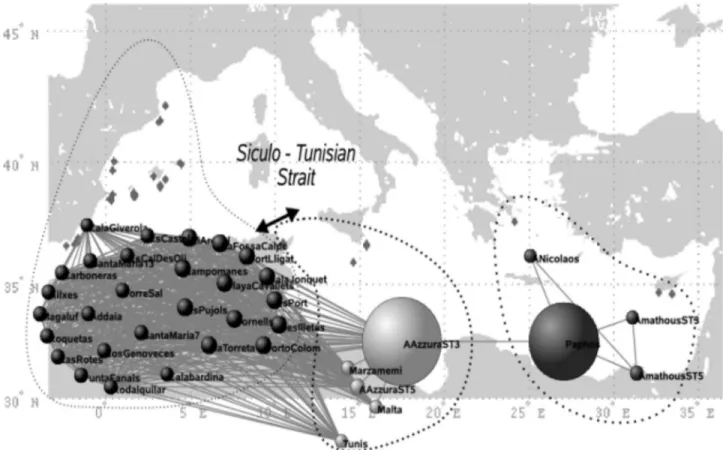
The topology of the network obtained at the Mediterranean scale (Fig. 1) highlights, without using any a priori geographical information, the historical cleavage between Eastern and West-ern basins (22) and the transitional position of the populations from the Siculo–Tunisian Strait (see Fig. 1). Besides this graph-ical representation, closer to reality than the usual binary trees, indices derived from the holistic analyses of network topology allow unraveling some dynamic properties in terms of gene flow through this network of populations. The average clustering coef-ficient,具C典 ⫽ 0.96, is significantly higher than the one expected after randomly rewiring the links (具C0典 ⫽ 0.76 with0⫽ 0.02, after 10,000
randomizations) revealing the existence of clusters of populations
more interconnected than expected by chance. The values of betweenness centrality, quantifying the relative importance of the meadows in relaying information flow through the network, im-mediately highlight a meadow in Sicily (present in 21% of all shortest paths among populations), together with another one in Cyprus (16%), as the main stepping stones between the pairs of populations sampled in the Western and Eastern basins, respec-tively [Fig. 1 and supporting information (SI) Table S1]. These results are therefore in agreement with the genetic structure revealed with classical population genetics analysis (AMOVA), revealing past vicariance (22) and a secondary contact zone in the Siculo–Tunisian Strait. The metapopulation structure, the cluster-ing and the ‘‘transition zones’’ derived from the network analysis arise without any a priori input on clustering as needed for AMOVA and without using geographic information that was needed in an analysis of allelic richness previously performed to support the existence and localization of a contact zone (22). This example allowed us to test the accuracy of network analysis on a population genetics dataset by comparing its results with a well-understood case, where the expected clustering of populations and pathways are rendered almost obvious by the geography (2 clusters of marine populations split by land and communicating only through a narrow strait). This comparison has been a demonstra-tion of the reliability of network analysis for revealing the patterns of population connectivity within a species range.
We then examined a nontrivial case: 28 populations sampled along Spain’s continental coasts and in the Balearic islands, more extensively and homogeneously sampled than the rest of the Mediterranean (Table S1). Classical tools resulted in a matrix of pairwise genetic distances (FSTor Goldstein distance) showing
significant differentiation among almost all meadows (except 1
Fig. 1. The network of Mediterranean meadows in which only links with Goldstein distances smaller than the percolation distance Dp⫽ 91 (see Fig. 5) are present. Nodes representing populations are roughly arranged according to their geographic origin. The precise geographic locations are indicated as diamonds in the background map. One can identify 2 clusters of meadows, corresponding to the Mediterranean basins (east and west), separated by the Siculo–Tunisian Strait. The size of each node indicates its betweenness centrality (i.e., the proportion of all shortest paths getting through the node).
PHYSICS
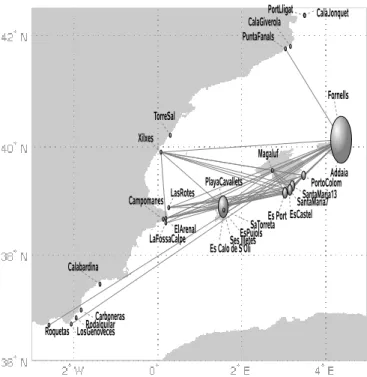
pair) without clear relationship with geographic location, no clear pattern of allelic richness, and a ‘‘comb-like’’ topology in an unweighted pair group method with arithmetic mean (UPGMA) tree, which forces dichotomous branching of the metapopulation network (Fig. 4A; see Materials and Methods). These methods were unable to highlight neither any particularly central position for the populations analyzed nor the clustering of some sub-groups that would have suggested preferential roads for gene flow or a dominant role of some populations in the metapopu-lation system. On the contrary, network analyses of these populations (Fig. 2 andTable S2) revealed a centralized struc-ture with particularly important roles for certain populations. The degree distribution, P(k), i.e., the proportion of nodes with k connections to other nodes, decays rapidly for large k (Fig. 3A) and the 6 highest values are all observed in samples collected in the Balearic Islands (Fig. 2 andTable S2). The average clustering coefficient of 具C典 ⫽ 0.4 was significantly higher than that obtained in the corresponding randomized networks (具C0典 ⫽
0.13 with0⫽ 0.05 after 10,000 realizations), whereas the local
clustering decays as a function of the degree k (Fig. 3B), which indicates that the central core is substructured into a small set of hubs, with high connectivity and low clustering, linking groups of closely connected nodes (i.e., with high clustering). Exami-nation of the relationship between the degree of a node and the average degree of the populations connected to it showed an abundance of links between highly connected and poorly con-nected nodes (Fig. 3C), a property termed dissortativity, present in many biological networks (25), and confirms again a central-ized topology. Observation of Fig. 2 indicates that seagrass populations along the Spanish continental coasts are genetically closer to Balearic populations than to geographically closer populations. The highest values of betweenness centrality (Table S2) are also attained at the Balearic populations, suggesting that the meadows of this region play or have played a central role in relaying gene flow at the scale of the Spanish coasts. Moreover, the betweenness centrality increases exponentially with the
connectivity degree k (Fig. 3D). The combination of all these findings implies a star-like structure where hubs are connected in cascade and the central core is the set of Balearic populations. A clear but more constrained perspective of this pattern is partly shown by the resulting minimum spanning tree (MST) of pop-ulations (Fig. 4B; see Materials and Methods), which, when analyzed with the network index of betweenness centrality highlights 3 of the major hubs encountered on the network. Yet, some other populations identified on the network appear as poorly connected on the MST, as a consequence of being a more constrained method, which finds the minimal paths required to maintain connectivity but not all of the important ones. The importance of nonminimal paths was underlined in ref. 15 in the context of geographical connectivity. This emphasizes again the advantage of the network illustration and analysis. The biological implication of these results is a great centrality of the Balearic Islands, acting or having acted as a hub for gene flow through the system.
Populations with high degree k might either be sources sustaining the system (i.e., spreading propagules), or sinks receiving gene flow from all of the other populations, or both. The extremely low rate of sexual recruitment inferred in popu-lations with low clonal diversity (R, see Materials and Methods) renders those, if highly connected, much more likely to disperse than to receive. The presence in the Balearic Islands of the 2 populations with the lowest observed clonal diversity and the highest connectivity (Es Port, R⫽ 0.1; k ⫽ 10; and Fornells R ⫽ 0.1; k⫽ 15), likely representing populations supplying ‘‘genetic material’’ to neighbor populations, suggests again that the Balearic islands are a key region for the dynamics and connec-tivity of the metapopulation system at the scale of the Spanish coast. Furthermore, 8 among 16 continental populations show extremely low connectivity (k⫽ 0), thereby allowing identifica-tion of those least likely to be rescued by other populaidentifica-tions if threatened. As in any genetic approach to metapopulation management, the role of currently observed connectivity in
Fig. 2. The network constructed for the Spanish meadows with the ‘‘geo-graphic threshold’’ criterion (see Fig. 6). Nodes are shown at the populations’ geographic locations. Node sizes characterize their betweenness centrality (i.e., the proportion of all shortest paths getting through the node).
0 5 10 15 k 10-2 10-1 100 P( degree > k) 0 5 10 15 k 0.4 0.6 0.8 1 C(k) 8 10 12 14 k 10-2 10-1 100 bc(k) 0 5 10 15 k 5 10 15 < k nn (k) >
A
B
C
D
Fig. 3. Main topological properties found by analyzing the structure of the network of meadows at the Spanish basin scale (Fig. 2). (A) The complemen-tary cumulative degree distribution P(degree⬎k). (B) The local clustering C(k). (C) The average degree具knn(k)典 in the neighborhood of a meadow with degree
k. (D) the degree-dependent betweenness, bc(k), as a function of the connec-tivity degree k.
future population rescuing is more important if current connec-tivity is limited by dispersal ability rather than by factors affecting survival after dispersal that could change in the future in decaying populations. Additionally, given the particular mil-lenary nature of P. oceanica clones, current genetic structure is likely to integrate patterns of gene flow over past centuries and thus may not reflect present-day dynamics.
Both networks, that at the scale of the whole Mediterranean (Fig. 1) and that for the Spanish coasts (Fig. 2), presented ‘‘small world’’ properties (26), i.e., a diameter (L⫽ 1.39 and L ⫽ 1.63, respectively) shorter than expected for random networks (具L0典 ⫽
1.47 with0⫽ 0.01 and 具L0典 ⫽ 2.53 with0⫽ 0.15, respectively,
after 10,000 randomizations) whereas their clustering was much higher (see numerical values above), suggesting a highly hierar-chical substructure of tightly connected groups linked by a few ‘‘short-cuts.’’ This evidence for the appearance of short-cuts in gene flow at multiple geographical scales along the history of this species, indicates that rare events of large-scale dispersal have a significant impact on the genetic composition of populations. This result illustrates another benefit of holistic (i.e., taking into account all distances or relationships among agents) network approaches. In the absence of other data, the possible existence of sources tends to be indirectly inferred with classical tools by
pointing the populations exhibiting the highest levels of genetic diversity. Here, network analyses revealed that, despite unusu-ally low sexual recruitment in these particular populations, as revealed by low clonal diversity [i.e., low relative contribution of sexual versus clonal reproduction (22)], they are—or have been—important as paths of gene flow in the system.
Our results demonstrate that, in line with progresses allowed by the use of graph theory in landscape ecology (16), network analyses provide a holistic and powerful approach to unravel genetic structure and connectivity at different spatial scales. First, they can be formulated as free of a priori hypotheses about the clustering of populations or of some underlying assump-tions—such as Fisher–Wright equilibrium—that are required to run or interpret classical analyses, but are seldom respected in nature. They allow to accurately study gene flow in clonal organisms by removing the prerequisite of genotypic frequency equilibrium required by assignment-based methods. Second, they allow unraveling properties that could not be highlighted by classical methods alone. The use of specific network properties such as the betweenness centrality and the degree distribution allows to identify populations relaying gene flow, or acting as sources supplying the system, in addition to achieving a quan-titative ranking of populations depending on their respective roles in the dynamics of the system. Third, network analysis tools provided graphical representations of the genetic relatedness between populations in a multidimensional space (17), free of some of the constraints (e.g., binary branching) compulsory in classical methods describing population relationships. Finally, network analyses are based on distances, which will allow future users to modulate and choose, among the wide panel of distances applicable to molecular data, the most appropriate ones for the particular questions addressed, for the life history traits of the model organism and for the type of molecular markers used. Here, we chose Goldstein distance to study the integration of gene flow over a geological time scale with microsatellite data on a clonal seagrass presenting a pattern of strong genetic structure and ancient divergence. Depending on the time scale that is relevant for the questions addressed, one may choose to use other markers and/or other distances. Additionally, comparison of networks obtained with different markers and distances for the same system may allow inferences as to the evolution of gene flow and connectivity through time. To conclude, addressing gene flow by using network tools may prove a powerful addi-tional analysis in critical areas such as conservation biology, dealing with threatened or invasive species, and epidemiology, for both of which the definition of target populations to be conserved or eradicated is of crucial importance.
Materials and Methods
Molecular Data. Approximately 40 Posidonia shoots collected at each of the 37 sampled populations (Fig. 1 andTable S1) were genotyped with a previously selected set of 7 dinucleotide microsatellites (27) allowing the identification of clones (also called genets for clonal plants). Clonal diversity was estimated for each population as described in Arnaud-Haond et al. (27, 28), by means of the clonal richness index R defined in terms of the number G of different
geno-types found in N plant samples: R⫽ (G ⫺ 1)/(N ⫺ 1). Replicates of the same
clone were excluded for the estimation of interpopulation distances. The matrix of interpopulation distances was built by using Goldstein metrics (24), thus taking into account the level of molecular divergence among alleles, besides the differences in allelic frequencies.
Networks. We first built a fully connected network with the 37 populations
considered as nodes. Each link joining pairs of populations was labeled with the Goldstein distance among them. Because we are aiming at detecting important key nodes to the (genetic) flow in the network, it becomes of crucial importance to examine the situation under which the structure of the net-work becomes disconnected into small clusters. Below that point (the perco-lation point), the network looses its ability to transport resources across the whole system. We then removed links from this network of genetic similarity, starting from the one with the largest genetic distance and following in Fig. 4. Classical tree-like representations of genetic structure for the Spanish
meadows. (A) UPGMA tree based on Goldstein distances, displaying a quite uninformative comb-like structure. (B) Minimum Spanning Tree (MST) based on Goldstein distance among Spanish meadows. This is the subgraph that connects the populations at the Spanish coast scale minimizing the total genetic distance along links, with the diameter of nodes illustrating their index of betweeness centrality according to the topology of the MST.
PHYSICS
decreasing order, until the network reaches the percolation point (29), be-yond which it loses its integrity and fragments into small clusters. This means that gene flow across the whole system is disabled if connections at a distance smaller than this critical one, Dp, are removed. The precise location of this percolation point is made with the standard methodology adequate for finite systems (29), i.e., by calculating the average size of the clusters excluding the largest one,
具S典* ⫽N1
冘
s⬍Smax s2n
s, [1]
as a function of the last distance value removed, thr, and identifying the critical distance with the one at which具S典* has a maximum. N is the total number of nodes not included in the largest cluster and nsis the number of
clusters containing s nodes. Here, we find Dp⫽ 91, as shown in Fig. 5. Once the network at percolation point is obtained, we analyzed its topol-ogy and characteristics (See Fig. 1 andTable S1) and interpret those
biologi-cally. The first column inTable S1) contains also the estimated clonal diversity
R of the different populations, defined as the proportion of different
geno-types found with respect to the total number of collected shoots.
At the Spanish coasts scale, no percolation point is found by using the above procedure, meaning that the genetic structure in this area is rather different from the one at the whole-Mediterranean scale. To construct a useful network representation of the meadows’ genetic similarity, the following alternative process was applied to determine a relevant distance threshold, thr, above
which links are discarded (seeMovie S1with the network of Spanish basin at
a full sequence of thresholds). At a very low threshold (thr⫽ 16), only the inner
part of a central core, constituted by some meadows from the Balearic Islands, is connected. As the threshold is increased, new meadows (from the central
Spanish coast) become connected (thr⫽ 20). Beyond that value, more
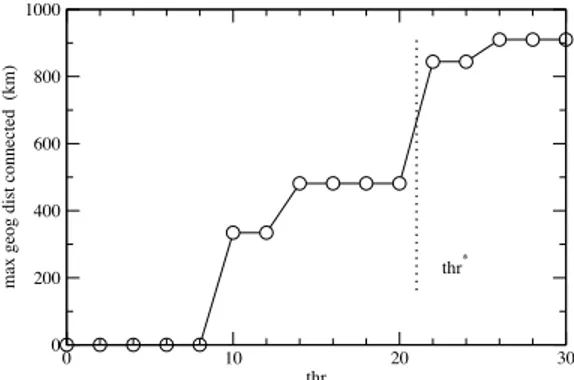
periph-eral meadows are connected from the northern and southern Spanish coasts. The geographical extension of the connected cluster (Fig. 6) grows with the
distance threshold and an important jump occurs at thr⫽ 22, when the
northern and southern coasts get connected for the first time. Further dis-tance-threshold increase does not contribute to geographical extension.
Therefore, we find the value thr⫽ 22 and the resulting network as
appropri-ate for topological characterization, because at this point the network con-tains a rich mixture of strong and weak links spanning all of the available geographic scales within the Mediterranean Spanish coasts. The determina-tion of this ‘‘geographic threshold’’ is similar in spirit to the determinadetermina-tion in ref. 30 of plateaus and discontinuities in network descriptors to identify relevant spatial scales.
Estimates of Global and Local Properties of the Network. The degree kiof a given node i is the number of other nodes linked to it (i.e., the number of neighbor nodes). The distribution P(k) gives the proportion of nodes in the network having degree k.
We denote by Eithe number of links existing among the neighbors of node
i. This quantity takes values between 0 and Ei(max)⫽ ki(ki⫺ 1)/2, which is the
case of a fully connected neighborhood. The clustering coefficient Ciof node
i is defined as: Ci⫽ Ei Ei共max兲 ⫽ 2Ei ki共ki⫺ 1兲 . [2]
The clustering coefficient of the whole network具C典 is defined as the average
of all individual clustering coefficients in the system. The degree dependent
clustering C(k) is obtained after averaging Cifor nodes with degree k.
Real networks exhibit correlations among their nodes (25, 31–36) that play an important role in the characterization of the network topology. Those node correlations are, furthermore, essential to understand the dynamical aspects such as spreading of information or their robustness against targeted or random removal of their elements. In social networks, nodes having many connections tend to be connected with other highly connected nodes. This characteristic is usually referred to as assortativity, or assortative mixing. On the other hand, technological and biological networks show rather the prop-erty that nodes having high degrees are preferably connected with nodes having low degrees, a property referred to as dissortativity. Assortativity is
usually studied by determining the properties of the average degree具knn典 of
neighbors of a node as a function of its degree k (25, 35, 37). If this function is increasing, the network is assortative, because it shows that nodes of high-degree connect, on average, to nodes of high degree. Alternatively, if the function is decreasing, as in our present case, the network is dissortative, as nodes of high degree tend to connect to nodes of lower degree. In this last case, the nodes with high degree are therefore central hubs ensuring the connection of the whole system.
The betweenness centrality (38) of node i, bc(i), counts the fraction of
shortest paths between pairs of nodes that pass through node i. Letstdenote
the number of shortest paths connecting nodes s and t andst(i) the number
of those passing through the node i. Then,
bc共i兲 ⫽
冘
s⫽t⫽i st共i兲
st
. [3]
The degree-dependent betweeness, bc(k), is the average betweeness value of nodes having degree k.
Minimum Spanning Tree. Given a connected, undirected graph, a spanning tree
of that graph is a subgraph without cycles that connects all of the vertices together. A single graph can have many different spanning trees. Provided each edge is labeled with a cost (in our analysis the genetic distance among the connected populations) each spanning tree can be characterized by the sum of the cost of its edges. A minimum spanning tree is then a spanning tree with minimal total cost. A minimum spanning tree is in fact the minimum-cost subgraph connecting all vertices, because subgraphs containing cycles neces-sarily have more total cost. Fig. 4 shows the minimum spanning tree for the Spanish meadows. The star-like structure centered at Balearic populations is evident, although the restriction of being a tree prevents some of the well-connected populations of the network approach to be identified here.
0 20 40 60 80 100 threshold 1 1.5 2 2.5 3 3.5 4 < S > * Percolation Threshold
Fig. 5. The average cluster size excluding the largest one, as a function of the imposed genetic threshold, at the whole Mediterranean scale. This identifies Dp⫽ 91 as the percolation threshold.
0 10 20 30 thr 0 200 400 600 800 1000
max geog dist connected (km) thr *
Fig. 6. The maximal geographic distance connected (at the Spanish coasts scale) as a function of the imposed distance threshold (thr). Above thr⫽ 22 the maximal geographic distance covered by connected populations nearly du-plicates, and this value—a ‘‘geographic threshold’’—is chosen to construct the corresponding network.
ACKNOWLEDGMENTS. We thank Franc¸ois Bonhomme and Pierre Boudry for useful discussions, and two anonymous referees for constructive criti-cisms and suggestions that helped improving a previous manuscript. This work was supported by the Spanish Ministry of Education and Science and the Fondo Europeo de Desarrollo Regional through Project FISICOS
(FIS2007-60327), the Portuguese Fundac¸a˜o para a Cieˆncia e a Technologia and Fondo Europeo de Desarrollo Regional through project NETWORK-(POCI 2010), and a postdoctoral fellowship (S.A.-H.), the BBVA Foundation (Spain), and the European Commission through the NEST-Complexity project EDEN (043251).
1. Haydon DT, Cleaveland S, Taylor LH, Laurenson MK (2002) Identifying reservoirs of infection: A conceptual and practical challenge. Emerging Inf Dis 8:1468 –1473. 2. Travis JMJ, Park KJ (2004) Spatial structure and the control of invasive alien species.
Anim Conservation 7:321–330.
3. Williams JC, ReVelle CS, Levin SA (2004) Using mathematical optimization models to design nature reserves. Front Ecol Environ 2:98 –105.
4. Fisher RA (1930) The Genetical Theory of Natural Selection (Clarendon, Oxford). 5. Haldane J (1932) The Causes of Evolution (Longmans Green, London, UK). 6. Wright S (1931) Evolution in Mendelian populations. Genetics 16:97–159. 7. Wright S (1943) Isolation by distance. Genetics 28:114 –138.
8. Hey J, Machado CA (2003) The study of structured populations—New hope for a difficult and divided science. Nat Rev Genet 4:535–543.
9. Albert R, Jeong H, Barabasi AL (2000) Error and attack tolerance of complex networks.
Nature 406:378 –382.
10. Amaral LAN, Scala A, Barthelemy M, Stanley HE (2000) Classes of small-world networks.
Proc Natl Acad Sci USA 97:11149 –11152.
11. Strogatz SH (2001) Exploring complex networks. Nature 410:268 –276.
12. May RM (2006) Network structure and the biology of populations. Trends Ecol Evol 21:394 –399.
13. Proulx SR, Promislow DEL, Phillips PC (2005) Network thinking in ecology and evolu-tion. Trends Ecol Evol 20:345–353.
14. Watts DJ (1999) Networks, dynamics, and the small-world phenomenon. Am J Sociol 105:493–527.
15. McRae BH, Beier P (2007) Circuit theory predicts gene flow in plant and animal populations. Proc Natl Acad Sci USA 104:19885–19890.
16. Urban D, Keitt T (2001) Landscape connectivity: A graph-theoretic perspective. Ecology 82:1205–1218.
17. Dyer RJ, Nason JD (2004) Population graphs: The graph theoretic shape of genetic structure. Mol Ecol 13:1713–1727.
18. Rozenfeld AF, et al. (2007) Spectrum of genetic diversity and networks of clonal populations. J R Soc Interface 4:1093.
19. Lago-Fernandez LF, Huerta R, Corbacho F, Siguenza JA (2000) Fast response and temporal coherent oscillations in small-world networks. Phys Rev Lett 84:2758 –2761. 20. Hemminga MA, Duarte CM (2001) Seagrass Ecology (Cambridge Univ Press,
Cam-bridge, UK)
21. Diaz-Almela E, et al. (2006) Patterns of seagrass (Posidonia oceanica) flowering in the Western Mediterranean. Mar Biol 148:723–742.
22. Arnaud-Haond S, et al. (2007) Vicariance patterns in the Mediterranean Sea: East-west cleavage and low dispersal in the endemic seagrass Posidonia oceanica. J Biogeogr 34:963–976.
23. Diaz-Almela E, et al. (2008) Patch dynamics of the Mediterranean seagrass Posidonia
oceanica: Implications for recolonisation process. Aquat Bot 89:397– 403.
24. Goldstein DB, Linares AR, Cavalli-Sforza LL, Feldman MW (1995) Genetic absolute dating based on microsatellites and the origin of modern humans. Proc Natl Acad Sci USA 92:6723–6727. 25. Newman MEJ (2002) Assortative mixing in networks. Phys Rev Lett 89:208701. 26. Watts DJ, Strogatz SH (1998) Collective dynamics of ‘small-world’ networks. Nature
393:440 – 442.
27. Arnaud-Haond S, et al. (2005) Assessing genetic diversity in clonal organisms: Low diversity or low resolution? Combining power and cost efficiency in selecting markers.
J Hered 96:434 – 440.
28. Arnaud-Haond S, Belkhir K (2007) GenClone 1.0: A new program to analyse genetics data on clonal organisms. Mol Ecol Notes 7:15–17.
29. Stauffer D, Aharony A (1994) Introduction to Percolation Theory (Taylor & Francis, London).
30. Brooks CP (2006) Quantifying population substructure: Extending the graph-theoretic approach. Ecology 87:864 – 872.
31. Barrat A, Pastor-Satorras R (2005) Rate equation approach for correlations in growing network models. Phys Rev E 71:036127.
32. Bogun˜a´ M, Pastor-Satorras R (2003) Class of correlated random networks with hidden variables. Phys Rev E 68:036112.
33. Maslov S, Sneppen K (2002) Specificity and stability in topology of protein networks.
Science 296:910 –913.
34. Newman MEJ (2003) Mixing patterns in networks. Phys Rev E 67:026126. 35. Pastor-Satorras R, Vazquez A, Vespignani A (2001) Dynamical and correlation
proper-ties of the internet. Phys Rev Lett 87:258701.
36. Vazquez A, Pastor-Satorras R, Vespignani A (2002) Large-scale topological and dynam-ical properties of the internet. Phys Rev E 65:066130.
37. Lee SH, Kim PJ, Jeong H (2006) Statistical properties of sampled networks. Phys Rev E 73:016102.
38. Freeman LC (1977) Set of measures of centrality based on betweenness. Sociometry 40:35–41.
PHYSICS