Comparative Analysis of Residential Energy
Consumption in Different European Countries
Mestrado em Engenharia da Energia e do Ambiente
Mario Andrés Viteri Gaibor
Comparative Analysis of Residential Energy
Consumption in Different European Countries
Mestrado em Engenharia da Energia e do Ambiente
Mario Andrés Viteri Gaibor
Dissertação realizada sob a orientação do Professor Doutor Luís Miguel Pires Neves e do Professor Doutor Sotirios Karellas
A presente dissertação é original, elaborada unicamente para este fim, tendo sido devidamente citados todos os autores cujos estudos e publicações contribuíram para a elaborar.
Reproduções parciais deste documento serão autorizadas na condição de que seja mencionado o Autor e feita referência ao ciclo de estudos no âmbito do qual a mesma foi realizada, a saber, Curso de Mestrado em Engenharia da Energia e do Ambiente, no ano letivo 2018/2019, da Escola Superior de Tecnologia e Gestão do Instituto Politécnico de Leiria, Portugal, e, bem assim, à data das provas públicas que visaram a avaliação deste trabalho.
I appreciate the amazing opportunity I had to learn and grow my knowledge on energy and sustainability by the performance of this thesis in a very interesting topic, both technically and theoretically.
I would like to thank my supervisors, Professor Luis Neves and Professor Sotirios Karellas, for the invaluable help and guidance. I am grateful to my joint supervisor, Platon Pallis. I appreciate his contribution of time and ideas to make my work productive. His valuable suggestions, comments, and guidance encouraged me to learn more.
I also have to thank the researcher team of the Laboratory of Steam Boilers and Thermal Plants of the National Technical University of Athens for all the help they gave me during the development time of this investigation. Thanks to all those who also contributed to my previous professional and academic background.
Last, but not least, I would like to thank my family, for their unconditional support, encouragement, and love despite the distance; I would not have come so far without them. This work was supported by the project n.º 023651 "Learn2Behave - Caracterização de comportamentos para promoção de eficiência no consumo de energia através de abordagens PBL (IIA - 02/SAICT/2016)”, financed by FEDER through the Programa Operacional Regional do Centro and the Programa Operacional Regional de Lisboa.
Mario Viteri 30/Sep/2019
A humanidade consome mais recursos naturais do que a capacidade que a Terra tem para regenerá-los. Diante desse problema, os olhos do mundo estão virados para a sustentabilidade. Várias ações para diminuir e consumir recursos naturais de maneira eficiente estão a realizar-se em todo o mundo. A União Europeia desenvolveu várias estratégias para o uso eficiente de recursos, incluindo a energia. Existe um alto potencial para economizar a energia no setor dos edifícios, principalmente na área de edifícios residenciais.
Este estudo focou-se nas residências unifamiliares para conhecer os fatores que afetam o consumo de energia por meio de uma análise comparativa da energia utilizada em residências de diferentes países do Mediterrâneo europeu. Os países escolhidos para esta análise foram a Grécia, Portugal e Espanha, países que compartilham condições meteorológicas, geográficas e políticas semelhantes. Para esta análise, apenas foi levada em consideração a energia utilizada para aquecimento e arrefecimento de ambientes e para aquecimento de água.
Dados estatísticos e regulamentações nacionais foram utilizadas para escolher duas regiões de cada país e representar uma casa típica de cada região. Os valores anuais de consumo da energia foram obtidos através de simulação dinâmica, testando a variação de parâmetros tais como temperatura interna, horário de operação dos sistemas e comportamento dos ocupantes com vista à análise do seu impacto.
Como resultado das simulações, obteve-se que o aquecimento de espaços é a atividade que mais consome entre as selecionadas, possuindo um grande potencial de economia de energia. O uso eficiente da energia mantém o conforto térmico dos ocupantes e reduz o consumo de energia. O estudo mostrou que vários fatores afetam o uso da energia, mas o principal é o comportamento humano, sendo por isso importante o papel das políticas reguladoras de consumo que alteram comportamento das pessoas.
A evolução das políticas na Europa tem sido notável nos últimos anos, mas é necessária a criação de políticas mais rígidas que ajam com rapidez suficiente. Os ocupantes devem
das múltiplas pequenas decisões que tomamos todos os dias para criar um futuro mais sustentável no nosso planeta.
Palavras chave: Comportamento humano, Consumo de energia no Mediterrâneo,
Humanity consumes more natural resources than the Earth has the ability to regenerate them. Given this problem, world eyes are over sustainability. Several actions for reducing and consume natural resources efficiently are being carried out worldwide. The European Union has developed several strategies for the efficient use of resources, including energy. There is a high potential for energy savings in the building stock sector, mainly in the residential buildings area.
This study focused on the single-family houses to know the factors that affect the energy consumption through a comparative analysis of the energy used in dwellings of different European Mediterranean countries. The countries chosen for this analysis were Greece, Portugal, and Spain, countries that share similar geographical, political and meteorological conditions. For this analysis, only was taken into account the energy used for space heating and cooling and water heating.
Using statistical data and national regulations, two regions of each country were chosen, and a typical house from each region was represented to obtain annual energy consumption results through simulation. Variable parameters such as internal temperatures, system operation hours and occupant behavior were tested on the models to see their impacts on energy consumption.
As a result of simulations, it was concluded that space heating is the activity that consumes the most among the selected ones, therefore, having a great potential for energy savings. The efficient use of energy keeps the thermal comfort of the occupants reducing the energy consumption. The study showed that several factors affect energy consumption, but the main one is human behavior. The role of energy policies are important over the consumption through people´s behavior.
The evolution of the policies in Europe has been remarkable in recent years, but they are not enough. Tighter policies that act fast enough are necessary. Occupants must balance the consumption between comfort and energy awareness, aiming to shift some of the
future on our planet.
Keywords: Human behavior and energy consumption, Mediterranean energy
Originalidade e Direitos de Autor ... iii
Acknowledgments ... iv
Resumo ... v
Abstract ... vii
Table of Contents ... ix
List of Figures ... xii
List of tables ... xiv
Acronyms ... xvi
Introduction ... 1
Literature Review ... 5
International Context ... 5
Energy Policies ... 8
2.2.1. Energy Efficiency Directive 2012/27/EU... 10
2.2.2. Energy Labeling Directive 2010/30/EU ... 11
2.2.3. Energy Performance of Building Directive (EPBD) 2018/844/EU... 12
2.2.4. Eco-design Directive 2009/125/EC ... 15
2.2.5. EU Strategy on Heating and Cooling. ... 15
Occupant Energy Behavior ... 16
Buildings ... 18
Related Works ... 19
Methodological Proposal ... 23
Use of Building simulation software ... 24
3.1.1. Software ... 24
3.1.2. Weather Data ... 24
Objectives for the selected countries ... 25
Case Study Definition ... 27
Country Selection ... 27
Greece ... 30
Portugal ... 33 4.3.1. Energy Overview PT ... 34 4.3.1. Buildings Overview PT ... 35 Spain ... 36 4.4.1. Energy Overview ES ... 37 4.4.1. Buildings Overview ES ... 38 Energy Policies ... 39 4.5.1. Policies GR ... 39 4.5.1. Policies PT ... 40 4.5.1. Policies ES ... 42 Demographic Analysis ... 45 Climate Zones ... 48 Energy Price ... 52
Definitions of Simulation Parameters ... 55
Constant Parameters ... 55
5.1.1. Periods of Construction ... 55
5.1.2. Useful Space in Building ... 59
5.1.3. Model of Representative Building ... 62
5.1.4. Envelope ... 64
5.1.5. HVAC Systems ... 65
5.1.6. Occupants ... 67
5.1.7. DHW Temperature and Consumption ... 68
5.1.8. Air Renovation ... 68
Variable Parameters... 69
5.2.1. Heating and Cooling Set Point Temperatures ... 69
5.2.2. HVAC Use Time ... 71
5.2.3. DHW ... 74
SFH Models ... 74
Average Energy Consumption ... 77
Results and Discussion ... 79
Application of Different Schedules ... 79
Comparison with Statistical Data ... 86 Conclusions ... 91
Figure 1. Energy label actually used ... 12
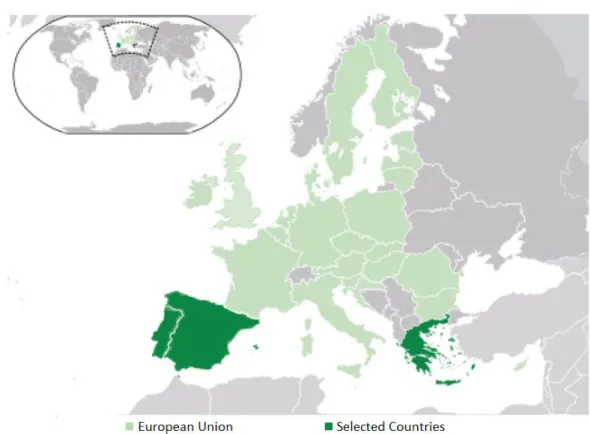
Figure 2. Location of the selected countries in Europe and in the EU ... 28
Figure 3. Primary energy consumption GR, PT, ES ... 29
Figure 4 . Greece gross inland energy consumption 2016 ... 31
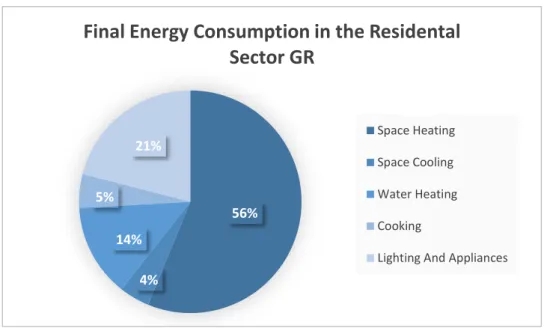
Figure 5. Residential energy consumption by final use GR ... 32
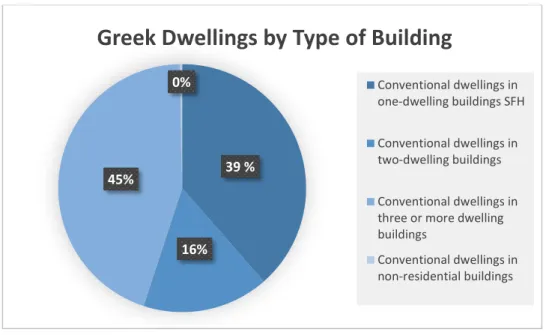
Figure 6. Dwellings by type of building GR ... 33
Figure 7. Portugal gross inland energy consumption 2016 ... 34
Figure 8. Residential energy consumption by final use PT ... 35
Figure 9. Dwellings by type of building PT ... 36
Figure 10. Spain gross inland energy consumption 2016 ... 37
Figure 11. Residential energy consumption by final use ES ... 38
Figure 12. Dwellings by type of building ES ... 39
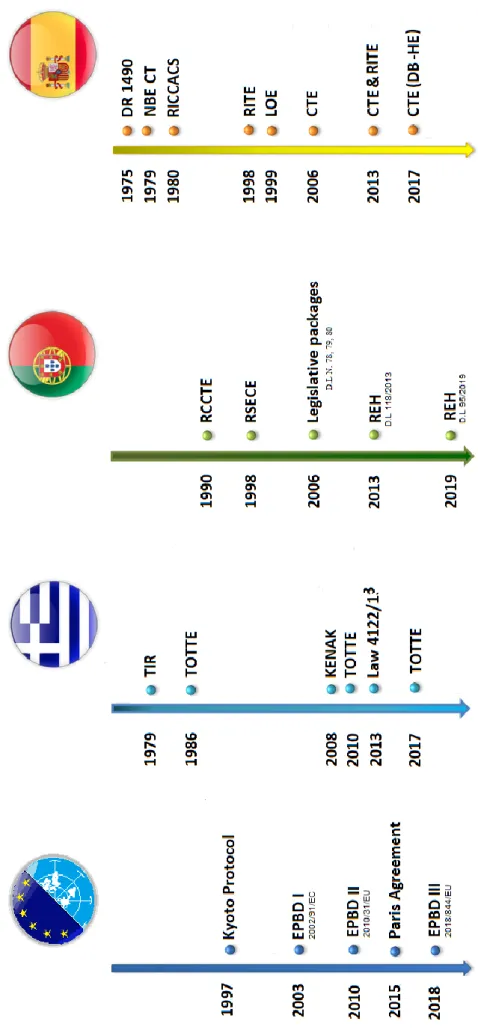
Figure 13. Timeline of policy implementation at national and international level ... 44
Figure 14. Most populated regions of Greece (NUTS 2) ... 46
Figure 15. Mostly populated regions of Portugal (NUTS 2) ... 47
Figure 16. Mostly populated regions of Spain (NUTS 2) ... 48
Figure 17. Greece climate division ... 50
Figure 18. Portugal climate division ... 51
Figure 19. Spain climate division ... 52
Figure 20. SFH Constructed by periods - GR ... 56
Figure 21. SFH Constructed by periods - PT ... 57
Figure 22. SFH Constructed by periods - ES ... 58
Figure 23. Percentage of Useful Floor Space of SFH by Country ... 60
Figure 24. Percentage of useful floor space of SFH by regions ... 60
Figure 25. SFH in Mediterranean weather in Spain ... 63
Figure 28. Range of cooling and heating temperature variation for each country ... 71
Figure 29. Schedule 1 ... 72
Figure 30. Schedule 2 (Weekdays) ... 72
Figure 31. Shedule 2 (Weekend) ... 73
Figure 32 Schedule 3 ... 73
Figure 33. SFH final simulation model for Attica region ... 75
Figure 34. SFH final simulation model for Central Macedonia region ... 75
Figure 35. SFH final simulation model for Lisbon region ... 75
Figure 36. SFH final simulation model for North region ... 76
Figure 37. SFH final simulation model for Madrid region ... 76
Figure 38. SFH final simulation model for Catalonia region ... 77
Figure 39. Results of energy consumption for heating with different schedules ... 80
Figure 40. Cooling energy consumption with different schedules ... 81
Figure 41. Cooling energy consumption with different schedules for Attica region ... 81
Figure 42. Energy consumption vs. set point temperature reduction in winter ... 82
Figure 43. Energy consumption vs. set point temperature increase in summer ... 83
Figure 44. Energy consumption vs. set point temperature increase in summer Attica ... 84
Figure 45. Percentage of energy savings in DHW when behavioral changes are applied ... 85
Figure 46. Results vs. indicators primary energy consumption for heating... 87
Figure 47. Results vs. indicators primary energy consumption for cooling ... 88
Figure 48. Results vs. indicators primary energy consumption for heating water ... 88
Table 1. Countries General Information ... 29
Table 2. Share of fuels in the final energy consumption in the residential sector, 2016 ... 29
Table 3. Greece general information ... 30
Table 4. Portugal general information ... 33
Table 5. Spain general information ... 36
Table 6. Greek population 2011, NUTS 2 ... 45
Table 7. Portuguese population 2011, NUTS 2 ... 46
Table 8. Spanish population 2011, NUTS 2 ... 47
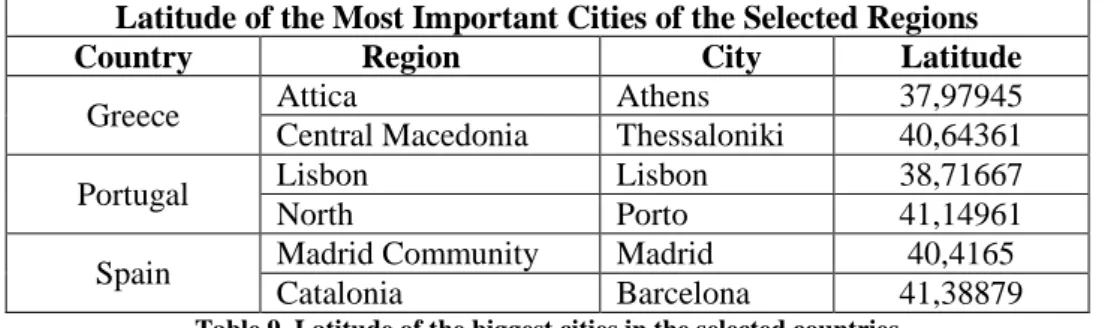
Table 9. Latitude of the biggest cities in the selected countries ... 48
Table 10. Heating degree-days for the selected locations NUTS 2 ... 49
Table 11. Cooling degree-days for the selected locations NUTS 2 ... 49
Table 12. Climatic Zones of the selected areas ... 52
Table 13. Electricity, natural gas and heating oil price 2018 ... 53
Table 14. SFH policy based construction periods - GR ... 57
Table 15. SFH policy based construction periods - PT ... 58
Table 16. SFH policy based construction periods - ES ... 59
Table 17. Selected period of the SFH for each region ... 59
Table 18. Useful area determined for the SFH in each region... 62
Table 19. Typical buildings orientation in the three countries. ... 64
Table 20. Average values of thermal transmittance for a SFH - GR ... 64
Table 21. Calculated values of thermal transmittance for a SFH - PT ... 65
Table 22. Minimum values of thermal transmittance for a SFH - ES ... 65
Table 23. Typical fuel sources for the HVAC system in each region and period ... 67
Table 24. Conversion factors for different energy sources ... 67
Table 25. Average number of persons per household ... 68
Table 28. Final model area and volume to be conditioned ... 77
Table 29. Average primary energy consumption for a SFH GR ... 78
Table 30. Average primary energy consumption for a SFH PT ... 78
Table 31. Average primary energy consumption for SFH ES ... 78
Table 32. Simulation result, annual final energy consumption for space heating and cooling ... 79
Table 33. Average energy saved by the reduction of 0,5 ˚C in the thermostat during winter ... 83
Table 34. Average energy saved by the increasing of 0,5ºC in the thermostat during summer... 84
Table 35. Average savings for the increasing and reduction of 0,5ºC in the thermostat ... 84
Table 36. Final energy consumption for DHW ... 85
Table 37. Economic savings of the application of the behaviors on the DHW consumption ... 86
ASHRAE American Society of Heating, Refrigerating and Air-Conditioning Engineers
CO2 Carbon Dioxide
CTE Technical Building Code
DB – HE Basic Document for Energy Saving
DL Law Decree
DHW Domestic Hot Water
EC European Commission
EE Energy Efficiency
EED Energy Efficiency Directive
EPBD Energy Performance of Building Directive ES / SP Spain
EU European Union
GDP Gross Domestic Product
GHG Greenhouse Gases
GR / EE Greece
HVAC Heating, Ventilation and Air Conditioning
KENAK Greek Regulation for the Energy Efficiency of Buildings LOE Building Planning Law
IEA International Energy Agency
NUTS Nomenclature of Territorial Units for Statistics NZEB Nearly Zero Energy Building
PT Portugal
RCCTE Regulation of Characteristics of Thermal Behavior of Buildings
RD Royal Decree
REH Energy Performance Regulation of Housing Buildings RITE Regulation of Thermal Installations in Buildings SCE System of Energy Certification of Buildings SFH Single Family House
TEE Technical Chamber of Greece
TOTEE Technical Codes of the Technical Chamber of Greece
UN United Nations
Introduction
Each year, humanity's demand for natural resources exceeds the Earth's own ability to regenerate them and the natural capacity to process and absorb greenhouse gases (GHG) and waste. Humanity consumes on average the equivalent of 1,7 planets in resources to meet its consumption rhythm. Understanding and accepting that we live in a world with limited resources and knowing the ecological limits for decision making will allow us to live in harmony with the planet. (Global Footprint Network, 2019)
In the world, the building and construction sector consumes 36% of final energy and generate up to 35% of energy-related GHG emissions (UNEP, 2017; IEA, 2019a). The residential subsector is the largest energy consumer of the entire building sector. (IEA, 2019a)
Moreover, if no action beyond current commitments is taken to improve the uptake of energy efficiency (EE) measures in the buildings sector, energy demand could increase. To avoid the increase of the energy demand and reduce it or at least stabilize it, multiple actions are required as policies, strategies, behavioral changes, new technology, infrastructure, financial planning and a great effort from all the involved areas. (IEA, 2017)
In 1983,Van Raaij & Verhallen, posed a question for their study. Why consumers do not have a conscious behavior related to the use of energy? In the end, several interesting answers were found; some of them even today can be applied to residential consumers. Consumers do not always know the costs of many household behaviors. The feedback information do not come on time, making people do not be aware of energy-wasting types of behavior. Energy consumers see energy conservation as a government or someone else problem. Many consumers are not willing to give up comfort, mainly related to room temperatures. The lack of effort and concern in the area by energy users. (Van Raaij & Verhallen, 1983)
One publication written by (UNEP, 2017a) shows how the creation of policies can be positively affected and have better results thanks to the understanding of the people´s behavior, also identifies behavioral barriers for sustainable development: 1. Many
“choices” in consumption are often habitual behaviors. 2. Consequences of consumption are often hard to see; 3. Sustainable consumption may seem irrelevant to consumers; 4. Behavior is influenced by the social environment; 5. For many consumers, maintaining sustainable behavior can be difficult. Policies must be created and designed in order to destroy the previous barriers, remembering that if it works in one place, for a specific population, may not always work in another.
Thus, the objective of this investigation is to perform a comparative analysis of the energy consumption used for space heating and cooling and water heating in single-family houses (SFH) in European countries, through the simulation of a representative and typical house of each country in order to determine the factors that influence on the energy consumption. To achieve the main objective is also required:
• Delimit and focus the study on specific regions of each country.
• Represent a SFH model with the typical and most representative characteristics of each region.
• Analyze national and community energy policies.
• Simulate the hose models created for the climates of each region.
• Know the occupant´s residential energy consumption behaviors in each country.
The analysis is focused on the comparison of the energy consumption of the residential area, specifically over SFH, represented by the most typical house, in two regions of three European Mediterranean countries, through the energy consumption simulation during one year, only taking into account the energy consumed by the space heating, cooling and water heating systems. The analysis also reflects some aspects of EE policies and different occupant behaviors. The main sources for the investigation were the Eurostat statistical database and the national statistical institutes of each country.
Therefore, the present investigation is structured in 7 chapters detailed below.
Chapter 1 is the introduction chapter; it defines the problem, establish the main and the specific objectives, the scope and the limits of the analysis and also describes, in general, the contents of this document.
Chapter 2 is about the theoretical framework; it gives a general international and local contextualization of the problem with the revision of some related literature; also reviews some contributions made by previous studies related to the purpose of the analysis.
Chapter 3 describes in detail the methodology that will be used to meet the stated objective and the process that will be carried out during document development.
Chapter 4 define the case, describe some characteristics of the analysis and the reasons why the countries were chosen; it gives a brief overview of each of them and describe some characteristics that are considered important for the present analysis. The chapter also analyzes and briefly compare the local energy policies with some other important international documents, directives, agreements and other relevant factors such as climate and demography, selecting the regions where the analysis will be focus on each country. Chapter 5 defines the parameters that will be used in the simulations. It details how each parameter was selected or defined. It divides the simulation parameters into constant and variable; the variable parameters somehow try to represent the behavior of the occupants of the SFHs.
Chapter 6 shows the simulations results carried out with the parameters defined in Chapter 5; the results are interpreted, compared and a brief discussion of them is made.
Chapter 7 finally shows the conclusions that were obtained from the analysis of energy consumption; some recommendations, and suggestions to deepen the analysis or for future research are presented.
Literature Review
This chapter is about the theoretical framework and the literature review. Here the established problem is analyzed in an international and regional context, together with the analysis of policies and directives for the efficient use of energy, a briefly reviewed of topics such as occupants energy behavior, the role of buildings in energy consumption and previous work related to the purpose of this investigation.
International Context
In the last few decades, the eyes of the world are over the sustainability that is why the United Nations (UN) using the framework of the Millennium Development Goals, in 2015 announced the 2030 Agenda for Sustainable Development. The agenda has 17 goals and 169 associated targets in areas of critical importance for humanity and the planet. Nowadays all the countries must implement methods in order to aim the objectives and generate positive changes in our present world. Many of the announced targets are related to reducing our environmental footprint, sustainable consumption and production, sustainably managing the natural resources and taking urgent action on climate change. (United Nation, 2015)
Several of these goals as the number 7, 11, 12, 13 and 15 are related with the promotion of the sustainable consumption of resources and energy, in diverse areas and with the protection of the planet. Specifically, the goal number 7 was created in order to change the current form of production and consumption of energy towards a more sustainable, clean and accessible for all. To reach it is necessary the implementation and generation of new solutions as fast as possible. The target 7.3 is particularly focused on by 2030 double the global rate of improvement in EE, the main indicator of compliance of this target is the energy intensity, measured in terms of primary energy and the Gross Domestic Product (GDP). (United Nations, 2019)
In the world panorama is also important to talk about the Paris agreement, written within the framework of the United Nations Framework Convention on Climate Change and adopted in 2015 by 195 countries to combat climate change and adapt to its effects in the context of sustainable development and environmental integrity. The agreement entered
into force on November 4 of 2016 and every 5 years there will be an evaluation of the progress towards achieving the purpose of the Agreement, requiring the best efforts of all parties through "nationally determined contributions".(UNFCCC, 2015)
At the European level, the European Commission (EC) establish as a priority the energy union and climate. The EE constitutes one of the five dimensions of the European Energy Union Strategy, designed to enhance energy security, sustainability, and competitiveness. The European Union (EU) set itself a target of 20% of energy-saving by 2020, focus the actions on sectors with the greatest energy-saving potential such as buildings. However, the EC objectives go further and even more challenging goals have already been set for 2030 and 2050. To achieve the objectives, several actions have been carried out, such as the establishment of directives, some financial plans and the creation and implementation of regional and national policies. (European Commission, 2019a)
According to Eurostat in 2016 in the EU, the energy consumption in the residential sector represented 25,4% of the total energy consumed by end-users in all the areas, excluding the energy used in the energy sector for delivery and transformation; residential consumption represents the second-largest consuming sector after transportation. The energy in the residential area is used for various purposes mainly space and water heating, space cooling, cooking, lighting, electrical appliances, and other end-uses. A little more than a third of all the energy used is covered by natural gas followed by electricity and then renewables; products derived from crude oil, derived heat and coal products are used in a small proportion. Most of the residential energy demand (79,2%) is used for space and water heating so here is where considerable saving could be attained. (Eurostat, 2019)
A non-homogeneous situation characterizes countries in Europe, different buildings type, available renewable technologies, climate, culture, and several variables to be considered (EPBD-CA, 2019).Based on each country characteristics, there are some differences; for instance, in the total amount of energy used by each state to the space heating, being Malta and Portugal, those uses less energy with 16% and 21,1% respectively. The most significant users are Luxemburg with 79,9% and Hungary with 74%. (Eurostat, 2019) At this point, it is essential to define the term Energy Efficiency. According to the US Energy Information Administration, the terms “Energy Efficiency” and “Energy Conservation” are related, but have some differences. Energy Efficiency is the use of
technology that requires less energy use to perform the same function, and Energy Conservation is any behavior that results in less energy consumption. (U.S. EIA, 2019) On the other hand, the EC defines Energy Efficiency as using less energy input for an equivalent level of economic activity or service. Therefore, the improvement of EE means an increase in energy efficiency as a result of technological, behavioral, and/or economic changes. (European Commission, 2019a)
One publication by (IEA, 2010), refers that the EE in final consumption plays an even more critical role in reducing energy consumption and emissions compared to the reduction provided by the production of energy from renewable sources. Energy saving is the most cost-effective way to increase security of supply and reduce import dependency. (European Parliament and Council of the European Union, 2009)
The efficient use of energy has benefits that go beyond savings in the price of the unused energy, it includes a lot of others benefits and co-benefits, like the reduction of local and global emissions, the decrease in health problems associated with air quality and another social and economic impacts. In general, these benefits can be classified in three groups, environmental, social and economic. (Reuter, et al., 2018)
The three main groups of benefits of efficient energy use were sub-classified into eight co-benefits. Inside the environmental main group are the global & local pollutants and energy and resource management; in the main social group are the life comfort and the energy poverty, and the economic main group contains the security and delivery of energy, macro & micro economic benefits and innovation and competitiveness. The author presents one or more indicator for each subgroup that allow the comparative analysis of the benefits of the applications of energetic measures and policies in every EU country over the time. (Reuter, et al., 2018)
There are two ways to save energy in a building, one of them is the implementation of saving technology as purchase LED illumination or improve de insulation of the building. It is evident that this measure involves some capital investment but offer an immediate long-term result and easily quantifiable. On the other hand the other way of achievement savings is related with the behavior of the occupants of the buildings. The implementation of behavioral changes implies low-cost or no-cost and does not need high-tech knowledge, but represent a high level of difficulty because it depends a lot of people´s owns factors
and at the same time may only has transitory effects, without consider that the results can be challenging to quantify. (Mills & Schleich, 2012)
However, in most cases, the potential for energy savings due to behavioral changes may be higher than the application of technological solutions. The results of the changes in energy behavior can be seen in all types of buildings, regardless of the conditions or their age because the behavioral changes are applied in people. The results can be perpetuated if the occupants develop an energy conservation culture being able to positively affect other occupants and other sectors like industrial or commercial ( Masoso & Grobler, 2010). With the application of strategies for modifying the behavior of people, it is possible to reduce individual energy consumption from 5 to 20% (EEA, 2013).
Energy Policies
For the generation of appropriate specific policies for each country, it is essential to take into account the specific differences between them in terms of energy-saving technology adoption and energy conservation practices. (Mills & Schleich, 2012)
The combination of fiscal instruments with policies can present better results. They can modify the consumer behavior and to reach the EE objectives. The two categories of financial instruments act oppositely; they are taxes and subsidies. Taxes influence the consumer by increasing the costs of specific goods and services, in contrast, subsidies incentive and influence the consumer to choose goods or services; in this case with favorable properties for the environment. (European Union, 2009)
The application of subsidies cost money to the government; for this reason, the government must try to avoid future expenses or to generate economic or other benefits. At the same time, subsidies can be target to a specific costumers group. On the other hand, most of the countries applied taxes to the transportation and use of energy; in some cases, it can have a regressive impact on low-income householder lead them to energy poverty.(European Union, 2009)
Depending on the product and market conditions, subsidies have more impact than taxes to promote EE. However, the application of fiscal instruments can also induce to adversely behaviors if they are not carefully designed and applied correctly or in some cases can generate a rebound effect (European Union, 2009). It means that the application of policies
does not always have the expected result, for instance, raise the price of energy does not always result in lower consumption. The understanding of human behavior is also crucial for the creation and application of policies with the use of this tool; better results are guaranteed. (UNEP, 2017a)
A quick and precise feedback by the energy suppliers can be useful for the customers to know the real cost of each activity that associates the consumption of some type of energy. A short time interval between energy use and payment, will be a more effective feedback mechanism; estimates bills most of the time confuse the householders and its worse when they have a poor knowledge of the real price of energy. In some countries sometimes, the energy price changes depending on the amount of use and the time of day. (Van Raaij & Verhallen, 1983)
The implementation of energy awareness campaigns with a small investment can somehow be considered as a small-scale policy. The campaigns can be of various types such as awareness campaigns, incentives, punitive measures, technology, etc. Another way to save energy is by just remembering the most straightforward and cheapest lesson with the most significant savings, the golden rule '' If you do not need it, do not use it! '' ( Masoso & Grobler, 2010). All this leads us to conclude that policies alone are not enough; behavioral changes are necessary to the transformation towards low carbon economy (European Union, 2015).
The applications of some EE policies start in most of the countries after the second oil crisis in the seventies and in the nineties of the last century at the European level. At the beginning of the EU, the policies were not intended for the regulation of buildings since the buildings did not affect the initial objectives of the free market and free mobility. That changed when energy union and climate change became subjects of EU in the 1990's. Then the EU started works to reduce the use of fossil fuels, and since buildings in the EU are responsible for around 40% of the energy consumption, they began to be part of regulations. The regulation of buildings was further promoted with the conclusions of the European Climate Change Program in 2000. (European Commission, 2019a)
Since then the EU members have adopted several low, medium or high impact energy policies, and these policies can be of different types as legislative/normative, legislative/informative, financial, fiscal, information/education, cooperative and taxes that
involve end-users and main actors of the energy consumption in all the areas. (European Commission, 2015)
The use of these policies has given positive results like the regular decrease of household energy consumption around 1,5% per year in the EU members since 2000. Some of these policies are related with diffusion of compact fluorescent lamps and light-emitting diode technology for lighting, the labeling and eco-design regulations for electrical appliance, new efficient buildings and the renovation of existing dwellings to reduce the energy use in space heating. (IEEP, 2015)
At the European level, there are several policies related to increasing the EE; the design, implementation, and monitoring of these policies and programs by the EC had technical and scientific advice. With the application of these policies in all the EU members, multiple benefits are expected in the future. They include the reduction of energy dependence by the region, among other significant social, economic, and environmental benefits. The policies include actions over buildings, household appliances, implementation of action plans, the rollout of smart meters for gas and electricity, and some other activities that involve producers and consumers. These measures are established in European legislation under the following directives: Energy Efficiency Directive, Energy Performance of Buildings Directive, Energy Labelling Directive, Ecodesign Directive. (European Commission, 2019c)
2.2.1. Energy Efficiency Directive 2012/27/EU
In 2007, the European Council adopted ambitious targets for 2020, which include, among others, by 2020 reaching 20% EE. Energy Efficiency Directive (EED) 2012/27/UE was approved in October 2012 and entered into force in December 2012 to help to aim the objective, based on the big potential of energy saving in areas such as energy performance of buildings, on energy services and cogeneration; it covers all sectors except transportation. The EED for the first time clearly defines and quantifies the EU EE targets. (European Commission, 2019a)
All the country members must incorporate the majority of the EED provisions into national law and prepare every three years a National Energy Efficiency Action Plan (NEEAP) with an annual report of achievements; the countries also will have an active monitoring by the European Commission.
The EED seeks to employ actions in several axes such as buildings, public purchased, energy audits and energy management systems, metering and billing information, promotion of use of high-efficiency cogeneration, heating and cooling, energy transformation, transmission and distribution. (European Parliament and Council of the European Union, 2013)
In 2016, driven in part by the Paris Agreement, the commission proposed a new target of 30% of EE by 2030. This is how the directive is continuously improving and updating the objectives, and the plans and strategies to reach them. To be aligned with the new targets in 2018, the directive was amended by the Directive 2018/2002/EU and by the Directive 2018/844/EU published in June of 2018, which contains plains for short, medium and long-term objectives facing to 2050. (European Parliament and Council of the European Union, 2018)
2.2.2. Energy Labeling Directive 2010/30/EU
The energy labeling began to be implemented in 1995 thought the first version of the Directive 92/74/EEC. Although only in some big household appliances like refrigerators, freezers, washing machines, and dishwashers, over the years, they have been expanding to other ones. In 2010, the previous directive was updated by the Directive 2010/30/EU, extending the scope to energy-related products that have a significant direct or indirect impact on energy consumption during use. Currently, the labels are mandatory and are applied in the majority of appliances, even in windows. (European Commission, 2019a) Years later, the European Commission identified the need to update the Directive 2010/30/EU, which is not in force since 2017 it was replaced by the Regulation 2017/1369, which maintains substantially the same scope, but clarify and update the contents.
The energy labeling indicates in a clearly and simply way the EE of each household appliance and some other relevant information of use like energy consumption, energy range, level of noise, among others. The more efficient, the lower consumption and therefore, the more savings in the electricity bill. Energy labeling enables customers to make informed choices based on the energy consumption of energy-related products. The format of the label has been changing over time. Initially, the scale went from A to G. However, new higher categories were created, since fortunately the appliances were increasingly efficient. To follow the advance of the efficiency technology, “+” symbols
were added to the highest categories and the lowers categories (F and G) disappeared. That action confused the users who were used to see category A as the best. Currently, in the market, the scale goes from A+++ to D, as shown in figure 1. In 2020, the current range will be adjusted and replaced by the original one (A-G). (European Commission, 2019a)
Figure 1. Energy label actually used - (European Commission, 2019a)
2.2.3. Energy Performance of Building Directive (EPBD) 2018/844/EU
The Energy Performance of Buildings Directive (EPBD) is a European legal instrument that works together with the EED to improve the energy performance of Europe's building stock. The directive was based in Kyoto agreement and in the directive 93/76/EEC of 13 September 1993 to limit carbon dioxide emissions by improving energy efficiency an informative but not mandatory directive.
The Member Countries uptake of energy performance requirements aims to gradually reduce energy demand and increase supply from renewable sources in the European building stock. The EPBD requires Member Countries to implement and to increase EE requirements in buildings, leading to achieve the European 2050 long-term energy strategy. However, the rate of building renovation in Europe is around 0,8% per year. (European Commission, 2019a)
The first version of the directive 2002/91/EC entered into force in January 2003 and obliges the Member States, in a period not exceeding three years, the transposition of the directive in their national legislation. In some countries, the EPBD transposition brought significant results mainly to those who did not have any regulation for EE over the construction sector before (García-Hooghuis & Neila, 2013). However, it did not mandate any specific level of requirements. (EuroACE, 2018). There are four keys aspects implemented by the first version of the EPBD.
1. All member states must establish a calculation methodology of the energy performance of buildings, taking into consideration the different factors related to energy consumption 2. Each country must implement regulations that minimize the energy performance requirements; the new regulation must be applied to all new buildings and large existing buildings when they are refurbished.
3. To build, sell, or rent a building, it must have an Energy Performance Certificate. 4. Regular boiler and heating system inspection and maintain of air conditioning systems. In order to strengthen the energy performance requirements, to clarify and streamline some provisions of the 2002/91/EC, in 2008 started the recast of the directive and it concluded in 2010 with the Directive 2010/31/EC, implementing a transposition deadline July 2012. (European Parliament and Council of the European Union, 2010). The recast requires Member Countries to strengthen the minimum requirements compared to the previous version, also imposed minimum standards for individual building elements. Some previous measures were reinforced like:
The extension to all buildings of the minimum requirements of energy performance levels when a major renovation takes place
Energy certifications for all properties constructed, sold or rented out are mandatory
The improvement of heating and cooling systems inspections and the generation of requirements reports.
The Member States are required to establish penalties for non-compliance. The recast also introduce new concepts like:
1. Nearly Zero Energy Building (NZEB), buildings with a very low, or zero energy consumption. The EPBD establishes that all public buildings constructed from 2018 must be NZEB and all buildings public and private from 2020. Member States must implement financials plans for the transition.
2. Cost optimal levels, and it defined it as “the energy performance level, which leads to the lowest cost during the estimated economic lifecycle” - from financial and macroeconomic perspectives.
In June 2018, The Official Journal of the EU published the Directive 2018/844/EU of the European Parliament and Council, amending the Directive 2010/31/EU on energy performance of buildings and the Directive 2012/27/EU on energy efficiency. EU countries have until 10 March 2020 to write the new and revised provisions into national law (European Parliament and Council of the European Union, 2018). The key features of the actual directive are:
Long-term renovation strategies must be applied by Member States to transform their present building stock to a highly EE and decarbonized one by 2050, with measurable progress indicators in 2030 and 2040. The reinforce of article 4 of EED.
Member Countries have the option to implement the Building Renovation Passports. The Building Renovation Passports is a document that shows a long-term renovation roadmap of one specific building; it is a powerful tool that provides more reliable, personalized, and independent information about the energy-saving potential in a building.
The introduction of the Smart Readiness Indicator will provide real information about the building systems, and it will help the building´s occupant to control the interior conditions and prepare the building to act as an integrated part of the global energy system.
A strengthening of the financing plans by the member states that contribute to the financing of energy renovation projects to improve the energy performance of buildings.
The heating, cooling, and ventilation systems inspections provisions have been extensively changed; keep the possibility of using alternative approaches.
Mandatory individual room temperature room control.
Mandatory installation of Building Automation & Control Systems by 2025 in large non-residential buildings. The interactions of the Building Automation & Control Systems with the building envelope and its operation have a significant effect on the energy use, on the well-being, on occupants comfort, and on the achievement of long-term carbonization objectives. (European Parliament and Council of the European Union, 2018)
2.2.4. Eco-design Directive 2009/125/EC
In 2005, Directive 2005/32/EC established a framework for the setting of community ecological design requirements for products that use energy. In order to clarify the contents, the directive was reformulated, and in 2009 Directive 2009/125/EC was approved. (European Parliament and Council of the European Union, 2009)
The Ecodesign Directive is a framework directive, which means that it does not directly establish minimum ecological requirements. The directive seeks to regulate the industry and the EU market, excluding products that increase energy consumption and it promotes the production of more efficient products to reduce energy and resource consumption. (European Commission, 2019a)
Many products are regulated across the EU such as household appliances, information and communication technologies or engineering. The ecological design directive works together with the Energy Labeling Directive standards, and they are complemented by other European standards to work in harmony.
2.2.5. EU Strategy on Heating and Cooling.
Heating and cooling are the activities that consume most of the final energy in all areas, including the residential. In Europe, fossil fuels are used to generate more than 80% of heating and cooling, while only less than 20% is generated from renewable energy. In order to explore the issues, challenges and solve this problem in February 2016 Europe launched its first heating and cooling strategy
Customers are the main actors in this strategy that promote the reduction of the demand, the use of modern technology and new solutions in order to change to a sustainable smart heating and cooling system, improving the individual well-being. This strategy also focuses on the modernization of buildings helping to reduce the energy leakage, renovation in the heating and cooling systems, the continuous use of renewable sources, thermal storage, and use of waste heat. (European Commission, 2019a)
Occupant Energy Behavior
Human activities are ruled by natural and social process. According to some authors, the people’s energy behavior includes several areas such as socio-demographic factors, family lifestyle, energy prices, cost-benefit tradeoffs, effectiveness and responsibility, feedback information, and home characteristics. Four types of factors can influence the behavior as physiological, individual, environmental, and spatial adjustments; is a complex issue that should be studied under multiple disciplinary perspectives. (Van Raaij & Verhallen, 1983; Ectors, et al., 2017)
Human behavior is unpredictable; to change it is a challenge, even with favorable conditions are in place. Some facts as the lack of standard decisions, programmed mental shortcuts, and the wrong idea that people always make rational and conscientious decisions based on the cost-benefit of the options available to them, are some of the characteristics that make behavioral science a complex science. It needs other social sciences to be deeply understood. (UNEP, 2017a)
Individual behavior plays an essential role in resources consumption. From daily actions to habits and lifestyles, in this sense, it is critical to understand the people’s behavior in order to change it. (UNEP, 2017a)
An exciting concept that can help to understand better human behavior is the intention-action gap. It is defined as the disconnection between intention and intention-actions. It means that good intentions are not enough if there are not reflected in real actions. People, in general, are concerned about the environment but taking default decisions or the influence of the decisions of the people around them, especially in times of uncertainty, leads them to undesirable unsustainable behavior. (UNEP, 2017a)
Another phenomenon that acts on human behavior achieving unwanted results is called "annoying factor." They are small tasks that are or seem complicated and therefore, are not made by consumers despite the intention to perform it. Among them are the programming of a heating device or the calculation of the electricity bill, even with the details in the invoice this task becomes somewhat difficult if the consumer has no idea what a kWh is. The simplicity of these tasks can represent significant effects on the energetic consumption. (Behavioural Insights, 2015) (UNEP, 2017a)
In 1983 (Van Raaij & Verhallen, 1983) decided to divide the energy-related behavior in three parts: purchase, usage, and maintenance related behavior. The purchase behavior is related to consumer decisions at the time of buying or acquiring a device that directly or indirectly affects the energy consumption. The energy efficiency labels have a significant impact on this behavior. They allow buyers to be more informed before making their choice in terms of energy consumption and efficiency. A highly efficient technology device can reduce its payback time significantly. (IEA, 2010). This could not mean a solution if the decisions of the people are based on a great interest to the immediate costs and benefits (UNEP, 2017a).
The usage-energy behavior has a high saving potential but at the same time is one of the most difficult to be change because it is related to the habits lifestyle and comfort of the consumers. Objectively means time, frequency, periodicity, and intensity of appliances use, lights, and another's energy-consuming devices. The maintenance-related behavior is associated with small repairs of electronic devices, some house improvements principally in the insulation system, the proper maintenance of applies, and regular inspections of the energy distribution system. (Van Raaij & Verhallen, 1983)
In order to predict specific actions and quantify the amount of energy that will be saved in the future, it is necessary to create behavioral models. The models are complex, and many variables are presented in order to increase the accuracy of the results. Good quality results can be useful for the proper design, operation and optimization of the buildings, the understanding and possible change of behaviors and the creation of specific energy policies. (Yan, et al., 2017)
Behavioral models feed on user data to determine behaviors. That is why data collection is fundamental. A quality database can create models that allow the understanding of the
people's behaviors inside the buildings. It is necessary to analyze the presence, moving, and the occupant-building interaction. (Yan, et al., 2017)
Already exist two ways of collect data, survey and the use of sensors to monitoring. Surveys do not need a significant investment and present results of a large number of people in a short time, but sometimes the interviewees do not respond according to reality. Sensing requires a significant investment, maintenance, and a long period to get good results. A person's behavior can change only with the simple fact of knowing that he or she is being monitored. (Yan, et al., 2017)
A study made by (Faitão Balvedi, et al., 2018), concludes that it is possible to reduce the uncertainness presented by all the monitoring methods using a mix mode approach. Moreover, the results will be more realistic. Most of the behavior models used a binary state, it means open-close, on-off, for windows and blind control. In these cases, it is not possible to know all the new information that a partially open state can give in terms of energy saving. The influence that exists on building energy consumption was shown by the application of occupant behavior models.
Buildings
Many different aspects such as economic, engineering, behavioral and health play a key role in the building sector making a challenging sector but at the same time, the most crucial sector concerning EE policies due to its high potential in terms of energy reduction and efficiency. (European Commission, 2019a)
Given the long useful lifetime of buildings (50 to more than 100 years) and the high number of the existing buildings, it is clear that the most significant potential for improving the energy performance of buildings in the short and medium-term is over the existing building stock (Balaras, et al., 2005)
Home characteristics can represent positive and negative effects on energy conservation. In Europe in 2012, around three-quarters of a total of 25 billons m2 were residential buildings area, and most of these are SFH (Eurostat, 2019). Besides, in Europe, around 35% of all buildings are over 50 years old, and 75% of them are considering energy inefficient with a deficient energy performance (category D and E). The renovation of buildings represents significant contributions to the efficient use of energy. Buildings with a high performance
can improve the life quality of the occupants, increasing the comfort level and an adequate indoor climate. (European Commission, 2019a)
Warmer countries generally have lower space heating intensities, so less energy is required on average to keep the temperature inside residential building at a comfort level (IEA, 2019b)
However, SFH consume more energy on average than multi-family houses. It can be explained, in part, by the lower exposure to outside temperature, as well as by the fact that they are surrounded by other buildings and have fewer windows. (Gangolells, et al., 2016) The age of the buildings is an important factor that governs energy consumption. Old buildings consumes more energy due to energy losses (Instituto Nacional de Estatística, I.P, 2011; Gangolells, et al., 2016; Pezzutto, et al., 2018). In Europe buildings constructed before the 1970s are in average 60% less energy efficient than new buildings (Eurostat, 2019).
Two-thirds of the EU's buildings were built when EE requirements were limited or non-existent; most of these will still be standing in 2050. Around 70% of the EU population lives in privately-owned residential buildings. Owners often do not undertake cost-efficient renovations because they lack awareness of the benefits, lack advice on the technical possibilities, and have financing constraints. (European Commission, 2019a).
The International Energy Agency (IEA, 2019b) has indicated that 76% of the funds to achieve the objectives of the Paris Agreement must be allocated to energy efficiency. On the other hand, the (Buildings Performance Institute Europe, 2019) has found that just 3% of buildings in the EU were assessed as highly energy efficient in 2017, leaving the other 97% in need of energy renovation before 2050.
Related Works
In the last years, several studies have been carried out on energy consumption and efficiency in buildings. Some of them have focus on a specific building sector or use the comparison as an analysis tool.
The countries or regions with the highest energy building consumption in the world were compared in a study carried out in 2014 by Xia et al. In that study, the annual electricity consumption data of four office buildings with different characteristics was analyzed on
annual, monthly, weekly, and daily. Two of those buildings located in the United States of America and two remaining in China. The electrical energy data had to be first normalized to be able to analyze them on the same scale and system. The study highlights the impact that improving the building energy monitoring would have on the quality of the building data that would contribute to research and building EE policy-making. (Xia, et al., 2014) Another study in 2015 compared the building energy consumption in a world scale level using information of international reports and research from the United States of America, the European Union, Brazil, Russia, India and China. The mentioned countries represent the leading global energy consumers. The study concludes that countries where the building stock is growing need to apply energy consumption regulation measures mainly in new buildings. While the measures adopted in the rest of the countries will not be sufficient to guarantee significant reductions in energy consumption. (Berardi, 2015) Other studies of the same type have also been carried out at European level taking into account the similarities and differences at the political, climatic, energy level that the region presents.
A study carried out in 2005 analyzes the energy for space and water heating consumed by residential buildings in five European countries (Denmark, France, Greece, Poland, and Switzerland). The information on consumption was taken from energy audits; the analysis takes into account the building thermal insulation, the characteristic of the Heating, Ventilation and Air Conditioning (HVAC) system, and the local regulations of each country. As the methodology of the analysis, the buildings were divided by periods and the energy data were standardized, several heating systems were also analyzed. There were apparent differences in consumption related to the type of climate in the chosen countries and comparison with the average European consumption. One of the most important conclusions is that district heating and central space heating with sanitary hot water production are more energy-efficient systems for satisfying the heating demand of buildings. On the other hand, individual heating systems are more energy consuming. (Balaras, et al., 2005)
Another study carried out at European level is based on a contemporary office building. Through simulations, it seeks to find how the variation of parameters such as window to wall ratio, thermal mass and internal loads affect energy performance in order to find the optimal office design for each case. The simulation was carried out in four European cities
(London, Munich, Nicosia and Thessaloniki) with specific climatic characteristic, having as advantage common regulations for all countries in the study given by the EC. It was easy to know the minimum required thermal insulation characteristics in each country. (Leonidaki, 2012)
In conclusion, each parameter affects the consumption differently, depending on the climate. However, for all the cases, a low window-wall ratio reduces the consumption and changes of internal loads do not represent significant variations in energy consumption. It is interesting to note that by applying improvements for space heating in the cities located in the north, more energy savings are obtained than in the south cities. Space heating energy represents almost all the final energy consumption in cold cities, while space heating and cooling energy in southern cities is representative. (Leonidaki, 2012)
Energy comparisons have also been carried out between two countries. One study shows an economical and energy comparison analysis of how borehole heat exchangers are used, considering heating and cooling working modes, in a SFH of two cities (Cracow and Thessaloniki). The difference in the average temperatures of the selected cities is evident, which made cooling and mainly heating loads different as well. In Cracow heating during the winter months is important, but in Thessaloniki, heating and cooling are both necessary. (Śliwa & Sakellariou, 2010)
Another study compares the energy demand for cooling and water and space heating in the building stock between Austria and Italy. For a better comparison, the total building stock was divided by periods and sectors, and the energy was compared in terms of primary energy. (Pezzutto, et al., 2018)
An analysis conducted in a detached SHF in the center of Italy compares three different calculation methods to obtaining the building energy performance and understanding the typical Mediterranean weather, the similarities in the architectural typology of this region and the limitation of it in terms of energy efficiency. The thermal transmittance and HVAC of building has been estimated with analogy with other similar buildings of the same period and the region “standard”. (Tronchin & Fabbri, 2008)
The first method analyzed was the comparison with the electricity bills, the second method consisted in a simulation using a software, and the third one using the in force Italian method of calculation. At the end, it is showed that the use of the different methods has
variations in the results; nations must produce a unique method of calculation. (Tronchin & Fabbri, 2008)
Several other studies have focused on the characteristics of construction and energy consumption in a local context within a country. Some of them have used real data to compare it with national averages, and others have relied on averages and statistics to obtain real characteristics. In some cases, assumptions are the only way due to the lack of information. As in the case of a study conducted on the energy performance of the Greek residential buildings. (Balaras, et al., 2007)
The work described in this dissertation was based partially on the studies mentioned above, with a different and particular focus to fulfill the objectives established in section 1. The differences and specifications are explained in detail in the next section.
Methodological Proposal
In order to meet the stated objective, a comparison of the energy consumption of SFH in different locations will be carried out. An attempt will be made to represent the most common characteristics of both buildings and occupants, looking for the most typical and representative ones.
There will also be an analysis of the policies and the occupant’s behaviors that influence the energy consumption to understand how they affect the final energy consumption. Data and statistical information provided by census, surveys and from the Eurostat platform will be used as a base for the analysis.
A simulation software will be used as a tool to simulate a representative SFH from each region. Simulation software allows the prediction of the effect of technical, physical, and behavioral changes in the building and its systems on the final energy consumption. Models will be designed and simulated to represent them. Information from the in force national regulations will be used.
The energy use by the systems to maintain the temperature of a building and to provide hot water depends on factors such as the variation in climate conditions, the thermal comfort of the occupants, the efficiency of the systems, and their use. (Gangolells, et al., 2016)
In the European residential sector, the most significant energy consumption comes from the heating, ventilation and air conditioning activities of the inhabited spaces and water heating for domestic use. Therefore, the analysis and comparison of the energy consumed by an SFH will be carried out for heating and cooling of spaces, as well as the water heating. These three fields because they are considered the most representative and important for the housing habitability.
Results will be obtained with the application of different conditions that will be analyzed and compared, looking for differences and similarities between energy consumption of different places with particular characteristics. The average data of consumptions available for each region also will be compared with the results obtained.
Use of Building simulation software
Besides of the average consumption information that can be obtained from the statistical databases, a simulation of an SFH model will be carried out with the own and representative characteristics of different locations to obtain an energetic consumption that allows comparison with the statistical information and between them. In the buildings models will be applied different profiles of energy consumption; it will represent the people behavior. Some other characteristics will keep fixed for the entire simulations model during the entire analysis.
3.1.1. Software
The software used for the simulation is DesignBuilder Software Ltd., the software allows an easy-to-use advanced simulation that helps evaluate the energy and environmental performance of new and existing buildings.
DesignBuilder Software has nine attached analysis modules, each of which offers a specific type of task or analysis, which includes energy and comfort, HVAC, natural lighting, cost, design optimization and reports that meet various national construction standards and certification, providing a complete integration performance analysis, ideal to meet the particular requirements of this study. (DesignBuilder Software Ltd, 2019)
DesignBuilder Software use EnergyPlus as the main energy and environmental analysis in buildings tool and calculation mechanism. EnergyPlus is a simulator software that provides the power and thermal simulation capability necessary to maintain the thermal control set points, the conditions throughout the HVAC system, the coil loads, and the energy consumption of the plant's primary equipment. EnergyPlus simulated the energy of buildings used in heating, cooling, ventilation, lighting and plug and process loads and the use of water in buildings. (EnergyPlus, 2019)
3.1.2. Weather Data
Climate information for simulations was obtained from the EnergyPlus climate database. The EnergyPlus database contains the weather information for the selected locations; the weather data is fully compatible with the selected software and is hourly weather format. The sources of the weather data for Spain is the Spanish Weather for Energy Calculations, for some places in Portugal is provided by the National Institute of Engineering,
Technology and Innovation, for the rest of the locations the source is the International Weather for Energy Calculations (IWEC). (EnergyPlus, 2019)
The bases of the IWEC files provide the information obtained from monitoring up to 18 years for most stations. The meteorological data also have the estimated solar radiation information every hour from the earth-sun geometry and hourly meteorological elements, in particular the amount of clouds. (EnergyPlus, 2019) The typical climate year used is the IWEC form, the result of the American Society of Heating, Refrigerating and Air Conditioned (ASHRAE) Research Project.
Objectives for the selected countries
Each country has its own political, cultural social and geographical characteristics. Some characteristics vary even within the country such as the weather.
The objectives for the selected countries will be compare them, to know and analyze the typical characteristics of the buildings, as well as area, construction period, characteristics of the envelopment and others that influence energy consumption. It is important to analyze the local policies and regulations about the constructions and the use of energy. The characteristics of the HVAC systems and the house occupant energy behavior are also important and influential factors on the energy consumption.