Crashworthiness Optimization of Nested and Concentric Circular Tubes
Using Response Surface Methodology and Genetic Algorithm
Abstract
In this study crashworthiness optimization of nested and concentric circular tubes under impact loading is performed by coupling Finite Element model, Response Surface Models and Genetic Algorithm. Specific Energy Absorption SEA and Crash Force Efficiency CFE are used in crashworthiness optimization since these criteria are important indicators for evaluating crashworthiness performance. Length and thickness of three concentric tubes as well as radius of one tube are adopted as design variables which are effective parameters on SEA and CFE. To reduce the computational cost of the optimization procedure, simple and computationally cheap Response Surface Models are created to replace finite element analyses in further calculations. The Non‐dominated Sorting Genetic Algorithm –II NSGAII is applied to obtain the Pareto optimal solutions. Optimization results are presented for different selected designs that indicate relative importance of multi‐objective functions. Results show that the total weight of the vehicles can be reduced by using nested tubes comparing to single tubes with identical masses. These designs can be adopted for use in practice.
Keywords
Nested tube, response surface method, genetic algorithm, multi‐objective optimization, crashworthiness, impact loading.
1 INTRODUCTION
Thin walled tubular structures are extensively used in automotive, aerospace and military industries due to their energy absorption capacity for the protection of the passengers, drivers and electronic devices of vehicle. Converting some amount of kinetic energy during collision to the plastic energy prevents passengers and devices from squeezing. Besides, inertial loads, which occur at the beginning of the collision, can be harmful for passengers during dynamic crash.
Axial crushing of thin walled circular tubes made of mild steel was introduced by Alexander 1960 as an excellent mechanism for energy absorption. Abramowicz and Jones 1984a, 1984b, and 1986 investigated the circular and square steel tubes under static and dynamic loading. These tubes absorb and convert large amounts of kinetic energy into plastic strain energy under severe loading conditions. In relation with continuous interest to energy absorption capability of thin walled tubes, Jones 1989, 1996, and 2011 reviewed elasto‐plastic behavior of structures under impact conditions.
Kim 2002 firstly studied axial crushing behavior of multi‐cell tubes. Zhang et al 2006 showed that the energy absorption of a single‐cell tube can be increased by 50% when the section is divided into 3 3 cells and they investigated effect of different parts on the cross section. Najafi and Rais‐Rohani 2011 made comparison between analytical and numerical results of axially loaded multi‐cell tubes.
Fatih Usta a*
Zana Eren a
Hasan Kurtaran b
Halit S. Türkmen a
Zafer Kazancı c
Zahit Mecitoglu a
a Faculty of Aeronautics and Astronautics, Istanbul Technical University, Istanbul, Turkey. E‐mail: [email protected], [email protected], [email protected], [email protected]
b Department of Mechanical Engineering, Adana Science and Technology University, Adana, Turkey. E‐mail:
c School of Mechanical & Aerospace Engineering, Queen’s University Belfast, Belfast, United Kingdom. E‐mail: [email protected]
*Corresponding author
https://doi.org/10.1590/1679-78254385
Optimization procedure was successfully applied to increase the efficiency of many types of crush structures such as multi‐cell tubes Kurtaran et al. 2002 . For example, Hou et al. 2008 carried out multi‐objective optimization of cell tubes by maximizing Specific Energy Absorption SEA and minimizing Peak Crush Force PCF values. They compared the result of 1‐cell, 2‐cell, 3‐cell and 4‐cell tubes with pareto curve.
Yin et al. 2014a and 2014b investigated foam integration to multi‐cell tube system. In different studies researchers suggested analytical solutions for mean crushing force curves of multi‐cell tubes Zhang et al. 2006 . Qiu et al. 2016 derived analytical solution for multi‐cell tubes using Simplified Super Folding Element theory and optimized the cross‐sectional dimensions of the hexagonal tubes using multi‐objective optimization procedure.
Superior energy absorption capability of multi‐cell tubes including nested multi‐tubular structures are expressed in the literature. Usta et al. 2015 and Usta and Türkmen 2017 conducted parametric analyses to investigate the effects of the number of cross section and the number of nested tubes with gradually changing lengths on axial crushing performance of thin walled structures. An experimental work including quasi‐static crush tests of these systems has been conducted by Nia and Chahardoli 2016a . Later on, they have applied optimization procedure to nested tubes through response surface approximation Nia and Chahardoli 2016b .
From the literature, it is seen that very limited study is available for crash optimization of nested tubes. Olabi et al. 2008 investigated the effects of the lateral impact on circular nested tube systems and show that optimized nested tubes gave desirable force deflection response compared to standard tube systems. Nia and Chahardoli 2016b optimized circular nested tube systems with different height and thickness subjected to quasi static crushing. In this study, multi objective optimization procedure is applied to optimize tri‐tubular nested and concentric circular tube system by coupling Genetic Algorithm, Response Surface method and Finite Element FE model. Specific energy absorption SEA and Crush Force Efficiency CFE criteria are used in representing multi‐ objective objective functions and Peak Crush Force PCF in constraint function. Response surface models are developed for CFE and SEA of the nested tube structures. By using response surface models, nested tube structure is optimized for optimum crashworthiness performance. This study contributes to the literature an optimum design cluster of nested and concentric tubes regarding to SEA and CFE under dynamic impact loading.
2. FINITE ELEMENT MODEL
In this study, finite element model of nested and concentric circular tri‐tubular system is used in obtaining SEA and CFE responses required in optimization. Nested and concentric circular tri‐tubular system employed is shown in Figure 1. L1, L2 and L3 indicate length of tubes, t1, t2 and t3 denote thickness of tubes and r2 indicates radius of
middle tube.
Nested and concentric circular tri‐tubular system is crushed in the axial direction by a 1132 kg rigid mass with a 4.22 m/s initial velocity. The bottom line nodes of all tri‐tubes are clamped, while top nodes of the three tubes are constrained except axial direction due to provide deformation behavior. Tubes are modeled by using Belytschko‐ Lin‐Tsay‐4‐node thin shell elements with three integration points through the thickness and one integration point in the element plane. The element size of 2 x 2 mm is found to be sufficient and suitable to simulate the crushing deformation of tubes 29160 elements, 29491 nodes . Automatic contact algorithms are activated to prevent penetration of tube surfaces after deformation. The static and dynamic friction coefficients are chosen as 0.2 and 0.3 respectively Kazancı and Bathe 2012 , Fang et al. 2014 . FE analysis is conducted using commercial code LS‐DYNA Hallquist 2007 .
In FE analysis, tube system is considered made of Aluminum 6063. Following material properties for Aluminum 6063 is used in this study. Density is ρ 2700 kg/m3, Young’s modulus is E 68.2 GPa, initial yield
Figure 1: Concentric circular tri‐tubular structure.
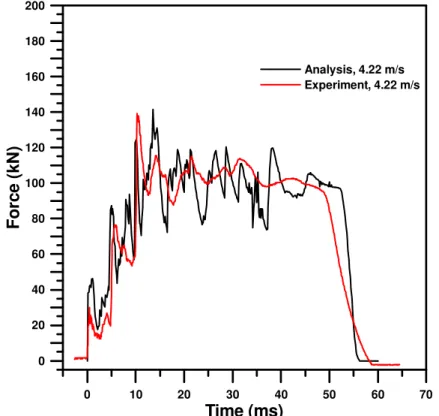
In order to validate the FE model, FE analysis result of the tri‐tubular circular tubes under axial dynamical loading is compared with experimental results as shown in Figure 2. Experiment is conducted by using drop‐tower test facility of the Scientific and Technological Research Council of Turkey TUBITAK . 1132 kg drop weight is released from a height that provides approximately 10 kJ. From comparison, it is seen that FE response is very close to the experimental result and therefore it can be concluded that FE model can be used in producing crush responses used in optimization.
0 10 20 30 40 50 60 70
Time (ms) 0
20 40 60 80 100 120 140 160 180 200
Fo
rce (
kN
)
Analysis, 4.22 m/s Experiment, 4.22 m/s
3. OPTIMIZATION PROCEDURE
In order to evaluate the crashworthiness of the thin‐walled structures, it is essential to define crashworthiness indicators. Energy Absorption EA , Specific Energy Absorption SEA , Mean Crushing Force MCF and Crash Force Efficiency CFE are usually used as the important indicators for evaluating crashworthiness performance Guler et al. 2010 . Energy absorption of a structure subjected to the axial loading can be expressed as:
0
( )
EA
P s ds
1where δ is the axial crushing distance and P s denotes the axial crushing force. SEA is calculated as energy absorption divided by mass as below
EA
SEA
m
2max( ( ))
PCF
P s
3MCF is calculated as absorbed energy divided by axial crushing distance as
δ
0 m
P s ds)
EA
P
δ
δ
4CFE is calculated as mean crushing force Pm divided by peak crush force PCF . CFE values close to one are
desired for efficient designs.
m
P
CFE
PCF
5Details of optimization steps are explained in the following sections. 3.1 Formulation of optimization problem
In this study, optimization of tri‐tubular nested and concentric circular tube system is formulated as multi‐ objective constrained optimization problem. CFE and SEA criteria are used in expressing objective functions expressed as f1 and f2 successively. For optimum crashworthiness design, objective functions are desired to be
maximized.
In multi‐objective optimization procedure adopted in this study, multi objective particle swarm optimization MOPSO method is used. Considering multi‐objective and constraint functions, optimization problem is formulated as below:
Maximize
F
(f L , L , L , t , t , t , r , f
1
1 2 3 1 2 3 2
2
L , L , L , t , t , t , r )
1 2 3 1 2 3 2
3.2 Response surface models for optimization criteria
In order to reduce the computational cost of the optimization problem with many design variables, simple approximate models are used to replace the costly original objective and constraint functions, which are calculated using expensive FE analysis. Simple approximate models are often referred to as Response Surface RS models and are obtained using Response Surface Method RSM . In this study, RS models are used for SEA and CFE criteria during optimization. RSM was originally developed for the model fitting of physical experiments by Box and Draper
1987 and later adopted in other fields.
In RSM, polynomial model is selected first to approximate the actual function. Often quadratic polynomial models are selected. Quadratic models can be written as
0
1 1 1
n n n
i i ij i j
i i j
f
c
c x
c x x
7where xi are variables that the function depends on. c0, ci and cij are tuning parameters and n is the number of
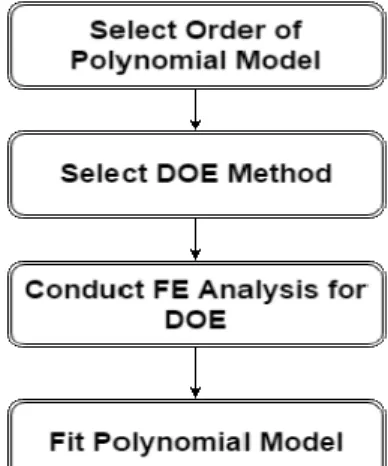
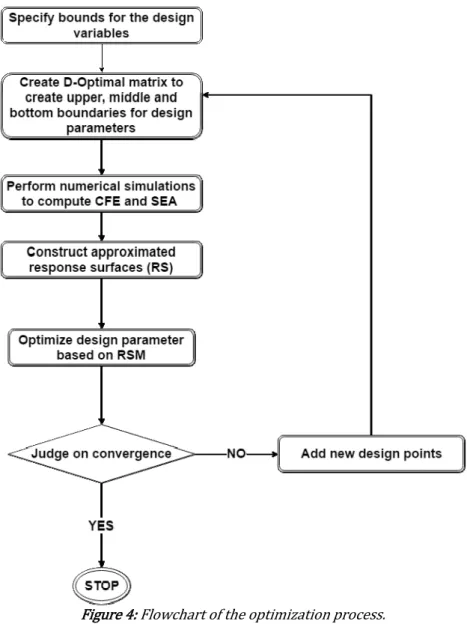
variables. Then, Design of Experiment DOE method is selected according to the order of polynomial function and the number of design variables. Full Factorial DOE is a good choice for few design variables. For large number of design variables, often a subset of Full Factorial DOE is selected using a suitable selection criterion such as D‐ optimality selection criterion. Then, FE analyses corresponding to DOE table are conducted to calculate function values. Finally, polynomial model is fitted to the created data set corresponding to DOE table using least‐squares method. Steps of RSM is summarized in Figure 3. Flowchart of optimization procedure adopted in this study is shown in Figure 4.
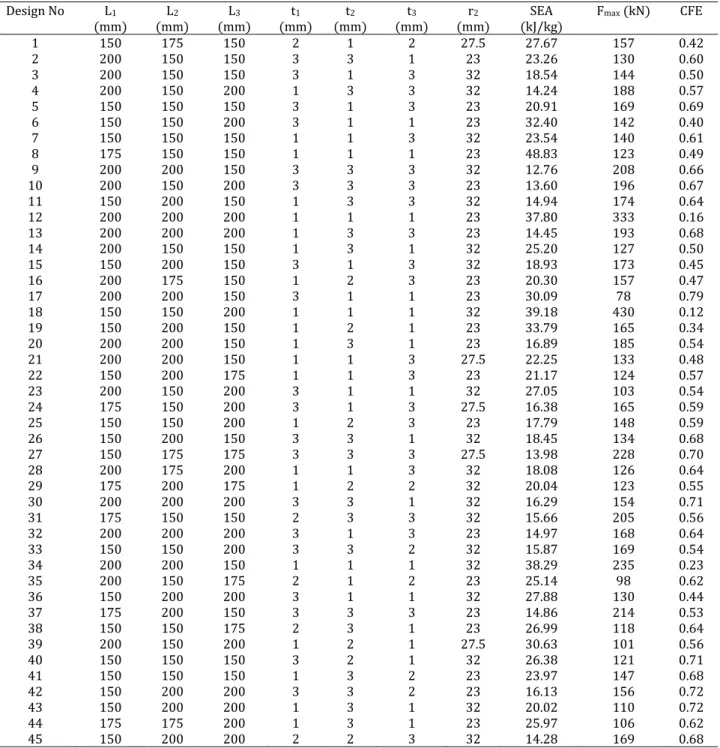
In this study a subset of three‐level Full Factorial DOE is selected using D‐optimality criterion. Subset includes 45 experiments, which is sufficient enough to fit a quadratic function for 7 variables. To implement RSM, a MATLAB code is written.
Figure 4: Flowchart of the optimization process.
Ranges of design variables used in creating DOE table are shown in Table 1. Resulting DOE table and corresponding function values for SEA and CFE criteria are given in Table 2.
Table 1: Ranges of design variables used in DOE table.
Lower mm Upper mm
Parameter 1 Length of the innermost tube, L1 150 200
Parameter 2 Length of middle tube, L2 150 200
Parameter 3 Length of the outmost tube, L3 150 200
Parameter 4 Thickness of the innermost tube, t1 1 3
Parameter 5 Thickness of the middle tube, t2 1 3
Parameter 6 Thickness of the outmost tube, t3 1 3
Parameter 7 Radius of middle tube, r2 23 32
Table 2: DOE table used in creating RS models.
Design No L1
mm mm L2 mm L3 mmt1 mmt2 mmt3 mmr2 kJ/kg SEA Fmax kN CFE
1 150 175 150 2 1 2 27.5 27.67 157 0.42
2 200 150 150 3 3 1 23 23.26 130 0.60
3 200 150 150 3 1 3 32 18.54 144 0.50
4 200 150 200 1 3 3 32 14.24 188 0.57
5 150 150 150 3 1 3 23 20.91 169 0.69
6 150 150 200 3 1 1 23 32.40 142 0.40
7 150 150 150 1 1 3 32 23.54 140 0.61
8 175 150 150 1 1 1 23 48.83 123 0.49
9 200 200 150 3 3 3 32 12.76 208 0.66
10 200 150 200 3 3 3 23 13.60 196 0.67
11 150 200 150 1 3 3 32 14.94 174 0.64
12 200 200 200 1 1 1 23 37.80 333 0.16
13 200 200 200 1 3 3 23 14.45 193 0.68
14 200 150 150 1 3 1 32 25.20 127 0.50
15 150 200 150 3 1 3 32 18.93 173 0.45
16 200 175 150 1 2 3 23 20.30 157 0.47
17 200 200 150 3 1 1 23 30.09 78 0.79
18 150 150 200 1 1 1 32 39.18 430 0.12
19 150 200 150 1 2 1 23 33.79 165 0.34
20 200 200 150 1 3 1 23 16.89 185 0.54
21 200 200 150 1 1 3 27.5 22.25 133 0.48
22 150 200 175 1 1 3 23 21.17 124 0.57
23 200 150 200 3 1 1 32 27.05 103 0.54
24 175 150 200 3 1 3 27.5 16.38 165 0.59
25 150 150 200 1 2 3 23 17.79 148 0.59
26 150 200 150 3 3 1 32 18.45 134 0.68
27 150 175 175 3 3 3 27.5 13.98 228 0.70
28 200 175 200 1 1 3 32 18.08 126 0.64
29 175 200 175 1 2 2 32 20.04 123 0.55
30 200 200 200 3 3 1 32 16.29 154 0.71
31 175 150 150 2 3 3 32 15.66 205 0.56
32 200 200 200 3 1 3 23 14.97 168 0.64
33 150 150 200 3 3 2 32 15.87 169 0.54
34 200 200 150 1 1 1 32 38.29 235 0.23
35 200 150 175 2 1 2 23 25.14 98 0.62
36 150 200 200 3 1 1 32 27.88 130 0.44
37 175 200 150 3 3 3 23 14.86 214 0.53
38 150 150 175 2 3 1 23 26.99 118 0.64
39 200 150 200 1 2 1 27.5 30.63 101 0.56
40 150 150 150 3 2 1 32 26.38 121 0.71
41 150 150 150 1 3 2 23 23.97 147 0.68
42 150 200 200 3 3 2 23 16.13 156 0.72
43 150 200 200 1 3 1 32 20.02 110 0.72
44 175 175 200 1 3 1 23 25.97 106 0.62
45 150 200 200 2 2 3 32 14.28 169 0.68
1 1 2 3
1 2 3 2
2
1 1 2 1 3 1 1
1 2 1 3 1
231.889010 0.571470*
0.476764*
1.168656*
15.072271*
17.153109*
32.213825*
1.857914*
0.002040*
0.000330*
*
0.000389*
*
0.001148*
*
0.013376*
*
0.019219*
*
0.003070*
f
L
L
L
t
t
t
r
L
L
L
L
L
L
t
L
t
L
t
L
22
2 2 3 2 1
2
2 2 2 3 2 2 3
3 1 3 2 2 3
2
3 2 1 1 2
*
0.000325*
0.001060*
*
0.014181*
*
0.020717
*
*
0.037345*
*
0.004300*
*
0.002253*
0.004103*
*
0.037217 *
*
0.002252*
*
0.000068*
*
0.887080*
1.346279* *
1.01434
r
L
L
L
L
t
L
t
L
t
L
r
L
L
t
L
t
L
t
L
r
t
t
t
2
1 3 1 2 2 2 3
2 2
2 2 3 3 2 2
7
* *
0.049750* *
0.862942*
2.462641* *
0.032040* *
1.918523*
0.082639* *
0.000140*
t
t
t
r
t
t
t
t
r
t
t
r
r
8
2 1 2 3 1
2
2 3 2 1 1 2
1 3 1 1 1 2 1 3
1 2
0.965422 0.006601*
0.020759*
0.021284*
0.091727*
0.011542*
0.145493*
0.076866*
0.000025*
0.000016* *
0.000022* *
0.000791* *
0.001449* *
0.000548* *
0.000063* *
f
L
L
L
t
t
t
r
L
L L
L L
L t
L t
L t
L r
22 2 3 2 1
2
2 2 2 3 2 2 3
3 1 3 2 3 3 3 2
2
1 1 2 1
0.000000*
0.000047* *
0.000999* *
0.001299* *
0.000335* *
0.000161* *
0.000116*
0.000293* *
0.001403* *
0.001347* *
0.000088* *
0.034847*
0.040104* *
0.049482*
L
L L
L t
L t
L t
L r
L
L t
L t
L t
L r
t
t t
t
23 1 2 2
2 2
2 3 2 2 3 3 2 2
*
0.002872* *
0.017323
0.029434* *
0.002706* *
0.026728*
0.001158* *
0.002054*
t
t r
t
t t
t r
t
t r
r
9
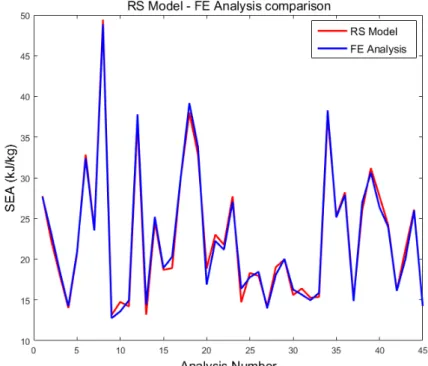
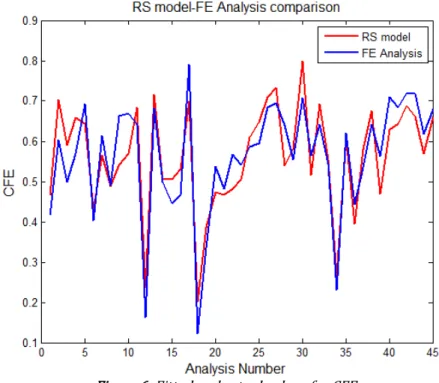
Fitted values and actual values FE results for SEA and CFE are compared in Figures 5‐6. From Figures 5‐6 it is seen that good correlation exists between RS model and FE results. Therefore, RS models can be used in the optimization for concentric circular tri‐tubular system.
Figure 6: Fitted and actual values for CFE.
3.3. Solution of optimization problem
Optimization problem formulated in Equations 6 and 7 is solved using Genetic Algorithm GA .
GA is coupled with the RS models to yield a global optimum as shown in Figure 7. The GA solves the optimization problem by simulating the biological evolution process based on Darwin’s theory of survival of the fittest. First, a set of potential solutions referred to as population or chromosomes is selected. New and improved solutions are then generated using the previous solutions based on crossover and mutation technique. This process repeats until optimum values are reached. The critical parameters in GAs are the size of the population, cross over rate, mutation rate and number of generations. Detailed information about GA can be found in Ref. Goldberg
1989 .
Figure 7: Coupling of FE Analyses, RS models and GA for crashworthiness optimization.
The Non‐dominated Sorting Genetic Algorithm –II NSGAII is applied to obtain the Pareto optimal solutions Deb 2002 . Table 3 indicates the values of NSGAII parameters for considered problem which provides results with good repeatability.
Table 3: Parameter specifications for the NSGA‐II.
Population size 200
Repository size 25
Number of generation 1000
Crossover probability %80
Mutation probability %20
3.4. Optimization results
Figure 8: Pareto frontier for nested and concentric circular tubes.
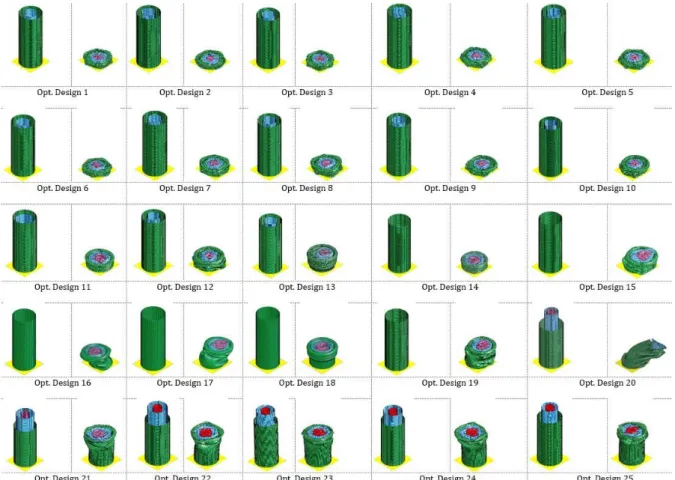
Solution of optimization problem expressed in Equations 6 and 7 is conducted with GA. Optimum values of design variables found are shown in Table 4. In Table 4, SEA and CFE values at optimum are compared for RS model and FE analysis. Undeformed and deformed shapes of optimum tube structures under impact for different SEA and CFE values, are demonstrated in Figure 9.
Table 4: Optimum values of design variables for concentric circular tubes. Desi gn no L1 m m L2 m m L3 m m t1 m m t2 m m t3 m m r2 m m SEA Optimizatio n kJ/kg SEA FE Analy. kJ/kg CFE Optimizati on CFE FE Analy.
1 150.00 200.00 200.00 1.00 1.00 1.00 23.00 39.83 39.70 0.09 0.16
2 151.25 200.00 198.24 1.00 1.03 1.05 23.00 38.91 38.50 0.12 0.18
3 150.00 200.00 200.00 1.00 1.00 1.30 23.00 36.09 34.20 0.13 0.25
4 150.00 200.00 199.55 1.00 1.00 1.39 23.00 35.05 32.93 0.14 0.28
5 150.00 198.49 200.00 1.14 1.00 1.41 23.00 34.07 32.08 0.16 0.29
6 150.72 197.19 200.00 1.00 1.00 1.62 23.00 32.61 29.87 0.18 0.33
7 150.32 197.10 199.53 1.30 1.03 1.49 23.00 32.09 30.25 0.19 0.41
8 150.00 200.00 200.00 1.26 1.00 1.75 23.00 29.75 27.55 0.20 0.38
9 150.00 198.75 198.45 1.39 1.00 1.76 23.23 28.89 27.19 0.23 0.45
10 152.11 199.00 198.68 1.41 1.06 1.87 23.23 27.36 25.85 0.27 0.43
11 150.00 188.51 200.00 1.26 1.00 1.92 32.00 25.29 24.33 0.29 0.53
12 150.00 200.00 199.50 1.38 1.05 2.25 23.08 24.37 22.79 0.30 0.73
13 150.00 198.10 200.00 1.61 1.00 2.29 23.00 23.42 22.25 0.31 0.70
14 150.91 151.84 200.00 2.21 1.00 1.89 32.00 21.66 23.62 0.32 0.50
15 150.00 150.00 200.00 2.25 1.00 1.98 32.00 20.61 22.97 0.33 0.72
16 150.00 151.25 199.83 2.56 1.00 1.99 32.00 19.54 22.25 0.35 0.62
17 152.56 151.37 199.85 2.31 1.00 2.30 31.94 17.97 20.66 0.37 0.72
18 150.19 150.16 200.00 2.38 1.05 2.45 32.00 16.24 19.64 0.39 0.71
19 151.08 150.00 199.46 2.03 1.00 2.70 32.00 15.77 19.04 0.42 0.62
20 200.00 200.00 150.00 1.37 3.00 2.52 23.00 11.53 17.86 0.46 0.68
21 200.00 199.30 150.00 1.62 3.00 2.43 32.00 11.22 15.29 0.49 0.62
22 200.00 200.00 153.97 1.86 3.00 2.63 31.78 10.76 14.44 0.54 0.64
23 200.00 199.23 158.92 1.95 3.00 2.06 31.14 10.74 15.70 0.59 0.72
24 200.00 200.00 162.26 1.85 3.00 2.51 31.99 10.30 14.37 0.60 0.75
Figure 9: Undeformed and deformed shape of optimum tube systems for different SEA and CFE values
Results show that SEA and CFE values obtained from optimization models and FE analyses are sufficiently close. It indicates that quadratic polynomial function is accurate enough for concentric circular tri‐tubular structures. CFE values from optimization result are lower than the values from FE analyses and SEA values are similar for all optimum designs.
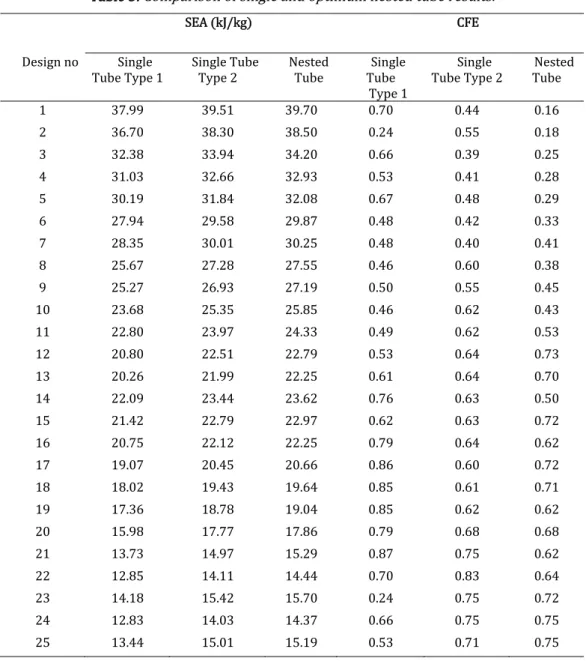
Table 5: Comparison of single and optimum nested tube results.
SEA kJ/kg CFE
Design no Single
Tube Type 1 Single Tube Type 2 NestedTube TubeSingle Type 1
Single
Tube Type 2 Tube Nested
1 37.99 39.51 39.70 0.70 0.44 0.16
2 36.70 38.30 38.50 0.24 0.55 0.18
3 32.38 33.94 34.20 0.66 0.39 0.25
4 31.03 32.66 32.93 0.53 0.41 0.28
5 30.19 31.84 32.08 0.67 0.48 0.29
6 27.94 29.58 29.87 0.48 0.42 0.33
7 28.35 30.01 30.25 0.48 0.40 0.41
8 25.67 27.28 27.55 0.46 0.60 0.38
9 25.27 26.93 27.19 0.50 0.55 0.45
10 23.68 25.35 25.85 0.46 0.62 0.43
11 22.80 23.97 24.33 0.49 0.62 0.53
12 20.80 22.51 22.79 0.53 0.64 0.73
13 20.26 21.99 22.25 0.61 0.64 0.70
14 22.09 23.44 23.62 0.76 0.63 0.50
15 21.42 22.79 22.97 0.62 0.63 0.72
16 20.75 22.12 22.25 0.79 0.64 0.62
17 19.07 20.45 20.66 0.86 0.60 0.72
18 18.02 19.43 19.64 0.85 0.61 0.71
19 17.36 18.78 19.04 0.85 0.62 0.62
20 15.98 17.77 17.86 0.79 0.68 0.68
21 13.73 14.97 15.29 0.87 0.75 0.62
22 12.85 14.11 14.44 0.70 0.83 0.64
23 14.18 15.42 15.70 0.24 0.75 0.72
24 12.83 14.03 14.37 0.66 0.75 0.75
25 13.44 15.01 15.19 0.53 0.71 0.75
Crash tubes are used traditionally as single tube structures in automotive industry. Therefore, results of optimum designs of nested tubes structures are compared with the results of two different types of single tube structures in Table 5. In Table 5, single tubes corresponding to a design number have identical mass values. In Single Tube Type 1, radius and length values correspond to average values in those of nested tubes shown in Figure 10. In Single Tube Type 2, radius and length values correspond to maximum values in those of nested tubes.
In comparison with the results, nested tubes give higher CFE values only for a few designs. The axial displacement and peak crash force values should be lower to obtain higher CFE values. It can be said that the stiffness of nested tubes should be increased to prevent more deflection in axial direction and the gaps between the tubes should be increased to reduce contact forces.
Figure 10: Schematic views of nested and single tube structures.
4. CONCLUSION
In this study, optimization was carried out in order to improve the crashworthiness performance of nested and concentric circular tubes. SEA and CFE were considered as performance measure for crashworthiness. Specific Energy Absorption and Crash Force Efficiency were calculated using Explicit Finite Element analysis. For further calculations in optimization procedure, FE Analyses were replaced with RS models in order to reduce the computational cost. RS models for SEA and CFE were coupled with Genetic Algorithm to find optimum design variables and multi‐objective optimization procedure was performed to maximize the objective function of SEA and CFE. NSGAII was applied to obtain the Pareto optimal solutions and the Pareto optimal frontier was plotted. Length and thickness of three concentric tubes as well as radius of one tube were considered as design variables.
25 different optimum crash tube models were obtained by using multi objective optimization method. SEA and CFE values of optimum designs of nested tube structures were compared with the results of two different types of circular tube structures having identical masses. From design point of view, it was observed that nested tubes had no advantages according to single tubes for CFE criterion. To increase the CFE values of nested tube structures, the stiffness of each tube and the gaps between nested tubes should be increased.
On the other hand, optimum designs gave better results than the single tube types in terms of SEA values. Therefore, nested tubes could provide lower weight to the vehicles.
Acknowledgment
Support for this work has been provided by the Scientific and Technological Research Council of Turkey TUBITAK under Project Number 113M395.
We thank V. Martínez‐Cagigal for the MOPSO code implementation, which can be found in https://es.mathworks.com/matlabcentral/fileexchange/62074‐multi‐objective‐particle‐swarm‐optimization‐‐ mopso‐?focused 7573906&tab function.
References
Abramowicz, W., Jones, N. 1984a . Dynamic axial crushing of circular tubes, International Journal of Impact Engineering, 2.3: 263‐281.
Abramowicz, W., Jones, N. 1984b . Dynamic axial crushing of square tubes, International Journal of Impact Engineering, 2.2: 179‐208.
Alexander, J. M. 1960 . An approximate analysis of the collapse of thin cylindrical shells under axial loading, The Quarterly Journal of Mechanics and Applied Mathematics, 13.1: 10‐15.
Box, G. E., Draper, N. R. 1987 . Empirical model‐building and response surfaces Vol. 424 , New York: Wiley.
Deb, K. 2002 . A fast and elitist multi‐objective genetic algorithm: NSGA‐II, IEEE Transactions on Evolutionary Computation 6.2: 182‐197.
Fang, J., Gao, Y., Sun, G., Zhang, Y., Li, Q. 2014 . Parametric analysis and multiobjective optimization for functionally graded foam‐filled thin‐wall tube under lateral impact, Computational Materials Science, 90: 265‐275.
Goldberg, D. E. 1989 . Genetic algorithms in search, optimization, and machine learning, 1989, Reading: Addison‐ Wesley.
Guler, M. A., Cerit, M. E., Bayram, B., Gerceker, B., Karakaya, E. 2010 . The effect of geometrical parameters on the energy absorption characteristics of thin‐walled structures under axial impact loading. International Journal of Crashworthiness, 15.4: 377‐390.
Hallquist, J. O. 2007 . LS‐DYNA keyword user’s manual, Livermore Software Technology Corporation, 970.
Hou, S., Li, Q., Long, S., Yang, X., Li, W. 2008 . Multiobjective optimization of multi‐cell sections for the crashworthiness design, International Journal of Impact Engineering, 35.11: 1355‐1367.
Jones, N. 1989 . Recent studies on the dynamic plastic behavior of structures, Applied Mechanics Reviews, 42.4: 95‐115.
Jones, N. 1996 . Recent studies on the dynamic plastic behavior of structures‐Update, Applied Mechanics Reviews, 49: 112‐117.
Jones, N. 2011 . Structural impact, Cambridge university press.
Kazancı, Z., Bathe, K‐J. 2012 . Crushing and crashing of tubes with implicit time integration. International Journal of Impact Engineering, 42,:80‐88.
Kim, H. S. 2002 . New extruded multi‐cell aluminum profile for maximum crash energy absorption and weight efficiency, Thin‐Walled Structures, 40.4: 311‐327.
Kurtaran, H., Eskandarian, A., Marzougui, D., Bedewi, N. E. 2002 . Crashworthiness design optimization using successive response surface approximations, Computational mechanics, 29.4: 409‐421.
Najafi, A., Rais‐Rohani, M. 2011 . Mechanics of axial plastic collapse in multi‐cell, multi‐corner crush tubes, Thin‐ Walled Structures, 49.1: 1‐12.
Nia, A. A., Chahardoli, S. 2016a . Mechanical behavior of nested multi‐tubular structures under quasi‐static axial load, Thin‐Walled Structures, 106: 376–89.
Nia, A. A., & Chahardoli, S. 2016b . Optimizing the layout of nested three‐tube structures in quasi‐static axial collapse, Thin‐Walled Structures, 107: 169‐181.
Olabi, A. G., Morris, E., Hashmi, M. S. J., Gilchrist, M. D. 2008 . Optimised design of nested circular tube energy absorbers under lateral impact loading, International Journal of Mechanical Sciences, 50.1: 104‐116.
Usta, F., Eren, Z., Turkmen, H. S., Kazancı, Z., Mecitoglu, Z. 2015 . Numerical investigation of stepped concentric crash tubes subjected to axial impact: The effects of number of tubes, Recent Advances in Space Technologies
RAST , 2015 7th International Conference on. IEEE, 39‐43.
Usta, F., & Türkmen, H. S. 2017 . Crash behavior of nested tube structures with various cross sections. In Recent Advances in Space Technologies RAST , 8th International Conference on. IEEE, 23‐27.
Yin, H., Wen, G., Liu, Z., Qing, Q. 2014a . Crashworthiness optimization design for foam‐filled multi‐cell thin‐walled structures, Thin‐Walled Structures, 75: 8‐17.
Yin, H., Wen, G., Wu, X., Qing, Q., Hou, S. 2014b . Crashworthiness design of functionally graded foam‐filled multi‐ cell thin‐walled structures, Thin‐Walled Structures, 85: 142‐155.