Multi-Objective Curing Cycle Optimization for Glass Fabric/Epoxy Composites Using
Poisson Regression and Genetic Algorithm
Georgios Seretisa*, Georgios Kouzilosa, Dimitrios Manolakosa, Christopher Provatidisa
Received: September 07, 2017; Revised: November 10, 2017; Accepted: December 14, 2017
In this study, a multi-parameter design of experiments, using Taguchi method, has been conducted in order to investigate the optimum curing conditions for glass fabric/epoxy laminated composites, followed by a statistical analysis and genetic algorithm optimization. Heating rate a, temperature T1 and duration h1 were treated as independent variables in a L25 Taguchi orthogonal array addressing
five levels each. Tensile load and flexural strength were examined as pre-selected quality objectives. The results of the analysis of variance performed showed that the significant parameters for both tensile and flexural strength were temperature and duration, at a 95% confidence level. The estimation of the curing parameters for optimum tensile and flexural performance was achieved with an error considerably lower than 1%. The Poisson regression analysis was introduced to achieve a highly
accurate regression model, with R2 greater than 97% for both optimization criteria. Finally, these two
regression models were converted into a two-fold function for maximizing both criteria, and used as
fitness function for a multi-objective optimization genetic algorithm.
Keywords: Polymer-matrix composites, Laminates, Cure behavior, Mechanical properties, Poisson regression, Soft-computing.
*e-mail: [email protected]
1. Introduction
One of the most important processes for epoxy composites
production is curing, since most of the final properties of the composites are controlled and affected by the curing
cycle applied1,2. Many different parameters that affect the
curing cycle and its results, such as the relation between the curing temperature (Tcure) and the glass transition temperature (Tg)3, have been widely investigated3-6. Alternative curing
processes, such as curing using microwaves, have been studied as well7-10.
Taguchi analysis has been used in many cases to predict
the response of composite materials, evaluate the significance of affecting parameters and calculate the optimum conditions/
parameters for various types of composite materials and related processes. A.Q. Barbosa et al. used a Taguchi design
of experiments to understand the influence of each parameter
under study (amount, size and presence of surface treatment) and the interaction between them11. The finite element (FE)
simulation, the Taguchi technique, and the analysis of variance (ANOVA) techniques were carried out by Thipprakmas
to investigate the degree of importance of V-ring indenter parameters12. A. K. Parida et al. applied response surface
methodology (RSM) to determine the optimum machining conditions leading to minimum surface roughness in drilling
of GFRP composite13. The experimental plan and analysis
is based on the Taguchi L27 orthogonal array taking spindle speed (N), feed (f) and diameter of drill bit (d) as important
parameters. Rout and Satapathy describe a Taguchi design methodology to determine optimal parameter settings in the development of multiphase hybrid composites consisting of
epoxy reinforced with glass-fiber and filled with rice husk
particulates14. R.A. Kishore et al. performed a Taguchi
analysis of the residual tensile strength after drilling in
glass fiber reinforced epoxy composites15. V.N. Gaitonde
et al. investigated and analyzed the parametric influence on delamination in high-speed drilling of carbon fiber reinforced
plastic composites16. Tsao and Hocheng investigated the
delamination associated with various drill bits in drilling of composite materials using Taguchi analysis17. Davim
and Reis investigated the drilling process on carbon fiber
reinforced plastics manufactured by autoclave, performing an experimental study followed by a statistical analysis of the results18.
Several different methods have been used to analyze the influence of the curing parameters on the final properties of the produced composites. Full factorial approaches are the
most commonly used although they employ limited number of levels for each factor, due to the considerably large number of experiments19,20. Some studies control only one factor per time, i.e. per experimental series21. The central composite
rotatable design combined with a quadratic response surface
model has been also used22. Finally, Taguchi design of
experiments has been used combined mostly with linear or
quadratic regression models11.
The commonly used Multiple Regression Analyses
are based on many different regression models23-28. Many
efforts have been made in order to achieve a highly accurate
multiple regression model25,27-29. However, the widely used
regression models are quite trivial and their accuracy is in many cases quite low11.
In order to investigate the optimum curing conditions for glass fabric/epoxy laminated composites, a multi-parameter design of experiments, using Taguchi method, has been conducted in this study, followed by statistical analysis and
a genetic algorithm multi-objective optimization. In a L25
Taguchi orthogonal array, the parameters heating rate a, temperature T1 and duration h1 were treated as independent
variables addressing five levels each. The quality objectives examined were tensile load and flexural strength. Flexural
strength is of the most important and desired properties of fabric reinforced laminated composites30-32. However,
composite structures often fail under flexural load32,33.
Therefore, it is crucial to obtain the optimum flexural
strength for these materials, since there is a constant need
for their flexural performance improvement. Additionally,
tensile performance is important to be optimized for all engineering materials. Analysis of variance results shown
that the significant parameters for both tensile and flexural
strength were temperature T1 and duration h1, at a 95%
confidence level. The error of the estimation of the curing parameters for optimum tensile and flexural performance was considerably lower than 1%. However, the widely used regression models achieved quite low accuracy. Therefore, the solution came from a regression analysis that is quite
common in epidemiology, sociology and psychology, i.e.
Poisson regression. Here, the Poisson regression analysis was
introduced to achieve a highly accurate regression model, with R2 greater than 97% for both optimization criteria. This
accuracy has never reported using the widely used regression
models. Finally, these two regression models were converted
into a two-fold function for maximizing both criteria, and
used as fitness function for a multi-objective optimization
genetic algorithm.
2. Taguchi design of Experiments
In order to study the entire process parameter space with a small number of experiments only, Taguchi's method uses a special design of orthogonal arrays34. The Taguchi
approach is a more effective method than traditional design
of experiment methods such as factorial design, which is resource and time consuming. With this method the number
of experiments to evaluate the influence of control parameters on certain quality properties or characteristics is markedly reduced compared to a full factorial approach. For example, a process with 8 variables, each with 3 states, would require
38 = 6561 experiments to test all variables (full factorial
design). However, using Taguchi's orthogonal arrays, only
18 experiments are necessary, i.e. less than 0.3% of the
original number of experiments. Taguchi recommends the use of the loss function to determine the deviation between the experimental value of the performance characteristic and the desired value. The loss function is further transformed
into an S/N ratio, which is used to rank the influencing
parameters according to their impact on the measured
value. After that, the significant parameters can be separated
from the parameters which are negligible using ANOVA. This allows a prediction of the optimal manufacturing or process parameters35. To verify the predicted optimal testing
parameters, a confirmation experiment with these parameters
should be employed36,37.
In the calculation of the loss function there are three ways of transformation depending on the desired characteristic of the measured value. The characteristic of the desired value can either be the-lower-the-better, the-higher-the-better or the-nominal-the better. The loss function of the
''the-nominal-the-better'' quality characteristic (yk) with m as the mean
of the target quality parameter is calculated as shown in Eq. (1) where Lij is the loss function of the ith performance
characteristic in the jth experiment.
The loss function of the "the-lower-the-better" and the
"the higher- the-better" from the target value of the quality performance characteristic are shown in Eqs. (2) and (3),
respectively.
(1)
(2)
(3)
In the Taguchi method, the S/N ratio is used to determine the deviation of the performance characteristic from the desired value. The S/N ratio nij for the ith performance
characteristic in the jth experiment can be calculated using
the following equation:
(4)
Regardless of the category of the performance characteristic,
a larger S/N ratio corresponds to a better-quality performance.
Therefore, the optimal level of the process parameters is the level with the highest S/N ratio38,39.
The selection of control factors is the most important part in the design of experiment. Therefore, many factors are
initially included so that the non-significant variables can be identified easily. Factors like heating rate (a), temperature (T1), time (h1) largely influence the mechanical behavior of the epoxy matrix19-22 and, consequently, of the laminated composite. The impact of these three factors on tensile
L
ijn
1
ky
m
n ij 1
2
/
=
= R-
WL
ijn
1
ky
n ij 1 2
/
=
=L
n
y
1
1
ij k
n
ij
1 2
/
=
=log
and fracture stresses in glass fabric/epoxy composites is,
therefore, studied in this work using an L25 orthogonal array
design. The selected levels of the three control factors are
listed in Table 1. Since to different targets are included in this study, i.e. tensile and flexural performance, the levels
of the temperature factor (T1) should be both below and above Tg temperature, in order to investigate all the curing mechanisms can be achieved3-5,19-21. The levels of the time factor (h1) and the heating rate factor (a) were selected to be in accordance with both the literature19-21,40 and manufacturers' guides for similar epoxy systems.
3. Experimental Procedure
3.1 Materials
The low-viscosity Araldite GY 783 epoxy resin combined
with the low-viscosity, phenol free, modified cycloaliphatic
polyamine hardener was used as matrix material for the composite specimens of the present study. The glass transition temperature (Tg) was 100°C and the gel time for the specific
matrix composition at 20°C and 65% relative humidity (RH), conditioning requirements which were obeyed during
the preparation of the composites laminates, was 35 min.
Woven E-glass fabric of 282 g/m2 density was used for
matrix reinforcement, as presented in Fig.1. Fig.2 presents
an explosive view of the fabrication process together with
the E-glass fabric (P) orientations in the composite laminates.
The characteristics of the fabric used can be found in Table 2. Since the warp direction is the enhanced one, see Table 2, it is clear that this is the main weave direction. Therefore,
the laminae orientations in the stacking sequence of the
composites will be based on the warp direction.
3.2 Preparation of E-glass fabric/epoxy
composites
Weighed amount of hardener was added into the epoxy resin (monomer) at the manufacturer recommended monomer/ hardener proportion, which was a 100:50 by weight ratio, and stirred gently using a laboratory mixer for mechanical
Table 1. Parameters and Design of Experiments (DOE) Levels.
Control factor Level Units
I II III IV V
Heating Rate a 1 2 3 4 5 ºC/min
Temperature T1 50 80 100 120 140 ºC
Time h1 2 4 6 8 10 h
Table 2. Characteristics of the glass fabrics used.
Warp Weft
Fiber description Glass EC11 204 fiber Glass EC11 204 fiber
Thread count (ends/cm) 8 6
Weight distribution (%) 57 43
Figure 1. The woven E-glass fabric used in layer orientation 0º.
Figure 2. Layer sequence and fabric orientation on the tested
[0º/45º/-45º/0º]T laminates.
stirring for a process time of 5 min at 200 rpm. Subsequently, the matrix mixture was coated and hand-rolled on E-glass fabrics in layer sequence under constant stirring. For each hand lay-up procedure, four layers of E-glass fabric were
employed in [0º/45º/-45º/0º]T sequence. Before the first layer coating, the surface on which the specimens were produced was covered by release paste wax. The hand
lay-up procedure applied, along with the stacking sequence of the specimens, is presented in Fig.2 through a 3D model in
explosive view mode. The processing temperature for the hand lay-up process applied was 23±1°C (ambient temperature).
To achieve a 40±1% by volume epoxy proportion in all
coating were weighed before each hand lay-up process and
after solidification.
The dimensions of each specimen which underwent 3-point
bending tests were 93.6 × 12.7 ×1.1 mm, as in accordance with ASTM D790-03 test method. The specimens which underwent tensile test had a total size of 102 × 6 × 1.1 mm according to ASTM D3039/3039M. All specimens were
cut at their testing dimensions using a Struers Discotom-2
along with a 40A25 cut-off wheel. To evaluate if tabs
were needed on the holding regions of the specimens, the
theoretical tab limits were marked on the specimens, as
indicated from the aforementioned ASTM standard method. Thus, if the failure occurs between the two theoretical tab limits (theoretical control region) no tabs are needed. As it
can be seen in Fig.3, the failure occurred into the theoretical
control region and, therefore, no tabs are recommended by the ASTM standard used.
For each experiment number (run number) of the Taguchi design of experiments, see Tables 3 and 4, five specimens were prepared and underwent each test (five specimens for each tensile and five for each flexural test).
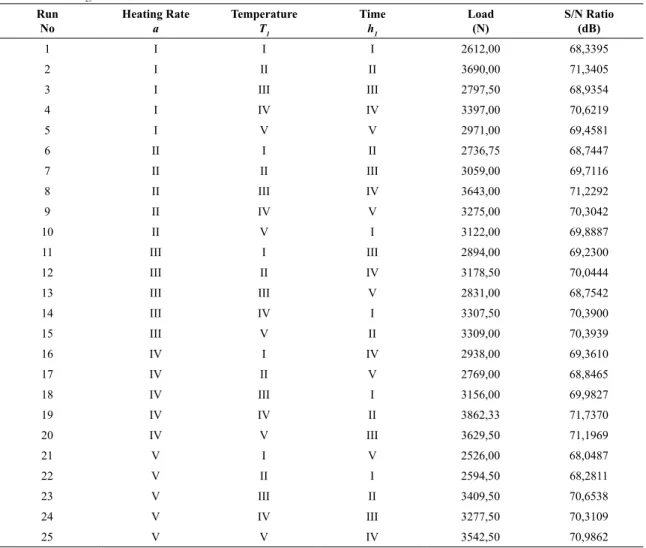
Table 3. Taguchi L25 OA response values and S/N ratio for Load in Tensile tests.
Run No
Heating Rate a
Temperature T1
Time h1
Load (N)
S/N Ratio (dB)
1 Ι I I 2612,00 68,3395
2 Ι II II 3690,00 71,3405
3 Ι III III 2797,50 68,9354
4 Ι IV IV 3397,00 70,6219
5 Ι V V 2971,00 69,4581
6 ΙΙ I II 2736,75 68,7447
7 ΙΙ II III 3059,00 69,7116
8 ΙΙ III IV 3643,00 71,2292
9 ΙΙ IV V 3275,00 70,3042
10 ΙΙ V I 3122,00 69,8887
11 ΙΙΙ I III 2894,00 69,2300
12 ΙΙΙ II IV 3178,50 70,0444
13 ΙΙΙ III V 2831,00 68,7542
14 ΙΙΙ IV I 3307,50 70,3900
15 ΙΙΙ V II 3309,00 70,3939
16 IV I IV 2938,00 69,3610
17 IV II V 2769,00 68,8465
18 IV III I 3156,00 69,9827
19 IV IV II 3862,33 71,7370
20 IV V III 3629,50 71,1969
21 V I V 2526,00 68,0487
22 V II I 2594,50 68,2811
23 V III II 3409,50 70,6538
24 V IV III 3277,50 70,3109
25 V V IV 3542,50 70,9862
Figure 3. Holding region boundaries and theoretical tab limits for
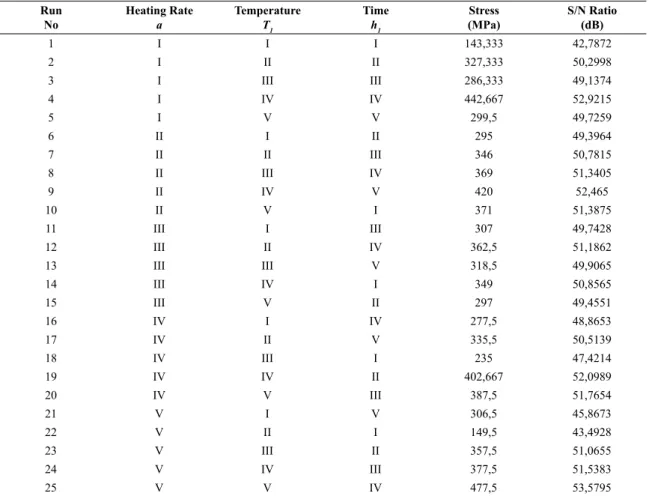
Table 4. Taguchi L25 OA response values a nd S/N ratio for Stress in Flexural tests.
Run No
Heating Rate a
Temperature T1
Time h1
Stress (MPa)
S/N Ratio (dB)
1 Ι I I 143,333 42,7872
2 Ι II II 327,333 50,2998
3 Ι III III 286,333 49,1374
4 Ι IV IV 442,667 52,9215
5 Ι V V 299,5 49,7259
6 ΙΙ I II 295 49,3964
7 ΙΙ II III 346 50,7815
8 ΙΙ III IV 369 51,3405
9 ΙΙ IV V 420 52,465
10 ΙΙ V I 371 51,3875
11 ΙΙΙ I III 307 49,7428
12 ΙΙΙ II IV 362,5 51,1862
13 ΙΙΙ III V 318,5 49,9065
14 ΙΙΙ IV I 349 50,8565
15 ΙΙΙ V II 297 49,4551
16 IV I IV 277,5 48,8653
17 IV II V 335,5 50,5139
18 IV III I 235 47,4214
19 IV IV II 402,667 52,0989
20 IV V III 387,5 51,7654
21 V I V 306,5 45,8673
22 V II I 149,5 43,4928
23 V III II 357,5 51,0655
24 V IV III 377,5 51,5383
25 V V IV 477,5 53,5795
3.3 Curing of E-glass fabric/epoxy composites
All specimens left in ambient temperature for 6 hours before the curing conditions of the Taguchi design of experiments, as described in Tables 3 and 4, were applied. Therefore, the complete curing cycle applied is presented
in Fig.4, where parameter a, T1 and h1 represent the heating
rate [°C/min], the temperature of the first curing step [°C] and the duration of the first curing step [h], respectively.
The selected values for each parameter under study (i.e. the design of experiment levels) can be found in Table 1.
The curing temperature (Tcure) can be either higher or lower of the glass transition temperature (Tg)3-5. When
Tcure > Tg, the reaction proceeds rapidly at a rate driven by
chemical kinetics. When Tcure = Tg, vitrification takes place
(i.e. material solidifies). Finally, when Tcure < Tg, the reaction
rate decelerates and becomes diffusion-controlled. In order
to include all the aforementioned mechanisms in the Taguchi design of experiments, apart from the Tg temperature, two
different temperatures under Tg were selected as well as two
different temperatures over it, see Table 1.
3.4 Experimental set-up and tests
The test machine used for the both tensile and 3-point
bending tests was an Instron 4482 of 100 kN capacity. In
accordance with the ASTM standard methods used, i.e.
D790-03 and D3039/3039M, all tests were performed in a standard laboratory atmosphere (23±1ºC and 50±5% relative humidity). Test conditioning was kept constant for 6 hours
before each test. To meet the test method's span-to-depth
specification, the support span was set at 52 mm for the flexural tests. The recommended from the ASTM methods
test speed of 2 mm/min was applied on both tensile and 3-point bending tests.
Figure 4. The curing cycle applied together with the parameters
4. Results and Discussion
4.1 Taguchi results
In terms of the S/N ratio for stresses and load value, the higher the better. This can be calculated as logarithmic
transformation of loss function (Eq. 2). The calculated
signal to noise (S/N) ratio for each experiment is presented
in Tables 3 and 4 for tensile and flexural test respectively,
along with their experimental results. S/N ratio is an important characteristic in order to achieve robustness in Taguchi design
of experiment, desired output is known as the signal and variability caused by factors is known as noise.
The main effects plot for the main effect terms in tensile
load for factors a, T1, and h1 are shown in Fig.5. From the
main effect plots, it has been observed that the tensile load
of the composite increases for heating rate values ranging from 1ºC/min to 2ºC/min and from 3ºC/min to 4 ºC/min and decreases with faster heating. The curing temperature
affects the tensile load increase of the composite material as well. Specifically, while temperature is ranging from 50 ºC to 80 ºC an increase in load occurred. Subsequently, from
80 ºC to 100 ºC the load remains constant and from 100 ºC
up to 120 ºC it increases. Further increase in temperature
leads to an opposite outcome, showing downgrading of mechanical properties due to thermal decomposition of long chains of the epoxy matrix. With increased temperature, free radicals and developing polymer chains become more
fluid as a consequence of decreased viscosity and they
react to a greater extent. This results in a more complete
polymerization reaction and consequently greater cross-linking41. The increase in the degree of polymerization of
composites may lead to improved mechanical properties and increased wear resistance42. Therefore, it is expected that
by increasing the process temperature the performance of
the produced composite may be consequently increased as well. It is known that while the temperature increases, the thermal expansion coefficient of epoxy/fiberglass composites
is being increased as well43. However, it increases with a
different rate of change for low and for high temperature values. Specifically, for low temperature values the rate of change is quite low and while increasing the temperature this rate takes considerably greater values. Due to the high values of thermal expansion coefficient for temperatures
greater than 120 ºC, voids may be formed on the epoxy/
fiberglass interfaces, leading in this manner to a consequent
performance drop44. The curing time increase affects the
increase of the tensile load of the composite material while factor h1 is ranging from 2 to 4 hours. From 4 to 6 hours the
tensile load decreases. From 6 to 8 hours the load increases
and for greater values of h1 the load decreases. From the
main effect plots of Fig.6, it can be observed that the flexural
strength of the composite responses similarly with the tensile
load while changing the heating rate value. The temperature
increase affects the flexural strength of the composite in the same manner as it affects the tensile load, as well. The h1 factor, which represents the curing duration, has a positive
effect in terms of increasing the flexural strength of the composite. For h1 values up to 8 hours a rise of load can be observed and with further increase of h1 factor the flexural strength decreases. In general, an initial performance increase
can be observed for both tensile and flexural tests while the curing time increases. Subsequently, the performance shows a decreasing trend. For short curing times, it is known that a curing time increase leads to a subsequent strength increase45.
The curing cycle had a significant effect on both the tensile and flexural performance of the composites. It is known that the curing cycle affects the polymer chains of the matrix46-49 as well as the quality of the fibril/epoxy interface44. Due to
the different thermal expansion coefficient of the involved components, i.e. fibrils and epoxy matrix, while a composite
laminate undergoes thermal cycles during curing, voids
may be formed on the fibril/epoxy interfaces leading to an
interface interruption44.
Figure 5. Main effect plots for tensile load for a (heating rate), T1
(temperature) and h1 (time) factors.
Figure 6. Main effect plots for flexural strength for a (heating rate),
4.2 Analysis of Variance
Analysis of variance (ANOVA) is a statistical tool which examines the hypothesis that the means of two or more
populations are equal. It evaluates the significance of one or
more factors by comparing the response variable means at
the different factor levels. It was observed that the significant factor for tensile and flexural strength was temperature and time at 95% confidence level, see Tables 5 and 6. In order
to evaluate the analysis, conformation tests were performed (Tables 7 and 8) by comparing actual values and optimal
ones. The optimal values can be predicted using Eq. (5)50.
(5)
where: ηm is the total mean of the response under
consideration (tensile load and flexural strength, respectively); ηi is the mean response value at the optimum level and q is the
number of the curing process control factors that significantly affect the response of the composites after curing.
4.3 Poisson Regression Analysis with Backward
Elimination
Regression analysis is a statistical process for approximating the relationships between variables. It is a method for modelling
different variables. It helps to understand how the dependent
variable deviates when any one of the independent variables is changed51. Poisson regression is a regression method, which
employees a logarithmic transformation that compensates
for skewness, prevents a negative predicted value, and also
includes the proportionality between variance and the mean52.
Therefore, if Y has a Poisson distribution, then a log-linear model can be constructed as
(6)
The difficulty of the above form is that the prediction is
in terms of log counts. However, in practice actual counts
are needed. To handle this difficulty, both sides have to be
exponiated.
(7)
or equally
(8)
In this form, the predicted value of Y is in counts.
The backward elimination applied to all the variants included in the regression. The effect of removing a variable on residual mean square (MSres) was assessed for each variable,
and the variable with the least effect on increasing MSres was removed if it did not increase the F ratio for removal, Fout. Fout was set at 4. The process continued until removal
caused a significant change in MSres, when that variant was left in and no further removals were done.
Poisson regression analysis, together with backward elimination, was carried out for tensile load and flexural strength taking all factors (a, T1, h1) as independent variables.
In the case of flexural strength regression model, only the significant factors (T1, h1) were kept, since the heating rate factor (a) was eliminated by the backward elimination
process. Normal probability of regression equation was also plotted in Figs.7 and 8 for tensile load and flexural strength respectively. The regression coefficients of tensile load and flexural stress values are provided in Tables 9 and
10 respectively.
(9)
where
Y1' = -0.3 - 8.8 × a + 0.524 × T1-0.83 × h1 + 0.784 × a2
- 0.002901 × T12 + 1.547 × h2 + 5.31 × a × h
1-0.1979 × T1 ×
h1 + 0.000003 × T13 - 0.285 × h 1
3 - 0.3327 × a × h2 + 0.00099
× T12 × h
1 + 0.01975 × T1 × h
2 + 0.0153 × h 1
4 + 0.03159 ×
a2 × h2 + 0.126 × a × h 1
3 - 0.000001 × T 1
3 × h
1 - 0.000064 ×
T12 × h2 - 0.000481 × T1 × h3 - 0.00573 × a × h4
(10)
where
Y2' = 4.6336 + 0.009461 × T1 + 0.1188 × h1 – 0.000792
× T1 × h1
ln Y
t
=
a
+
b
1X
1+
b
2X
2+
g
+
b
kX
ke
lnYt=
e
Qa b+ 1 1X+b2X2+g+bkXkVY
t
=
e
Qa b+ 1 1X+b2X2+g+bkXkVTensile Load
=
e
Y1lFlexural Strength
=
e
Yl2Figure 7. Normal probability of regression equation for tensile load.
Figure 8. Normal probability of regression equation for flexural
strength.
n
optn
m in
n
q
i m
1
/
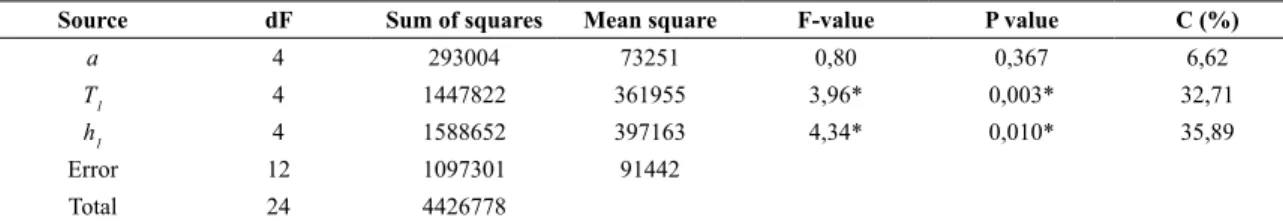
Table 5. ANOVA for Tensile load value, without interaction, F0,05,4,12=3,26,.
Source dF Sum of squares Mean square F-value P value C (%)
a 4 293004 73251 0,80 0,367 6,62
T1 4 1447822 361955 3,96* 0,003* 32,71
h1 4 1588652 397163 4,34* 0,010* 35,89
Error 12 1097301 91442
Total 24 4426778
*Significant at 95% confidence level.
Table 6. ANOVA for Flexural stress value, without interaction, F0,05,4,12=3,26,.
Source dF Sum of squares Mean square F-value P value C (%)
a 4 12361 3090 1,18 0,367 6,92
T1 4 78612 19653 7,53* 0,003* 44,02
h1 4 56284 14071 5,39* 0,010* 31,52
Error 12 31335 2611
Total 24 178591
*Significant at 95% confidence level.
Table 7. Confirmation table for tensile load.
Parameter Optimal Parameter
a = 4 ºC/min,T1 = 120 ºC,h1 = 4 h
Experimental Predicted
Load (N) 3862,33 3878,10
Error % 0,41 %
Table 8. Confirmation table for flexural strenth.
Parameter Optimal Parameter
a = 2 ºC/min,T1 = 120 ºC,h1 = 8 h
Experimental Predicted
Flexural Stress (N) 498,70 501,93
Error % 0,65%
Taking this data into consideration it is possible to formulate an equation that allows for the prediction of
the mechanical behavior of the composite by altering the
temperature and the curing time. Figs. 9 and 10 present a comparison between the theoretical model, see Eqs. (9)
and (10), and the experimental results for both tensile and
flexural tests. It can be easily observed that the experimental
and theoretical results always show a perfect correlation.
Therefore, the equations of the theoretical model above are a
useful tool to accurately predict both the tensile (R2=97.05%)
and flexural (R2=98.11%) response of the cured composites.
4.4 Process optimization using a genetic
algorithm
The aim of the optimization procedure is to determine the optimal values of the curing parameters (a, T1, h1) that contribute to the maximum values for both criteria; Tensile Load and Flexural Strength. The solution of the aforementioned
task lies on the multi-objective optimization concept. The Poisson regression models for both criteria, i.e. Eqs.(9)
and (10), were converted into a MATLAB® function for maximizing Tensile Load and Flexural Strength. Therefore,
the two-fold function of eq. (11) was created.
Figure 9. Comparison between the experimental results and the
theoretical values of tensile load.
Figure 10. Comparison between the experimental results and the
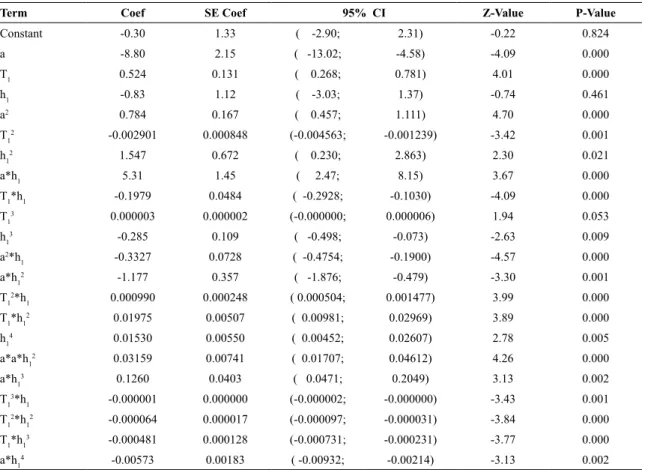
Table 9. Regression coefficients of tensile model with all factors.
Term Coef SE Coef 95% CI Z-Value P-Value
Constant -0.30 1.33 ( -2.90; 2.31) -0.22 0.824
a -8.80 2.15 ( -13.02; -4.58) -4.09 0.000
T1 0.524 0.131 ( 0.268; 0.781) 4.01 0.000
h1 -0.83 1.12 ( -3.03; 1.37) -0.74 0.461
a2 0.784 0.167 ( 0.457; 1.111) 4.70 0.000
T1
2 -0.002901 0.000848 (-0.004563; -0.001239) -3.42 0.001
h12 1.547 0.672 ( 0.230; 2.863) 2.30 0.021
a*h1 5.31 1.45 ( 2.47; 8.15) 3.67 0.000
T1*h1 -0.1979 0.0484 ( -0.2928; -0.1030) -4.09 0.000
T13 0.000003 0.000002 (-0.000000; 0.000006) 1.94 0.053
h1
3 -0.285 0.109 ( -0.498; -0.073) -2.63 0.009
a2*h
1 -0.3327 0.0728 ( -0.4754; -0.1900) -4.57 0.000
a*h12 -1.177 0.357 ( -1.876; -0.479) -3.30 0.001
T1 2*h
1 0.000990 0.000248 ( 0.000504; 0.001477) 3.99 0.000
T1*h1
2 0.01975 0.00507 ( 0.00981; 0.02969) 3.89 0.000
h14 0.01530 0.00550 ( 0.00452; 0.02607) 2.78 0.005
a*a*h1
2 0.03159 0.00741 ( 0.01707; 0.04612) 4.26 0.000
a*h1
3 0.1260 0.0403 ( 0.0471; 0.2049) 3.13 0.002
T13*h
1 -0.000001 0.000000 (-0.000002; -0.000000) -3.43 0.001
T12*h 1
2 -0.000064 0.000017 (-0.000097; -0.000031) -3.84 0.000
T1*h1
3 -0.000481 0.000128 (-0.000731; -0.000231) -3.77 0.000
a*h14 -0.00573 0.00183 ( -0.00932; -0.00214) -3.13 0.002
Table 10. Regression coefficients of flexural model with significant factors.
Term Coef SE Coef 95% CI Z-Value P-Value
Constant 4.6336 0.0952 ( 4.4469; 4.8202) 48.66 0.000
T1 0.009461 0.000879 ( 0.007739; 0.011183) 10.77 0.000
h1 0.1188 0.0135 ( 0.0924; 0.1453) 8.80 0.000
T1*h1 -0.000792 0.000126 (-0.001039; -0.000545) -6.28 0.000
, , // / /
max max min min
max min min
f a T h Tensile Load Tensile Load e Flexural Strength Flexural Strength e
1 1
1 1
Y Y
1 1
1
2
= == = =
l
l
Q V G RQ V W Q QV (11)V
where
Y1' = -0.3 - 8.8 × a + 0.524 × T1-0.83 × h1 + 0.784 × a2
- 0.002901 × T12 + 1.547 × h2 + 5.31 × a × h
1-0.1979 × T1 ×
h1 + 0.000003 × T13 - 0.285 × h 1
3 - 0.3327 × a × h2 + 0.00099
× T12 × h
1 + 0.01975 × T1 × h
2 + 0.0153 × h 1
4 + 0.03159 ×
a2 × h2 + 0.126 × a × h 1
3 - 0.000001 × T 1
3 × h
1 - 0.000064 ×
T12 × h2 - 0.000481 × T1 × h3 - 0.00573 × a × h4
and
Y2' = 4.6336 + 0.009461 × T1 + 0.1188 × h1 – 0.000792
× T1 × h1
Eq. (11) was the fitness function for the multi-objective optimization GA of MATLAB® optimization toolbox. For
the optimization process a population size of 45 individuals
(15 * number of variables) was specified to evolve for 500
generations with 0.8 probability single point crossover and a constraint dependent mutation function. The algorithmic parameter values were selected as recommended by the optimization toolbox employed, i.e. the migration interval
was set to 20; migration fraction was set to 0.2 and Pareto
fraction was set to 0.35.
The Pareto-optimal solutions obtained together with
their corresponding performance values are summarized in Table 11. The average distance between individuals
(candidate solutions) referring to the objective values is depicted in Fig.11. As can be seen in Table 11, the minimum
individual distance was obtained for solutions 1 and 2.
Therefore, the respective Pareto-optimal fonts indicate that
the curing process is optimum, as per the maximization of
Table 11. Pareto font-function values and optimal curing parameters.
Solution no. a (ºC/min) T1(ºC) h1(h) Pareto distance
1 1.001841317 139.9999999 9.999999959 1.6914
2 1.000105286 85.51085564 9.997251776 1.4935
3 1.001847642 139.4348674 9.99881099 1.6890
4 1.001838635 135.9951147 9.999994125 1.6747
5 1.000105286 85.51085564 9.997251776 1.4935
6 1.001731003 137.6706621 9.999573415 1.6816
7 1.00182876 135.1332839 9.999991494 1.6711
8 1.001841317 139.9999999 9.999999959 1.6914
9 1.008023956 136.3610771 9.990931862 1.6788
10 1.014562832 126.9283418 9.986363612 1.6438
11 1.001839871 138.3768794 9.999494526 1.6846
12 1.079739416 118.477614 9.971796304 1.6464
13 1.001841216 137.2358606 9.999992492 1.6798
14 1.00264489 133.0118608 9.979005419 1.6616
15 1.001839235 139.0998201 9.999996542 1.6876
16 1.008728622 134.1460715 9.999806411 1.6706
(c) The optimum performance was obtained for temperature T1 values greater than the glass transition temperature Tg. It is known that when Tcure ˃ Tg, the reaction proceeds rapidly at a rate driven by
chemical kinetics and when Tcure < Tg, the reaction
rate decelerates and becomes diffusion-controlled.
Therefore, it is obvious that both tensile and
flexural performance of the epoxy matrix laminated
composites is mainly controlled by the chemical
kinetics.
(d) Poisson Regression Analysis, together with backward
elimination, led to a theoretical model, the correlation of which with the experimental results was almost
perfect. Therefore, the Poisson regression theoretical
model can accurately predict both the tensile and
flexural response of the cured composites.
(e) The optimum curing process, as regards the
maximization of both tensile and flexural performance,
can be obtained for temperature T1 lower than the glass transition temperature Tg (diffusion-controlled reaction). Additionally, even if the heating rate a is
not a significant factor, the optimum curing process requires a low a value, equal to 1 ºC/min.
6. References
1. Gao L, Zhang Q, Guo J, Li H, Wu J, Yang X, et al. Effects of the amine/epoxy stoichiometry on the curing behavior and glass transition temperature of MWCNTs-NH2/epoxy nanocomposites.
Thermochimica Acta. 2016;639:98-107.
2. Fu Y, Zhong, WH. Cure kinetics behavior of a functionalized graphitic nanofiber modified epoxy resin. Thermochimica Acta. 2011;516(1-2):58-63.
3. Moussa O, Vassilopoulos AP, Keller T. Effects of low-temperature curing on physical behavior of cold-curing epoxy adhesives in bridge construction. International Journal of Adhesion and
Adhesives. 2012;32:15-22.
Figure 11. Average distance between individuals per generation
and Pareto front.
5. Conclusions
Woven E-glass fabric/epoxy laminated composites were produced and underwent tensile and flexural testing
according to a L25 Taguchi design of experiments. Based on
the experimental results as well as the subsequent statistical analysis and genetic algorithm the following remarks may
be drawn:
(a) The significant parameters for both tensile and flexural strength are temperature (T1) and duration (h1), at a 95% confidence level. Therefore, for slow temperature increase values, i.e. 1-5 °C/min, the
effect of the heating rate a on the performance of the cured laminated composite is not considerable. (b) The estimation of the curing parameters for optimum
4. Ellis B. Chemistry and Technology of Epoxy Resins. Dordrecht: Springer; 1993.
5. Wisanrakkit G, Gillham JK. Glass transition temperature (Tg) as an index of chemical conversion for high-Tg amine/epoxy system: Chemical and diffusion controlled reaction kinetics.
Journal of Applied Polymer Science. 1990;41(11-12):2885-2929.
6. Maljaee H, Ghiassi B, Lourenço PB. Effect of synergistic environmental conditions on thermal properties of a cold curing epoxy resin. Composites Part B: Engineering. 2017;113:152-163.
7. Kwak M, Robinson P, Bismarck A, Wise R. Microwave curing of carbon-epoxy composites: Penetration depth and material characterisation. Composites Part A: Applied Science and
Manufacturing. 2015;75:18-27.
8. Johnston K, Pavuluri SK, Leonard MT, Desmulliez MPY, Arrighi V. Microwave and thermal curing of an epoxy resin for microelectronic applications. Thermochimica Acta. 2015;616:100-109.
9. De Vergara UL, Sarrionandia M, Gondra K, Aurrekoetxea J. Polymerization and curing kinetics of furan resins under conventional and microwave heating. Thermochimica Acta. 2014;581:92-99.
10. Mijovic J, Fishbain A, Wijaya J. Mechanistic modeling of epoxy amine kinetics. 2. Comparison of kinetics in thermal and microwave fields. Macromolecules. 1992;25(2):986-989.
11. Barbosa AQ, da Silva LFM, Abenojar J, Figueiredo M, Öchsner A. Toughness of a brittle epoxy resin reinforced with micro cork particles: Effect of size, amount and surface treatment.
Composites Part B: Engineering. 2017;114:299-310.
12. Thipprakmas S. Application of Taguchi technique to investigation of geometry and position of V-ring indenter in fine-blanking process. Materials and Design (1980-2015). 2010;31(5):2496-2500.
13. Parida AK, Routara BC, Bhuyan RK. Surface roughness model and parametric optimization in machining of GFRP composite: Taguchi and Response surface methodology approach.
MaterialsToday: Proceedings. 2015;2(4-5):3065-3074.
14. Rout AK, Satapathy A. Study on mechanical and tribo-performance of rice-husk filled glass-epoxy hybrid composites. Materials
and Design. 2012;41:131-141.
15. Kishore RA, Tiwari R, Dvivedi A, Singh I. Taguchi analysis of the residual tensile strength after drilling in glass fiber reinforced epoxy composites. Materials and Design.
2009;30(6):2186-2190.
16. Gaitonde VN, Karnik SR, Rubio JC, Correia AE, Abrão AM, Davim JP. Analysis of parametric influence on delamination in high-speed drilling of carbon fiber reinforced plastic composites.
Journal of Materials Processing Technology.
2008;203(1-3):431-438.
17. Tsao CC, Hocheng H. Taguchi analysis of delamination associated with various drill bits in drilling of composite material.
International Journal of Machine Tools and Manufacture.
2004;44(10):1085-1090.
18. Davim JP, Reis P. Drilling carbon fiber reinforced plastics manufactured by autoclave - experimental and statistical study.
Materials and Design. 2003;24(5):315-324.
19. Davies LW, Day RJ, Bond D, Nesbitt A, Ellis J, Gardon E. Effect of cure cycle heat transfer rates on the physical and mechanical properties of an epoxy matrix composite. Composites Science
and Technology. 2007;67(9):1892-1899.
20. Kumar DS, Shukla MJ, Mahato KK, Rathore DK, Prusty RK, Ray BC. Effect of post-curing on thermal and mechanical behavior of GFRP composites. IOP Conference Series:
Materials Science and Engineering. 2015;75:012012. DOI:
10.1088/1757-899X/75/1/012012
21. Aruniit A, Kers J, Krumme A, Poltimäe T, Tall K. Preliminary Study of the Influence of Post Curing Parameters to the Particle Reinforced Composite's Mechanical and Physical Properties. Materials Science. 2012;18(3):256-261.
22. Sultania M, Rai JSP, Srivastava D. Process modeling, optimization and analysis of esterification reaction of cashew nut shell liquid (CNSL)-derived epoxy resin using response surface methodology.
Journal of Hazardous Materials. 2011;185(2-3):1198-1204.
23. Guo H, Wang X, Gao Z. Uncertain linear regression model and its application. Journal of Intelligent Manufacturing. 2017;28(3):559-564. DOI: 10.1007/s10845-014-1022-1024 24. Tangjitsitcharoen S, Thesniyom P, Ratanakuakangwan S.
Prediction of surface roughness in ball-end milling process by utilizing dynamic cutting force ratio. Journal of Intelligent
Manufacturing. 2017;28(1):13-21. DOI:
10.1007/s10845-014-0958-8
25. Luangpaiboon P, Boonhao S, Montemanni R. Steepest ant sense algorithm for parameter optimization of multi-response processes based on taguchi design. Journal of Intelligent Manufacturing. 2016. DOI: 10.1007/s10845-016-1257-3
26. Sharma N, Kumar K, Raj T, Kumar V. Porosity exploration of SMA by Taguchi, regression analysis and genetic programming.
Journal of Intelligent Manufacturing . 2016. DOI: 10.1007/
s10845-016-1236-8
27. Li C, Li L, Tang Y, Zhu Y, Li L. A comprehensive approach to parameters optimization of energy-aware CNC milling.
Journal of Intelligent Manufacturing. 2016. DOI: 10.1007/
s10845-016-1233-y
28. Li H, Wang Y, Zhao P, Zhang X, Zhou P. Cutting tool operational reliability prediction based on acoustic emission and logistic regression model. Journal of Intelligent Manufacturing. 2015;26(5):923-931. DOI: 10.1007/s10845-014-0941-4
29. Jurkovic Z, Cukor G, Brezocnik M, Brajkovic T. A comparison of machine learning methods for cutting parameters prediction in high speed turning process. Journal of Intelligent Manufacturing. 2016. DOI: 10.1007/s10845-016-1206-1
30. Ferdosian F, Zhang Y, Yuan Z, Anderson M, Xu C. Curing kinetics and mechanical properties of bio-based epoxy composites comprising lignin-based epoxy resins. European
Polymer Journal. 2016;82:153-165.
31. Joosten MW, Agius S, Hilditch T, Wang C. Effect of residual stress on the matrix fatigue cracking of rapidly cured epoxy/ anhydride composites. Composites Part A: Applied Science
32. Seretis GV, Kouzilos G, Manolakos DE, Provatidis CG. On the graphene nanoplatelets reinforcement of hand lay-up glass fabric/epoxy laminated composites. Composites Part B:
Engineering. 2017;118:26-32.
33. Omrani E, Barari B, Maghadam AD, Rohatgi PK, Pillai KM. Mechanical and tribological properties of self-lubricating bio-based carbon-fabric epoxy composites made using liquid composite molding. Tribology International. 2015;92:222-232.
34. Montgomery DC. Design and Analysis of Experiments. New York: John Wiley & Sons; 2001.
35. Rashmi, Renukappa NM, Suresha B, Devarajaiah RM, Shivakumar KN. Dry sliding wear behaviour of organo-modified montmorillonite filled epoxy nanocomposites using Taguchi's techniques. Materials & Design. 2011;32(8-9):4528-4536.
36. Naghibi S, Sani MAF, Hosseini HRM. Application of the statistical Taguchi method to optimize TiO2 nanoparticles synthesis by the hydrothermal assisted sol-gel technique.
Ceramics International. 2014;40(3):4193-4201.
37. Olivia M, Nikraz H. Properties of fly ash geopolymer concrete designed by Taguchi method. Materials & Design (1980-2015). 2012;36:191-198.
38. Kim KD, Han DN, Kim HT. Optimization of experimental conditions based on the Taguchi robust design for the formation of nano-sized silver particles by chemical reduction method.
Chemical Engineering Journal. 2004;104(1-3):55-61.
39. Mehat NM, Kamaruddin S. Investigating the Effects of Injection Molding Parameters on the Mechanical Properties of Recycled Plastic Parts Using the Taguchi Method. Materials
and Manufacturing Processes. 2011;26(2):202-209.
40. Lu S, Chen D, Wang X, Shao J, Ma K, Zhang L, et al. Real-time cure behaviour monitoring of polymer composites using a highly flexible and sensitive CNT buckypaper sensor. Composites
Science and Technology. 2017;152:181-189.
41. Park SH, Lee CS. The difference in degree of conversion between light-cured and additional heat-cured composites.
Operative Dentistry. 1996;21(5):213-217.
42. Daronch M, Rueggeberg FA, De Goes MF. Monomer conversion of pre-heated composite. Journal of Dental Research. 2005;84(7):663-667.
43. McElroy DL, Weaver FJ, Bridgman C. Thermal expansion of epoxy-fiberglass composite specimens. International Journal
of Thermophysics. 1988;9(2):233-243.
44. Rudd RM, Ghafarian SR, Taherkhani A. The Effects of Post Curing Process on the Mechanical Properties of Glass Fiber/ Phenol -Formaldehyde Molded Composites. Journal of Basic
and Applied Scientific Research. 2013;3(1s):36-39.
45. Dolez P, Marek M, Love BJ. Photopolymerizable acrylic resin: effect of curing time and temperature. Journal of Applied
Polymer Science. 2001;82(3):546-554.
46. Kim H, Char K. Dielectric Changes During the Curing of Epoxy Resin Based on the Diglycidyl Ether of Bisphenol A (DGEBA) with Diamine. Bulletin of the Korean Chemical
Society. 1999;20(11):1329-1334.
47. Wurster DE, Bhattacharjya S, Flanagan DR. Effect of Curing on Water Diffusivities in Acrylate Free Films as Measured via a Sorption Technique. AAPS PharmSciTech. 2007;8(3):E71.
DOI: 10.1208/pt0803071
48. Kozakiewicz J, Rokicki G, Przybylski J, Sylwestrzak K, Parzuchowski PG, Tomczyk KM. Studies on the effect of curing conditions on the curing rate and mechanical properties of moisture-cured poly(urethane-urea) elastomers containing oligocarbonate segments. Polimery Journal. 2011;56(7-8):564-570.
49. Bolasodun B, Nesbitt A, Wilkinson A, Day R. Effect of Curing Method On Physical And Mechanical Properties Of Araldite DLS 772 / 4 4 DDS Epoxy System. International Journal of
Scientific & Technology Research. 2013;2(2):12-18.
50. Hakimian E, Sulong AB. Analysis of warpage and shrinkage properties of injection-molded micro gears polymer composites using numerical simulations assisted by the Taguchi method.
Materials & Design. 2012;42:62-71.
51. Quiroga A, Marzocchi V, Rintoul I. Influence of wood treatments on mechanical properties of wood-cement composites and of Populus Euroamericana wood fibers. Composites Part B:
Engineering. 2016;84:25-32.
52. Hoffman JIE. Biostatistics for Medical and Biomedical
![Figure 2. Layer sequence and fabric orientation on the tested [0º/45º/-45º/0º] T laminates.](https://thumb-eu.123doks.com/thumbv2/123dok_br/16312222.718487/3.765.63.714.859.959/figure-layer-sequence-fabric-orientation-tested-º-laminates.webp)