Genetic Stratigraphy of Key Demographic
Events in Arabia
Verónica Fernandes1,2,3, Petr Triska1,2,4, Joana B. Pereira1,2,3, Farida Alshamali5,
Teresa Rito2, Alison Machado2, Zuzana Fajkošová2,6, Bruno Cavadas1,2, ViktorČerný6,
Pedro Soares2, Martin B. Richards3,7☯, Luísa Pereira1,2,8☯
*
1Instituto de Investigação e Inovação em Saúde, Universidade do Porto, Porto, Portugal,2Instituto de Patologia e Imunologia Molecular da Universidade do Porto (IPATIMUP), Porto, Portugal,3School of Biology, Faculty of Biological Sciences, University of Leeds, Leeds, United Kingdom,4Instituto de Ciências Biomédicas da Universidade do Porto (ICBAS), Porto, Portugal,5General Department of Forensic Sciences and Criminology, Dubai Police General Headquarters, Dubai, United Arab Emirates,6Archaeogenetics Laboratory, Institute of Archaeology of the Academy of Sciences of the Czech Republic, Prague, Czech Republic,7Department of Biological Sciences, School of Applied Sciences, University of Huddersfield, Huddersfield, United Kingdom,8Faculdade de Medicina da Universidade do Porto, Porto, Portugal
☯These authors contributed equally to this work.
*lpereira@ipatimup.pt
Abstract
At the crossroads between Africa and Eurasia, Arabia is necessarily a melting pot, its peoples enriched by successive gene flow over the generations. Estimating the timing and impact of these multiple migrations are important steps in reconstructing the key demographic events in the human history. However, current methods based on genome-wide information identify admixture events inefficiently, tending to estimate only the more recent ages, as here in the case of admixture events across the Red Sea (*8–37 generations for African input into
Ara-bia, and 30–90 generations for“back-to-Africa”migrations). An mtDNA-based founder analy-sis, corroborated by detailed analysis of the whole-mtDNA genome, affords an alternative means by which to identify, date and quantify multiple migration events at greater time depths, across the full range of modern human history, albeit for the maternal line of descent only. In Arabia, this approach enables us to infer several major pulses of dispersal between the Near East and Arabia, most likely via the Gulf corridor. Although some relict lineages sur-vive in Arabia from the time of the out-of-Africa dispersal, 60 ka, the major episodes in the peopling of the Peninsula took place from north to south in the Late Glacial and, to a lesser extent, the immediate post-glacial/Neolithic. Exchanges across the Red Sea were mainly due to the Arab slave trade and maritime dominance (from*2.5 ka to very recent times), but had
already begun by the early Holocene, fuelled by the establishment of maritime networks since*8 ka. The main“back-to-Africa”migrations, again undetected by genome-wide dating
analyses, occurred in the Late Glacial period for introductions into eastern Africa, whilst the Neolithic was more significant for migrations towards North Africa.
OPEN ACCESS
Citation:Fernandes V, Triska P, Pereira JB, Alshamali F, Rito T, Machado A, et al. (2015) Genetic Stratigraphy of Key Demographic Events in Arabia. PLoS ONE 10(3): e0118625. doi:10.1371/journal. pone.0118625
Academic Editor:Gyaneshwer Chaubey, Estonian Biocentre, ESTONIA
Received:August 1, 2014
Accepted:January 21, 2015
Published:March 4, 2015
Copyright:© 2015 Fernandes et al. This is an open access article distributed under the terms of the
Creative Commons Attribution License, which permits unrestricted use, distribution, and reproduction in any medium, provided the original author and source are credited.
Data Availability Statement:All whole-mtDNA sequences generated in this work are available in GenBank database, accession numbers KP316996-KP317078.
Introduction
The issue of admixture in human populations is normally addressed by genome-wide (GW) studies, and several approaches have been developed to date admixture events [1,2,3,4,5]. Ad-mixed populations bear chromosomes with segments of DNA from all contributing source groups, the size of which decreases over successive generations until recombination renders them undetectably short. Several algorithms attempt to date admixture events by inferring the size of the nuclear ancestry segments, and these can work well when dating recent episodes in human history, such as the sub-Saharan African input into the New World [6], but they fail to detect several known episodes that took place at earlier times, such as the African input into Iberia [1] and genetic exchanges across the Red Sea [7]. Simulations with the suite of methods available at the ADMIXTOOLS package indicated that these methods could detect admixture events as early as 500 generation ago, but real data did not allow the tracing of such old events [8]. A recent improved algorithm, called GLOBETROTTER, has been used to tackle the detec-tion of the co-occurrence of several mixture events by decomposing each chromosome into a series of haplotypic chunks and then analysing each chunk independently [3], but the problem of detecting ancient events remains. Its application to the systematic screening of worldwide admixture events was able to reveal around 100 events, but all occurring over only the past 4,000 years [3].
The uniparental markers, characterised by the absence of recombination, do make possible the inference of ancestry for the mitochondrial genome and non-recombining, male-specific portion of the Y chromosome (mtDNA and MSY, respectively), and the dating of some demo-graphic events (those which leave a signature in the genealogy), provided that a mutation rate of these molecules is reliably established. For the mtDNA, in the last couple of years, the appli-cation of various methods has led to quite reliable mutation rates with which to convert genetic diversities into time [9,10], while the MSY remains prone to more uncertainty [11], although promising advances are being achieved with whole Y chromosomal mutation rate calibrations [12,13,14].
At the same time, it is important to emphasize that the age of an mtDNA haplogroup can-not be directly associated with a migration event, as the diversity that has arisen in the source population, predating the migration event, would be included in the measurement. Founder analysis is an attempt to overcome this limitation. This approach picks out founder sequence types in potential source populations and dates lineage clusters deriving from them in the set-tlement zone of interest. In a way, the founder analysis allows us to reconstruct the stratigraphy of the migration events responsible for making up a population genetic pool, analogous to the archaeological reconstruction of the history of a site by the analysis of its sequential layers [15,16,17,18].
Some authors have been critical of dating migration events solely based upon the mtDNA evidence, arguing that maternal lineages do not necessarily represent the entire population, and are especially sensitive to drift [19]. Nevertheless, mtDNA-based conclusions for many mi-grations across various regions of the globe have been subsequently supported by genome-wide results [20,21], despite the limitations of the latter in dating events. In fact, the genealogical ap-proach taken for mtDNA may overcome the effects of drift more effectively than the use of ge-nome-wide SNPs, as we recently demonstrated in the highly-drifted Ashkenazi population: the fine characterisation of mtDNA sequences provided a detailed reconstruction of the maternal Ashkenazi pool, indicating that at least 80% of the lineages had a deep European ancestry [22], an influence not so readily identified in worldwide PCAs based on genome-wide data [23]. Thus, we suggest that for high time-depths, the mtDNA remains at present the most
Genetic Stratigraphy of Key Demographic Events in Arabia
317184. The authors also thank the Leverhulme Trust (research project grant 10 105/D) (to M.B.R.) and the DeLaszlo Foundation (to M.B.R./P.S.) for support. The Instituto de Patologia e Imunologia Molecular da Universidade do Porto is an Associate Laboratory of the Portuguese Ministry of Science, Technology, and Higher Education and is partially supported by FCT. VČwas supported by the Grant Agency of the Czech Republic (Grant no. 13–37998S-P505). The funders
had no role in study design, data collection and analysis, decision to publish, or preparation of the manuscript.
informative genetic system with which to infer past migrations and estimate their time frames, allowing us to disentangle the palimpsest that results from the impact of successive migrations. Several distinct disciplines, including climatology, archaeology and genetics, are beginning to suggest that Arabia featured a highly dynamic genetic pool over time, since its successful set-tlement at*60 thousand years ago (ka) during the out-of-Africa dispersal [16,24]. The Arabi-an Peninsula was exposed to several climate chArabi-ange episodes, with fluctuations between arid (leading to population contraction) and humid (population expansion) phases, which condi-tioned its role as a bridge connecting Africa with Eurasia [25,26].This bridge may have been limited, over long periods or in climatically unfavourable times, to three refuge areas: the Red Sea coastal plain; the Dhofar and Mahra Mountains and adjacent littoral zone in Yemen and Oman; and the emerged floodplain within the Persian Gulf basin [27]. In particular, the latter
“Gulf Oasis”may have been fundamental for the survival during arid conditions of the ancient N(xR) mtDNA lineages coalescing at*60 ka found in Arabia [24], most likely the relicts of the first migrants; the Gulf was also a preferential contact bridge with the Fertile Crescent.
Since these relict lineages are very minor, however, this signal for the settlement of Arabia during the successful out-of-Africa migration does not clarify if it was a continuous process lasting to the present day. The Pleistocene to Holocene continuityversusdiscontinuity debate has centred on how far the Arabian population was made up from the producers of the Levan-tine Pre-Pottery Neolithic B (PPNB)-related industry [28]. After rather sparse Late Palaeolithic settlement, the archaeological evidence suggests a significant increase in sites throughout Ara-bia dating from 9–8 ka [29], but it remains unclear if these were the result of newly arrived peo-ple [30] or locals who adopted the new food-producing technology [31]. The scarcity of secure stratigraphic reconstructions in the archaeology of the Peninsula has contributed to the uncer-tainty in dating the major demographic events. We have shown that some of the most frequent South Arabian mtDNA lineages (such as R0a) display signs of introduction and expansion in the post-glacial period [32], thus pre-dating the Neolithic, although the global contribution of this period to the total Arabian maternal gene pool remains to be evaluated.
However, the subsequent characterisation of other Arabian populations, including Yemen and Oman [42,43,44,45,46,47], did not reproduce the high frequency of this mtDNA lineage in South Arabia.
In this work, we use mtDNA to provide a detailed stratigraphic characterisation of key de-mographic events in Arabia since the first successful out-of-Africa migration*60 ka. We per-formed mtDNA founder analysis for Arabia and neighbouring regions, aiming to ascertain and date the main dispersal episodes. The founder analysis was applied to the unbiased HVS-I data-base available for the region, and interpreted in the light of the more precise dating information gathered from whole-mtDNA sequences of informative haplogroups [24,32,47,48]. We also updated the phylogenetic trees of haplogroups J, T, L4 and L6, by performing 83 new whole-mtDNA sequences. We further tested our inferences from the HVS-I based founder analysis with a whole-mtDNA founder analysis using haplogroups J and T. The mtDNA information is put in perspective with results from genome-wide analyses of published data [3,23,49,50], fo-cused for the first time on inferring the local Arabian population structure, which has been overlooked in the worldwide context of previous autosomal work.
Results/Discussion
Continuity of Pleistocene/Holocene settlement
Previous work has already provided genetic evidence for the exchange of lineages between the Near East and Arabia. This was confirmed with whole-mtDNA sequencing of the Eurasian macrohaplogroup N (including its branches X, I, W, N1a, N1b and some R lineages), which is dominant in Arabia, attaining a frequency of 66%–83% [24,32,47,48]. The obvious missing ele-ment in those studies was the whole-mtDNA sequencing of Arabian JT lineages, which we have performed here, providing a detailed phylogeographic analysis in Supplemental Material (outline topology inS1andS2Figs.;S1 Text). Following the pattern for the remaining N line-ages, the frequency and diversity maps (S3,S4,S5,S7,S12,S13,S16andS19Figs.;S3andS4
Tables) of JT lineages, displaying similarity across the Near East and Arabian Peninsula, as well as the many basal Arabian lineages (S8,S9,S10,S11,S14,S15,S17,S18,S20,S21,S22andS23
Figs.), suggest that both regions were in close contact throughout the late Pleistocene and Holo-cene. Haplogroup J assumes a more important role in Arabia overall than haplogroup T, as tes-tified by frequencies (between 7.7–20.6% and 3.2–10.2%, respectively) and the many star-like J sub-clades observed in Arabia, dating to*6–7 ka. These expansions in haplogroup J are re-flected in the BSP analysis (S6 Fig.), for which the main increase in effective size was between 8–12 ka in Arabia (S6A Fig.), after the expansion observed in the Near East around 11–15 ka (S6B Fig.). Haplogroup J also shows signs of having crossed into eastern Africa, particularly the sub-clade J1d1a1, necessarily after its emergence in Arabia at*7.1 ka (S14 Fig.). Thus hap-logroup JT indicates that demographic expansion in Southwest Asia was a continuous phe-nomenon from the Late Glacial period to the Neolithic period.
In order to dissect the apparent continuous genetic exchange between Arabia and the Near East since the late Pleistocene, we performed a founder analysis for all Eurasian haplogroups assuming the Near East, Iran and Pakistan as source and Arabia as sink (identified founders re-ported inS6andS7Tables).Fig. 1Adisplays the overall pattern, which seems to favour the pe-riods around 1ka, 10 ka and 16 ka for migrations. Based on this information, we further imposed these dates as migration events to represent broadly, respectively, recent events, the Younger Dryas/Neolithic transition and the Late Glacial period. The results indicate that the Late Glacial period (Fig. 1B) was the most important migratory period, responsible for the in-troduction of 40–54% of the lineages (mainly belonging to the haplogroups K, U2, U3, U4, N1a1a, N1a1b, H5 and HV1;S24andS25Figs. and detailed description inS1 Text). At the
Younger Dryas/Neolithic boundary, 34–41% of lineages, mainly unclassified HV, R0a, J1b, T1a and M1 migrated to Arabia. The remaining 12–19% moved very recently,*1 ka, and consists of derived lineages, (including J1d1a, K1, HV8 and N1a3). Although it is hard to discriminate clearly between the Near Eastern and Pakistan/Iranian influences, due to their largely shared mtDNA pool, the results suggest a higher Pakistan/Iranian impact in the east (41%) than in the west (25%) of Arabia for private founders, but just 14% and 11%, respectively, when consider-ing the overall pool. This seems to indicate that the Pakistan/Iranian contribution was recent, Fig 1. Founder analysis results.Probabilistic distribution of founder clusters across migration times, with time scanned at 200 year intervals from 0–60 ka, usingf1(blue line) andf2criteria (red line), when considering putative migrations: (A) from the Near East, Iran and Pakistan to Arabia; (C) from Africa into Arabia plus the Near East and Iran; (E) Arabia plus the Near East and Iran into eastern Africa; (G) Arabia plus the Near East and Iran into North Africa; and probabilistic proportion of founder clusters considering different migration events, usingf1(blue bar) andf2criteria (red bar), when considering putative migrations: (B) from the Near East, Iran and Pakistan to Arabia; (D) from African into Arabia plus the Near East and Iran; (F) Arabia plus the Near East and Iran into eastern Africa; (H) Arabia plus the Near East and Iran into North Africa.
as the lineages introduced from this region did not reach high frequencies, and as expected its impact was higher in the eastern Arabian countries.
We next tested the robustness of the founder analysis by using whole-mtDNA genomes and HVS-I from haplogroups J and T alone (Fig. 2). The 17 whole-mtDNA founders identified (S8 Table) contributed to the overall pattern of migration displayed inFig. 2A, which displays two main peaks, at 1 ka and 10 ka. When imposing the model of three migrations (Fig. 2B), 30% of JT lineages were introduced at 1ka, 50% at 10ka and 20% at 16ka. These results match closely the inferences based only on HVS-I information (Fig. 2C,D).
We should emphasize that no one-to-one correspondence of founder types between whole-mtDNA genomes and HVS-I can be expected, as there is no such precise correspondence be-tween the whole-mtDNA and HVS-I trees, due in part to the differences in resolution but also no doubt to the small samples size at present for the whole-mtDNAs. We must also beware that other factors may also confound the analysis in particular circumstances. An extreme—
but very unusual—instance is haplogroup J1d1a. Here, the HVS-I based founder analysis dates the founders to 1.0 ka, while the whole-mtDNA analysis indicates that it expanded in Arabia at least 6.1 ka. This discrepancy is due to 18 HVS-I sequences belonging to the root haplotype largely from central Saudi Arabia, an artefact of the sampling location (central Saudi Arabia is extremely arid and has had historically very low population size, with habitation restricted to oases, undoubtedly leading to severe genetic drift), while the remaining more diverse samples are from Yemen (as for most of the whole-mtDNAs). If the Saudi samples are disregarded, aρ
estimate for the founder age in Arabia increases to*6–7 ka, fitting more closely with the whole-mtDNA result. Allowing for such inevitable noise effects from the datasets, the similari-ty between the whole-mtDNA and HVS-I analyses is indeed striking, and we conclude that it is reasonable to infer that the picture suggested by the whole-population HVS-I founder analysis is not giving a very misleading impression of the dispersal history of the region.
Fig 2. Founder analysis results on JT lineages.Probabilistic distribution of founder clusters across migration times, with time scanned at 200 year intervals from 0–60 ka, usingf1(blue line) andf2criteria (red line), when considering putative migrations from the Near East, Iran and Pakistan to Arabia for (A) whole-mtDNA genomes or (C) HVS-I for haplogroups J and T; and probabilistic proportion of founder clusters considering different migration events, usingf1(blue bar) andf2criteria (red bar), when considering putative migrations from the Near East, Iran and Pakistan to Arabia for (B) whole-mtDNA genomes or (D) HVS-I for haplogroups J and T.
doi:10.1371/journal.pone.0118625.g002
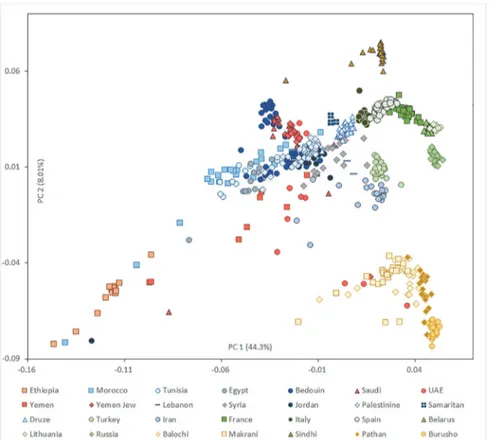
Although it is not possible to date securely events as old as the ones occurring in the Pleisto-cene/Holocene transition based on genome-wide data alone, it is interesting to observe how the patterns of shared genome-wide ancestry support the inferences made for the mtDNA. All the Arabian populations form a close group with Near East populations in PC analysis (Fig. 3), with the first component explaining 44% of the diversity and partitioning populations along a west–east axis, and the second component explaining 8% and organising populations on a north–south axis. A few individuals in Arabian populations most probably had recent ancestry within Africa (especially for Yemen) or Pakistan (in the United Arab Emirates; UAE). Yemen shows the highest dispersion along the first axis, testifying again the higher African input in the closest country to the Horn of Africa. We confirmed the clustering of Yemeni Jews with Bedou-in and Saudi Arabians, already identified previously [23], and probably indicating that they were less open to recent admixture with non-Arabian populations than their Yemeni Arab/ Muslims neighbours.
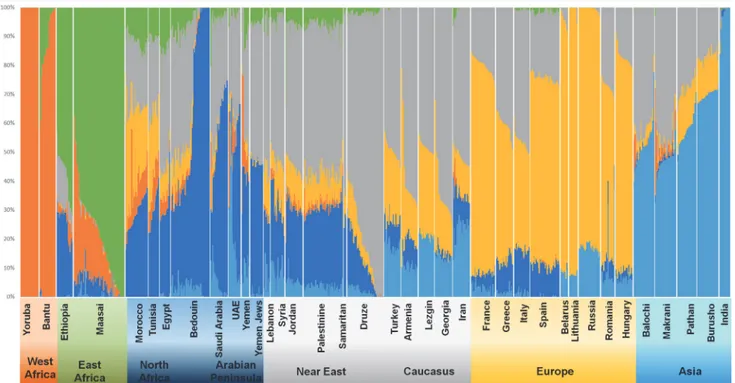
The ADMIXTURE results indicate that K = 6 (Fig. 4andTable 1; other K plots are displayed inS38 Fig.) is the number of clusters that best represents the population structure of the ana-lysed populations. Here it is already possible to distinguish between a Southwest Asian/Cauca-sian and an Arabian/North African component; these two components have similar
proportions of*30% each in Yemen and UAE, but the Arabian/North African proportion in-creases to 52–60% in Saudi and Bedouin. In Near Eastern populations, correspondingly, the Southwest Asian/Caucasian component rises to*50% and the Arabian/North African cluster decreases to*20–30%, even in Palestinians (similar to the Samaritans and some of the
Fig 3. PCA results.Scatter plot of individuals, showing the first two principal components. Each symbol corresponds to one individual and the colour indicates the region of origin.
Druze), highlighting their primarily indigenous origin, with the most extreme values for the Druze, carrying the Southwest Asian/Caucasian component at*80%.
European background is higher in Near Eastern populations (around 9–15%) than in Arabia (1.5–5%) while the African ancestry is*25% in Yemen, and then 4–8% in all Arabian and Near East populations except in Samaritans and Druze, with 0–2%. The UAE has a substantial pool from South Asia (21%) similar to the proportion displayed in Iran (24%), which falls to below 10% in all other Arabian and Near Eastern populations, except Turkey (18%).
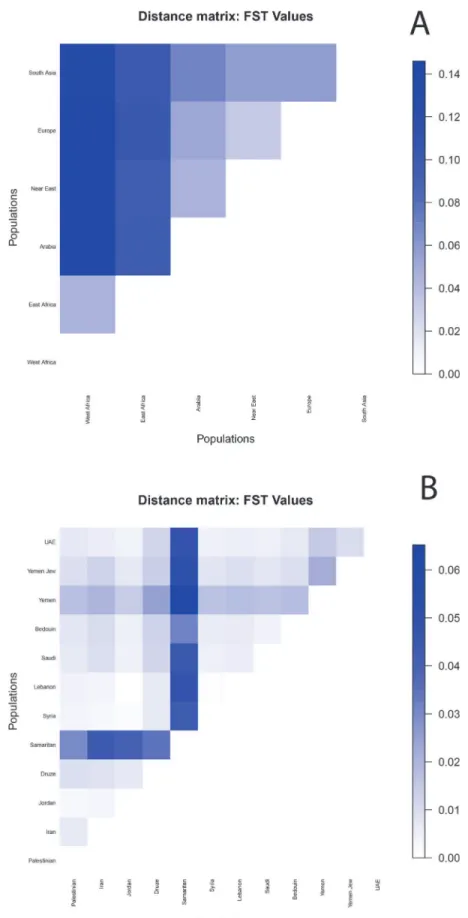
ADMIXTURE allows us to calculateFSTvalues between the components in order to quanti-fy their similarity (Fig. 5A). For K = 6, Arabia showed a lower distance from the Near East (0.046), than from Europe (0.052), eastern Africa (0.098) and finally western Africa (0.140). Arabia and the Near East have similar genetic distances from eastern African (0.098 and 0.097, respectively), double that of the value between western and eastern Africa (0.046). When evalu-atingFSTvalues in pairwise comparisons between Arabian and Near Eastern populations (Fig. 5B), we see thatFSTvalues are higher between Yemen and all other populations (and also for comparisons with Samaritans, but these results may be biased by low sample size). The UAE is closer to Jordan, Syria and Lebanon than Saudi Arabia is; while Saudi are closer to Palestinians, Druze and Samaritans than UAE. Thus,FSTvalues support lower or similar genet-ic distances between UAE and Near Eastern populations as between Saudi and Near Eastern populations, while Yemen is clearly more divergent.
Exchanges across the Red Sea
—
from Africa into Arabia
Founder analysis of the dispersal of sub-Saharan lineages from Africa into Arabia plus the Near East and Iran (both regions have to be considered together due to the relatively low num-ber of L(xMN) sequences) showed a predominant migration peak at 0–0.8 ka (Fig. 1C). When Fig 4. ADMIXTURE results.Population structure inferred by ADMIXTURE analysis. Each individual is represented by a vertical (100%) stacked column of genetic components proportions shown in colour for K = 6.
doi:10.1371/journal.pone.0118625.g004
checking these founders (S9andS10Tables), we see that most of them display clearly young ages, but several have ages*13 ka (S15 Table). So, we tested a model based on three periods of migration (Fig. 1D), and their impact was: 31–40% for 1 ka (middle of Arab slave trade, 6th–
Table 1. Estimates of admixture proportions (%) and date of admixture (in generations) calculated in ROLLOFF when using western (Yoruba) and eastern (Maasai) African and Italians + Spanish as ancestral populations.
Population Sample Size Western African ancestry proportion (%)± standard error Eastern African ancestry proportion (%)± standard error Southwest Asian/ Caucasian ancestry proportion (%)± standard error Arabian/ North African ancestry proportion (%)± standard error European ancestry proportion (%)± standard error South Asian ancestry proportion (%)± standard error Estimated date of admixture using ROLLOFF using Western African parental population Estimated date of admixture using ROLLOFF using Eastern African parental population
Yemen 9* 16.935±
15.960 7.747± 5.333 30.777± 9.896 32.398± 6.030
3.217±2.77 8.926± 3.727 21.019± 7.450 11.556± 3.878 Saudi Arabia
20 1.694±
5.223 4.033± 4.235 34.227± 8.955 52.479± 18.957 2.722± 3.879 4.844.± 4.975 30.762± 4.907 25.430± 3.011 Yemen Jews
15 0.001±
0.000 5.105± 0.826 47.542± 1.525 45.693± 1.598 0.565± 0.699 1.094± 1.187 n/a n/a
UAE 14 6.408±
9.118 1.817± 2.014 34.432± 4.312 34.378± 21.632 1.689± 1.931 21.276± 17.660
8.900±1.642 8.923±1.795
Bedouin 45 2.005±
2.213 4.692± 4.246 24.903± 19.909 60.057± 30.707 5.400± 4.700 2.944± 2.285 37.546± 3.104 27.734± 1.532
Lebanon 7 1.243±
4.854 4.670± 3.148 51.547± 2.519 21.092± 4.062 14.543± 2.791 6.905± 4.854 n/a n/a
Syria 16 1.586±
1.451 3.413± 1.952 49.742± 4.880 23.260± 5.283 12.864± 4.532 9.135± 3.387 37.334± 4.365 26.181± 4.428
Jordan 20 3.205±
5.629 7.289± 6.404 47.833± 7.442 25.055± 3.209 11.171± 2.436 5.447± 2.169 32.871± 4.106 29.470± 3.671 Samaritan 3 0.001±
0.000 0.190± 0.777 63.029± 2.282 26.358± 2.709 8.946± 4.104 0.475± 0.496 n/a n/a
Druze 42 0.178±
0.365
1.869± 1.082
80.100± 14.498
9.919±7.730 6.123± 5.089
1.812± 1.664
n/a n/a
Palestinian 46 2.222± 1.760 6.119± 2.147 51.538± 4.397 27.396± 2.153 9.153± 1.826 3.572± 1.302 29.008± 2.194 11.556± 3.878
Iran 20 1.701±
3.196 1.022± 1.818 50.678± 4.259 11.850± 5.614 11.135± 2.916 23.614± 3.944 n/a n/a
Turkey 19 0.069±
0.029
0.194± 0.312
49.188± 3.258
8.993±2.904 23.798± 3.503
17.758± 2.504
n/a n/a
Ethiopia 19 3.911± 3.047 58.139± 8.479 12.146± 5.638 25.469± 5.495 0.179± 0.442 0.157± 0.297 93.223± 9.678 n/a
Maasai 19 15.808±
12.911
78.060± 15.009
0.412±0.911 4.120±3.043 0.096± 0.315 0.736± 1.858 47.007± 2.933 n/a
Egypt 12 5.553±
1.553 15.117± 4.878 39.826± 5.130 30.499± 6.343 8.380± 2.245 0.624± 0.630 30.034± 3.233 22.766± 2.890 Morocco 25 12.199±
10.473 12.066± 2.951 21.360± 4.827 28.872± 5.736 25.502± 7.971 0.001± 0.000 n/a n/a
Tunisia 12 9.815±
2.927 10.437± 1.212 26.002± 4.057 30.991 + 6.178 22.754± 5.354 0.001± 0.000 n/a n/a
N/A—not assigned.
*By eliminating one individual with a high level of African ancestry.
Fig 5. Matrices ofFSTdistances.Matrices ofFSTvalues between ADMIXTURE components (A) and Arabian and Near Eastern populations (B).
doi:10.1371/journal.pone.0118625.g005
19thcenturies); 38% for 2.5 ka (Arabian dominance of the Red Sea trade routes); and 22–31% for 13ka (close to the Younger Dryas). As the great majority of lineages migrated in the two very recent putative events, at similar ages, this contributes to the dominant young peak in
Fig. 1C, while the approximately one-third of sequences that were introduced later is responsi-ble for the long tail of the curve (instead of a sharper peak). No clear pattern of association be-tween haplogroup and event was observable, probably reflecting high levels of heterogeneity in the source (S32andS33Figs. and detailed description inS1 Text). Thus, the Arabian maritime dominance and slave trade (from very recently, back until*2.5 ka) were the main contributors (*69–78%) to the African ancestry into Arabia, Near East and Iran, but the entrance seems to have been initiated as early as the end of the Pleistocene. Clearly, no lineages could be assigned to the out-of-Africa migration event.
In order to provide more information to the issue of possible relicts of the out-of-Africa mi-gration, we further investigated two relatively rare African haplogroups (L4 and L6), phyloge-netically close to L3, by whole-mtDNA sequencing (outline topology inS26 Fig.and detailed topology inS28,S29andS30Figs.;S1 Text). L4 is more frequent nowadays in eastern Africa followed by the Near East (S27A Fig.;S5 Table). The whole-mtDNA-based date points to an origin at*87 ka, predating the out-of-Africa dispersal (as well as its sub-clade, L4b, dating
to*86 ka). So, in theory, this sister haplogroup of L3 could have crossed into Arabia along
with L3 during the initial out-of-Africa movement. Phylogenetically, however, the few Arabian L4 lineages are derived, supporting an explanation in more recent exchange networks between eastern Africa and Arabia for their dispersal, concordant with the recent signs of population growth detected for L4 in BSPs (S31A Fig.; and dominating alsoS31B Fig.;S14 Table). L6, at similarly low frequencies in Yemen and eastern Africa (S27B Fig.), dates to 23.1 [15.8–30.5] ka, and is likely to have migrated from eastern Africa into Arabia after that period, most probably very recently as testified by a very derived L6a sub-clade observed in three Yemenis (sharing the same lineage).
The genome-wide analyses performed here on the available data from Arabian populations provide estimates of African admixture, with disentanglement between western and eastern Af-rican gene pool contributions (Table 1). The eastern African background is around 4.0% in Saudi and Bedouin,*7.7% in Yemen (although Yemen Jews have a lower admixture of 5.1%), and 1.8% in UAE; this input decreases beyond Jordan, and is negligible in Samaritans, Druze, Turks and Iranians. The western African component also varies between 2.0 and 6.4%, except for Yemen (16.9%) where it has likely been inflated due to indirect recent migration (the Bantu component which is present in many eastern African populations). The ROLLOFF estimates for the event of admixture were 8–27 generations ago when using eastern Africa as parental population, and 8–37 generations using a western African source.
Both date estimates are compatible with the Arab slave trade, which operated between the 6th and 19th centuries AD, mainly from eastern Africa (from Nubia to Zanzibar), although many of these populations bear a significant western African component (as shown inFig. 4). These values are in agreement with the estimates of Moorjani et al. [1] for Levantine groups, showing a 4–15% African ancestry and about 32 generations ago for the event of admixture, in-terpreted as consistent with close political, economic, and cultural links with Egypt in the late Middle Ages. They also estimated 72 generations ago for the event leading to 3–5% sub-Saha-ran ancestry in diverse Jewish populations, arguing that this reflecting descent of these groups from a common ancestral population that already had some African ancestry prior to the Jew-ish Diaspora.
more distinct episodes of African admixture in the Horn of Africa: they identified a non-African Ethio-Somali component in eastern non-African populations in the ADMIXTURE analysis for whichFST-based dating methods indicated an age of divergence from North African/Arabi-an populations of 23–25 ka, leading to a possible window of migration pre-LGM. These results fit well with the conclusions we reached in this study through the analysis of the maternal mtDNA pool.
Exchanges across the Red Sea
—
from Arabia into Africa
The Bab-el-Mandab strait and the Red Sea were also important for dispersal in the opposite direction, the“back-to-Africa”migrations. Founder analysis (Fig. 1E;S11andS12Tables) led to the identification of peaks of migration at*10–15 ka. Given these results, we inferred two main migration events, at*10 ka (representing the Neolithic and beginning of maritime trade) and at*16ka (Late Glacial period), as well as an episode at*2 ka which could repre-sent recent times (specifically, Arabian dominance of the Red Sea routes). The proportions (Fig. 1F) for migration contributed by these events were: 14–31% at*2 ka (for N1, R0a, T, J, K and X); 33–36% at*10ka (U6a1a, J1d1a, M1 and R0a); and 33%–54% at*16ka (M1 and HV1). A detailed analysis of these haplogroup distributions in the migration events is provided inS1 Text,S34andS35Figs.
Interpreting these results in the light of available whole-mtDNA sequences, only the intro-duction of N1 seems younger than expected, most probably due to lack of HVS-I resolution for this haplogroup. Two main founders (comprising haplogroups N1a and I) are at the root of N1 sub-clades (dating to 15.9 and 21.8 ka, respectively). Another founder in N1a could be placed in the sub-clade identified in the whole-mtDNA sequencing from Somalia reported by Fer-nandes et al. [24], bearing the substitution at position 16213; but the HVS-I data show that this is more frequent in Africa (seven individuals) than in Arabia (one individual), so this Arabian individual may be a recent introduction into Arabia of an N1a sub-clade that had evolved with-in Africa (datwith-ing to 0.9 ka [24]).
The phylogenetic analyses for N(xR) lineages performed by Fernandes et al. [24] also pro-vided insights into back-to-Africa movements, evidently at various time periods. Some lineages (I, N1a and N1f) displayed deep branches in eastern Africa, a sign of introduction in Africa which could have begun as early as*40 ka (the upper bound defined by the TMRCA of the founder clades) and extending till*15 ka (the lower bound defined by the TMRCA of the de-rived African clades). The migration of J1d1a lineages into eastern Africa in the Neolithic peri-od is confirmed in the whole-mtDNA sequencing (S14 Fig.) and complemented by the frequency interpolation and founder analysis (S13 Fig.) performed here.
From the genome-wide results, we can infer this back-to-Africa migration was considerable, leading to a proportion of 12% of Near Eastern and 26% Arabian ancestry in Ethiopia
(Table 1). The ROLLOFF estimate for the date of admixture was 93 generations ago—twice as old as the time of African admixture in Arabia and Near East. For comparison, in the Maasai from Kenya and Tanzania, the Eurasian component is an order of magnitude lower (4.5%), and the time of admixture is 47 generations, reflecting most probably later admixture events.
The parallel introduction of Eurasian lineages from the Near East, Iran and Arabia into North Africa through the Sinai Peninsula revealed two well-defined peaks (Fig. 1G) at*2.4 ka and 6.8 ka with thef1criterion, and two peaks at*9.0 ka and*12.4 ka when using thef2 cri-terion. This seems to point to a significant role for dispersal in the Neolithic period, consistent with results obtained for the North African MSY pool, interpreted as suggesting a large Neo-lithic origin [51]. A major Neolithic impact is supported when imposing periods for the migra-tion of founders (Fig. 1H), leading to: 7–16% at*2 ka, mainly HV1 and other undefined HV
lineages, M1 and U (U6a1, K1a1); 52–58% at*10 ka for most of HV, U (U5b, U5 and K), T (some T2c1 and T2b), J (J1d1a, J2a2b and other undefined J), and X; and 26%–41% at*16 ka for some HV, T (T1a, T2) and U (U3, U3a, U5b1b, U5a, U6a) lineages (S1 Text,S36andS37
Figs.). It seems likely that some JT lineages, especially T ones, were introduced into Northeast Africa before the Neolithic, following Late Glacial population expansions in the Near East/Ara-bia. Then, locally they could have been involved in population expansions in the Neolithic peri-od, leading to signs of autochthonous founder effects, such as the one detected in the El-Hayez oasis (400 km southwest of Cairo) for sub-haplogroup T1a2a [52].
The link between U6 and M1 and the settlement of North Africa from the Near East at
*45 ka advanced previously [53,54] was recently put into question [55] because their
sub-clades do not all seem to display the same history: U6a is*10 ka older than M1a and M1b, and sub-clades of the former coalesce before or around the LGM while sub-clades of the latter date to the post-LGM. In our founder analysis for North Africa, a strong Late Glacial signal was detected for U6.
At the genome-wide level, Egypt is quite similar to its Levantine neighbours, displaying a mainly Near Eastern (39.8%) and Arabian/North African (30.5%) background, with slightly higher western (5.6%) and eastern (15.1%) African proportions, and lower European (8.4%) and South Asian (0.6%) proportions. The ROLLOFF estimate for admixture in Egypt (using Africans and Europeans as ancestral populations) was 30 generations, predictably young due to continuous gene flow between the two regions. Morocco and Tunisia presented similar west-ern (9.8–12.2%) and eastern African (10.4–12.1%) components and roughly twice the magni-tude for each of the European (22.8–25.5%), Near Eastern (21.4–26.0%) and Arabian (28.9–
31.0%) pools. Again these young dates show that simple genome-wide dating approaches based on linkage disequilibrium decay must be applied cautiously in complex scenarios of sev-eral migrations occurring over a long span of time, such as the ones which took place across the Red Sea, North Africa [56] and Iberia [57].
Conclusions
The detailed evaluation of the Arabian and neighbouring mtDNA pools has allowed us to es-tablish a genetic stratigraphy of Arabia’s maternal line of descent, testifying to the pivotal role of the Peninsula at the crossroads between Africa and Eurasia. The successful out-of-Africa mi-gration led to continuous settlement of parts of the Peninsula, most probably centred on the Gulf Oasis, which likely functioned as the cradle for the emergence of the haplogroup N line-ages. No haplogroup L(xMN) relicts of this migration into Arabia are detected in mtDNA founder analysis and we have confirmed their absence by whole-mtDNA sequencing of line-ages from L3 [16] and its sister clades L4 and L6.
Although it is likely that the Gulf Oasis region eventually formed part of an extended source region together with the Near East, if we assume that the Near East was the main source popu-lation for current Arabian diversity, the Late Glacial period was responsible for the introduc-tion of 40–54% of lineages, the Younger Dryas/Neolithic for 34–41%, and recent times (at 1.0 ka) for the remaining 12–19%. The Neolithic in Arabia was more characterised by the ex-pansion in effective size of local haplogroup N lineages, mostly within R0a and J, than by the entrance of new lineages. Arabia, together with the Near East and Iran, was involved in the
Africa. The biparental genome averaged the African input to 6–25% of the Arabian pool, con-cordant with the 35% female and 0% male inputs estimated from uniparental systems. ROLL-OFF dating of admixture events across the Red Sea suggested recent ages of 8–37 generations for the African input into Arabia, 93 generations for the Arabian/Near Eastern input into east-ern Africa and 30 generations for North Africa.
We conclude by emphasising that different parts of the genome of an admixed population often tell different stories—so the strategy must involve independent evaluation of (large) linked blocks. This is precisely what we do when analysing the diverse mtDNA lineages found in a population, but because mtDNA is a single linked locus, the different stories then emerge from the different lineages, carried by different individuals within a population. Probably, re-gions of the nuclear genome with a low recombination rate will allow estimation of older events, as soon as more complete nuclear genomes are available from more populations, over-coming the limits of molecular resolution of current genome-wide SNPs.
Materials and Methods
Samples for whole-mtDNA sequencing and statistical comparisons
We previously characterised the mtDNA diversity in populations from eastern Africa [16], the Arabian Peninsula [42,46,47], and the African Sahel [58], by sequencing the hypervariable seg-ments I and in some cases II (HVS-I and HVS-II) using a procedure described previously [59]. This information was used to assign mtDNA sequences to haplogroups, following the most up-to-date phylogenetic evidence, reported on the PhyloTree website [60],checking the classifica-tion against the output of the Haplogrep software [61]. We then selected 26 UAE and 31 Yemen samples belonging to haplogroups J and T, and some belonging to haplogroups L4 and L6 for whole-mtDNA sequencing, amounting into a total of 26 (L4: 1 Burkina Faso, 2 Chad, 2 Dubai, 4 Ethiopia, 2 Kenya, 1 Niger, 1 Nigeria, 1 Nubia, 5 Somalia and Sudan; L6: 2 Ethiopia, 1 Kenya and 2 Somalia) (S1 Table).We followed the methodology and quality control procedures of Pereira et al. [62], and mu-tations were scored relative to the revised Cambridge reference sequence [63]. The sequences obtained are reported inS1 Tableand have been deposited in GenBank (accession numbers KP316996-KP317078).
For the whole-mtDNA analyses (S1andS2Tables), we used a total of 1779 samples of JT whole-mtDNA sequences (57 new, 1722 published) and 57 L4/L6 sequences (26 new, 31 pub-lished) in the reconstruction of their phylogenetic trees. We constructed a database of HVS-I and HVS-II sets from African, Arabian, European, Near Eastern, Iranian and Pakistani popula-tions, amounting to 42,485 sequences, for founder analysis; these data are summarised inS6,
S7,S8,S9,S10,S11andS12Tables. By the Arabian Peninsula, we assumed the territory covered by present-day Oman, UAE (which together we sometimes identified as eastern Arabia), Saudi Arabia and Yemen (western Arabia) countries. In the Near East, we included Iraq, Jordan, Isra-el/Palestine, Turkey, Lebanon and Syria.
This study obtained ethical approval from the Ethics Committee of the University of Porto, Portugal (11/CEUP/2011). Written informed consent was obtained from all sampled individu-als, except from illiterate people who provided oral consent and a fingerprint instead of signa-ture. The Ethics Committee approved this procedure.
Statistical analyses of mtDNA data
For the phylogenetic reconstructions, preliminary reduced-median network analyses [64] led to a suggested branching order for the trees, which we then constructed most parsimoniously by hand. We used the mtDNA-GeneSyn software [65] to convert files.
In order to estimate the time to the most recent common ancestor (TMRCA) for specific clades in the phylogeny, we used theρstatistic [18] and maximum likelihood (ML). We usedρ
(the mean sequence divergence from the inferred ancestral haplotype of the clade in question) with a mutation rate estimate for the whole-mtDNA sequence of one substitution in every 3624 years, correcting for purifying selection, and a synonymous mutation rate of one substitu-tion in every 7884 years [66]. Standard errors were estimated as before [67]. We obtained the ML estimates of branch lengths using PAML 3.13 [68], assuming the HKY85 mutation model with gamma-distributed rates (approximated by a discrete distribution with 32 categories). We converted mutational distance in ML to time using the same whole-mtDNA genome clock.
In order to investigate the population demography associated with the different hap-logroups analyzed (J/T and L4/L6), we obtained Bayesian skyline plots (BSPs) [69] from BEAST 1.4.6 [70] for a total of 1720 and 57 (J/T and L4/L6, respectively) whole-mtDNA se-quences with a relaxed molecular clock (lognormal in distribution across branches and uncor-related between them) and the HKY model of nucleotide substitutions with gamma-distributed rates (10 gamma categories). BSPs estimate the effective population size through time using random sequences from a given population, but have also proved effective with individual hap-logroups data [71]. For this analysis, we used a mutation rate of 2.6129 x10⁻⁵, previously
cali-brated using internal calibration points within the L3 phylogeny [16]. BEAST uses a Markov-chain Monte-Carlo (MCMC) approach to sample from the posterior distributions of model pa-rameters (branching times in the tree and substitution rates). Specifically, we ran 100,000,000 iterations, with samples drawn every 10,000 MCMC steps, after a discarded burn-in of
10,000,000 steps. We checked for convergence to the stationary distribution and sufficient sam-pling by inspection of posterior samples. We visualized the Bayesian skyline plots (BSPs) with Tracer v1.3 [69]. We used a generation time of 25 years and forced the larger haplogroups to be monophyletic in the analysis: MCMC updates which violated this assumption were rejected. In order to perform a systematic comparison and description of the increment periods in the ef-fective population size of the BSP, we calculated a rate of population size change through time.
To visualize the geographical distribution of haplogroups J, T, L4 and L6, we constructed in-terpolation maps using the“Spatial Analyst Extension”of ArcView version 3.2 (www.esri.com/ software/arcview/). We used the“Inverse Distance Weighted”(IDW) option with a power of two for the interpolation of the surface. IDW assumes that each input point has a local influ-ence that decreases with distance. The geographic location used is the centre of the distribution area from which the individual samples of each population were collected. The data used are listed inS3,S4andS5Tables.
In order to estimate the times of migrations into and from the Arabian Peninsula, we em-ployed founder analysis [15]. This method assumes a strict division between assumed source and sink populations and two criteria (f1andf2) for identifying founder sequences to partly allow for homoplasy and back migrations, by ensuring that sequence matches are not at the tips of the source phylogeny. Founders must have at least one (f1) or two (f2) derived branches in the source population. The first step is to reconstruct, haplogroup by haplogroup, the HVS-I networks in the range 16051–16400 bp of the reference sequence [63]; we then identified foun-ders and descendants using an in-house computer tool [72]; and finally we estimated the age of the migration of each founder using theρstatistic [18], assuming an HVS-I mutation rate of
one mutation every 16,677 years [66].
inferring the more eastern contribution into the Arabian Peninsula. In order to assess the error in the Bayesian partitioning across the different migration times realistically, we calculated an effective number of samples for each founder cluster. This was obtained by multiplying the number of samples for each founder cluster by a ratio of the variance assuming a star-like net-work and the variance calculated as in Saillard et al. [67].
We scanned the distribution of founder ages for each region, defining equally spaced 200-year intervals for each migration from 0–70 ka. For each case, we also investigated the propor-tion of introducpropor-tion of lineages during putative migrapropor-tions occurring in certain periods of time. We selected these migration events by combining three distinct lines of evidence: the peaks de-tected in the founder analysis; historical/archaeological evidence; and dates from whole-mtDNA sequences belonging to informative haplogroups in the region (such as R0a, JT, N1, N2, I, L3 and L4/L6). We represented the probabilistic proportions of introduction for each lineage at each of the putative migration periods in graphs resembling the images from the STRUCTURE analysis.
In order to further validate the HVS-I founder analysis into Arabia we compared it with the results obtained from a founder analysis using whole-mtDNA genomes belonging to hap-logroups J and T. We only used anf1criterion (since the sampling from the source was too scarce to allow anf2criterion) and we detected 17 founders (S8 Table). The assumptions of the founder method do not allow the use of a time-dependent clock. Therefore, given the relatively small difference between the mutation rate for time zero (average 2562 years for a mutation to happen) and the mutation rate for the oldest founder (average 2667 years for a mutation to happen) we used the intermediate value (2614 years for a mutation to happen) as an estimate for the overall range. As with the HVS-I founder analysis, we performed a preliminary scan analysis and estimated relative contributions of JT lineages in a three-migration model.
Genome-wide database
We assembled genome-wide data for 790 samples from eight geographic groups (sub-Saharan Africa, North Africa, Arabian Peninsula, Near East, Iran, Europe, Caucasus and South Asia) from previously published data sets (S13 Table). The samples from Behar et al. [23] were geno-typed using Illumina the 610K and 660K bead arrays, while those from Li et al. [49] were screened with Illumina 650K bead arrays, and those from Hellenthal et al. [3] with Illumina 660K bead arrays. We obtained the genotypes from Maasai, an ethnic group located in Kenya, from the HapMap phase III release (http://hapmap.ncbi.nlm.nih.gov/). We used PLINK 1.05 [73] to check that individuals and SNPs had a genotyping success of 97%. We used a Python in-house script to merge genotypes from the various chips and ended up with a total of 309,474 common autosomal single nucleotide polymorphisms (SNPs). We pruned the full dataset for linkage disequilibrium (LD), removing SNPs in strong LD (r2>0.4) with nearby markers in a
window of 50 SNPs (advanced by 10 SNPs each time); a total of 215,286 SNPs remained for further analyses.
Genome-wide statistical analyses
We analysed the 790 samples with the ADMIXTURE software [74] which provides a maxi-mum likelihood estimation of the population structure. We tested several numbers of clusters or ancestral populations, K (from three to six), with termination criteria for independent runs for each K value established when the log-likelihood increased by less than 10−4between
itera-tions. We performed across-validation to check the K value with the lowest cross-validation error, which would represent the most accurate modelling choice.
We carried out the principal component (PC) analysis, which infers worldwide axes of human genetic variation from the allele frequencies of various populations, using thesmartpca tool, available in the EIGENSOFT package [75]. We evaluated the statistical significance of each PC through the Tracy-Widom statistics, computed at the EIGENSOFT tooltwstats. As we were focused in Arabia, we did not include all populations in the analysis, especially the west-ern African ones, in order to maximise the resolution.
To estimate the ages of putative admixture events in populations displaying statistical evi-dence of admixture, we used the ROLLOFF method [1] implemented in the ADMIXTOOLS software package [8]. This method is based on the decay of admixture LD in the target popula-tion, performing a local ancestry inference. We ran the ROLLOFF method for Arabia and some Near Eastern populations, using the unpruned set, with Maasai individuals (from the HapMap dataset, selected after the ADMIXTURE analysis, as the ones displaying>80%
east-ern African ancestry) and Italy plus Spain (extracted from 1000 Genomes database;http:// browser.1000genomes.org/index.html) as ancestral populations. We also performed this analy-sis by replacing Maasai by Yoruba, from western Africa, to check for the influence of the select-ed African ancestral population, and as some eastern African populations also have a high western African component (such as Luhya in Webuye, Kenya, in the 1000 Genomes database).
We plotted the correlation between SNPs as a function of genetic distance for all chromo-somes. Ages (in number of generations) were estimated by fitting an exponential distribution to the decay of these correlation coefficients. The estimated age (in number of generations) for the admixture event is the average of dates for all chromosomes. TheFSTvalues between pairs of ADMIXTURE components (K = 6) were estimated using ADMIXTURE, while the ones be-tween pairs of populations were performed using vcf tools (http://vcftools.sourceforge.net/).
Supporting Information
S1 Fig. Schematic tree of haplogroup J.Ages (in ka) indicated are maximum likelihood esti-mates obtained for the whole-mtDNA genome.
(TIF)
S2 Fig. Schematic tree of haplogroup T.Ages (in ka) indicated are maximum likelihood esti-mates obtained for the whole-mtDNA genome.
(TIF)
S3 Fig. Frequency maps based on HVS-I data for haplogroups J (A) and T (B). (TIF)
S4 Fig. Distribution maps for haplogroup J for the diversity measuresπ(A) andρ(B) based on HVS-I data.
(TIF)
S5 Fig. Distribution maps for haplogroup T for the diversity measuresπ(A) andρ(B) based on HVS-I data.
(TIF)
S6 Fig. Bayesian skyline plot indicating hypothetical effective population size through time based on data from haplogroup J of Arabia (A) and Near East (B) and from haplogroup T of Arabia (C) and Near East (D).
S7 Fig. Frequency maps based on HVS-I data for haplogroups J1b. (TIF)
S8 Fig. Phylogenetic tree of haplogroup J1b.Labels on the branches represent nucleotide po-sitions of tranpo-sitions, and transversions when followed by a suffix“A,” “G,” “C,”or“T”; inser-tions are indicated by a dot followed by the number of repetiinser-tions and the nucleotide position; reversions by“!”; green indicates synonymous, brown non-synonymous, yellow other coding region, and black control region substitutions. Individual identification is indicated as well as the geographic origin when known (geographic regions are grouped by colour code according to the key). Near the nodes, the TMRCA is indicated (mean and 95% confidence interval) forρ
based on whole-mtDNA sequences (in black),ρbased on synonymous diversity (in green) and
for maximum likelihood (in blue). (TIF)
S9 Fig. Phylogenetic tree of haplogroup J1b1.Labels on the branches represent nucleotide positions of transitions, and transversions when followed by a suffix“A,” “G,” “C,”or“T”; re-versions by“!”; green indicates synonymous, brown non-synonymous, yellow other coding re-gion, and black control region substitutions. Individual identification is indicated as well as the geographic origin when known (geographic regions are grouped by colour code according to the key). Near the nodes, the TMRCA is indicated (mean and 95% confidence interval) forρ
based on whole-mtDNA sequences (in black),ρbased on synonymous diversity (in green) and
for maximum likelihood (in blue). (TIF)
S10 Fig. Phylogenetic tree of haplogroup J1b1a.Labels on the branches represent nucleotide positions of transitions, and transversions when followed by a suffix“A,” “G,” “C,”or“T”; re-versions by“!”; green indicates synonymous, brown non-synonymous, yellow other coding re-gion, and black control region substitutions. Individual identification is indicated as well as the geographic origin when known (geographic regions are grouped by colour code according to the key). Near the nodes, the TMRCA is indicated (mean and 95% confidence interval) forρ
based on whole-mtDNA sequences (in black),ρbased on synonymous diversity (in green) and
for maximum likelihood (in blue). (TIF)
S11 Fig. Phylogenetic tree of haplogroup J1b2.Labels on the branches represent nucleotide positions of transitions, and transversions when followed by a suffix“A,” “G,” “C,”or“T”; re-versions by“!”; green indicates synonymous, brown non-synonymous, yellow other coding re-gion, and black control region substitutions. Individual identification is indicated as well as the geographic origin when known (geographic regions are grouped by colour code according to the key). Near the nodes, the TMRCA is indicated (mean and 95% confidence interval) forρ
based on whole-mtDNA sequences (in black),ρbased on synonymous diversity (in green) and
for maximum likelihood (in blue). (TIF)
S12 Fig. Frequency maps based on HVS-I data for lineages within haplogroup J defined by the transition at 16193, which mainly corresponds to haplogroup J1d, but can also include haplogroup J2d.
(TIF)
S13 Fig. Frequency maps based on HVS-I data for the sub-haplogroup J1d1a. (TIF)
S14 Fig. Phylogenetic tree of haplogroup J1d1.Labels on the branches represent nucleotide positions of transitions, and transversions when followed by a suffix“A,” “G,” “C,”or“T”; dele-tions are indicated“d”; reversions by“!”; green indicates synonymous, brown non-synony-mous, yellow other coding region, and black control region substitutions. Individual
identification is indicated as well as the geographic origin when known (geographic regions are grouped by colour code according to the key). Near the nodes, the TMRCA is indicated (mean and 95% confidence interval) forρbased on whole-mtDNA sequences (in black),ρbased on
synonymous diversity (in green) and for maximum likelihood (in blue). (TIF)
S15 Fig. Phylogenetic tree of haplogroup J1d2.Labels on the branches represent nucleotide positions of transitions, and transversions when followed by a suffix“A,” “G,” “C,”or“T”; in-sertions are indicated by a dot followed by the number of repetition and the nucleotide posi-tion; reversions by“!”; green indicates synonymous, brown non-synonymous, yellow other coding region, and black control region substitutions. Individual identification is indicated as well as the geographic origin when known (geographic regions are grouped by colour code ac-cording to the key). Near the nodes, the TMRCA is indicated (mean and 95% confidence inter-val) forρbased on whole-mtDNA sequences (in black),ρbased on synonymous diversity (in
green) and for maximum likelihood (in blue). (TIF)
S16 Fig. Frequency maps based on HVS-I data for haplogroup J2. (TIF)
S17 Fig. Phylogenetic tree of haplogroup J2a2.Labels on the branches represent nucleotide positions of transitions, and transversions when followed by a suffix“A,” “G,” “C,”or“T”; re-versions by“!”; green indicates synonymous, brown non-synonymous, yellow other coding re-gion, and black control region substitutions. Individual identification is indicated as well as the geographic origin when known (geographic regions are grouped by colour code according to the key). Near the nodes, the TMRCA is indicated (mean and 95% confidence interval) forρ
based on whole-mtDNA sequences (in black),ρbased on synonymous diversity (in green) and
for maximum likelihood (in blue). (TIF)
S18 Fig. Phylogenetic tree of haplogroup J2a2a.Labels on the branches represent nucleotide positions of transitions, and transversions when followed by a suffix“A,” “G,” “C,”or“T”; in-sertions are indicated by a dot followed by the number of repetition and the nucleotide posi-tion; reversions by“!”; green indicates synonymous, brown non-synonymous, yellow other coding region, and black control region substitutions. Individual identification is indicated as well as the geographic origin when known (geographic regions are grouped by colour code ac-cording to the key). Near the nodes, the TMRCA is indicated (mean and 95% confidence inter-val) forρbased on whole-mtDNA sequences (in black),ρbased on synonymous diversity (in
green) and for maximum likelihood (in blue). (TIF)
S19 Fig. Frequency maps based on HVS-I data for the haplogroup J2a2b. (TIF)
coding region, and black control region substitutions. Individual identification is indicated as well as the geographic origin when known (geographic regions are grouped by colour code ac-cording to the key). Near the nodes, the TMRCA is indicated (mean and 95% confidence inter-val) forρbased on whole-mtDNA sequences (in black),ρbased on synonymous diversity (in
green) and for maximum likelihood (in blue). (TIF)
S21 Fig. Phylogenetic tree of haplogroup T2a1.Labels on the branches represent nucleotide positions of transitions, and transversions when followed by a suffix“A,” “G,” “C,”or“T”; in-sertions are indicated by a dot followed by the number of repetition and the nucleotide posi-tion; reversions by“!”; green indicates synonymous, brown non-synonymous, yellow other coding region, and black control region substitutions. Individual identification is indicated as well as the geographic origin when known (geographic regions are grouped by colour code ac-cording to the key). Near the nodes, the TMRCA is indicated (mean and 95% confidence inter-val) forρbased on whole-mtDNA sequences (in black),ρbased on synonymous diversity (in
green) and for maximum likelihood (in blue). (TIF)
S22 Fig. Phylogenetic tree of haplogroup T2c.Labels on the branches represent nucleotide positions of transitions, and transversions when followed by a suffix“A,” “G,” “C,”or“T”; in-sertions are indicated by a dot followed by the number of repetition and the nucleotide posi-tion; reversions by“!”; green indicates synonymous, brown non-synonymous, yellow other coding region, and black control region substitutions. Individual identification is indicated as well as the geographic origin when known (geographic regions are grouped by colour code ac-cording to the key). Near the nodes, the TMRCA is indicated (mean and 95% confidence inter-val) forρbased on whole-mtDNA sequences (in black),ρbased on synonymous diversity (in
green) and for maximum likelihood (in blue). (TIF)
S23 Fig. Phylogenetic tree of haplogroups T2i and T2g.Labels on the branches represent nu-cleotide positions of transitions, and transversions when followed by a suffix“A,” “G,” “C,”or
“T”; insertions are indicated by a dot followed by the number of repetition and the nucleotide position; reversions by“!”; green indicates synonymous, brown non-synonymous, yellow other coding region, and black control region substitutions. Individual identification is indicated as well as the geographic origin when known (geographic regions are grouped by colour code ac-cording to the key). Near the nodes, the TMRCA is indicated (mean and 95% confidence inter-val) forρbased on whole-mtDNA sequences (in black),ρbased on synonymous diversity (in
green) and for maximum likelihood (in blue). (TIF)
S24 Fig. Probabilistic proportion of founder clusters considering three migration periods (1.0, 10.0 and 16.0 ka), using thef1criterion and by assuming a Near East, Iran and Paki-stan source for migrations into Arabian Peninsula.The haplogroup affiliations of the foun-ders are indicated in the bottom.
(TIF)
S25 Fig. Probabilistic proportion of founder clusters considering three migration periods (1.0, 10.0 and 16.0 ka), using thef2criterion and by assuming a Near East, Iran and Paki-stan source for migrations into Arabian Peninsula.The haplogroup affiliations of the foun-ders are indicated in the bottom.
(TIF)
S26 Fig. Schematic tree of haplogroups L4 and L6.Ages (in ka) indicated are maximum like-lihood estimates obtained with the whole-mtDNA genome.
(TIF)
S27 Fig. Frequency maps based on HVS-I data for haplogroups L4 (A) and L6 (B). (TIF)
S28 Fig. Phylogenetic tree of haplogroup L4a.Labels on the branches represent nucleotide positions of transitions, and transversions when followed by a suffix“A,” “G,” “C,”or“T”; re-versions by“!”; green indicates synonymous, brown non-synonymous, yellow other coding re-gion, and black control region substitutions. Individual identification is indicated as well as the geographic origin when known (geographic regions are grouped by colour code according to the key). Near the nodes, the TMRCA is indicated (mean and 95% confidence interval) forρ
based on whole-mtDNA sequences (in black),ρbased on synonymous diversity (in green) and
for maximum likelihood (in blue). (TIF)
S29 Fig. Phylogenetic tree of haplogroup L4b.Labels on the branches represent nucleotide positions of transitions, and transversions when followed by a suffix“A,” “G,” “C,”or“T”; re-versions by“!”; green indicates synonymous, brown non-synonymous, yellow other coding re-gion, and black control region substitutions. Individual identification is indicated as well as the geographic origin when known (geographic regions are grouped by colour code according to the key). Near the nodes, the TMRCA is indicated (mean and 95% confidence interval) forρ
based on whole-mtDNA sequences (in black),ρbased on synonymous diversity (in green) and
for maximum likelihood (in blue). (TIF)
S30 Fig. Phylogenetic tree of haplogroup L6.Labels on the branches represent nucleotide po-sitions of tranpo-sitions, and transversions when followed by a suffix“A,” “G,” “C,”or“T”; rever-sions by“!”; green indicates synonymous, brown non-synonymous, yellow other coding region, and black control region substitutions. Individual identification is indicated as well as the geographic origin when known (geographic regions are grouped by colour code according to the key). Near the nodes, the TMRCA is indicated (mean and 95% confidence interval) forρ
based on whole-mtDNA sequences (in black),ρbased on synonymous diversity (in green) and
for maximum likelihood (in blue). (TIF)
S31 Fig. Bayesian Skyline Plot (BSP), indicating the median of the hypothetical effective population size through time based on data from haplogroup L4 (A) and haplogroups L4 and L6 (B), assuming a generation time of 25 years.
(TIF)
S32 Fig. Probabilistic proportion of founder clusters considering three migration periods (1.0, 2.5 and 13.0 ka), using thef1criterion and assuming an African source for migrations into Arabian Peninsula plus the Near East and Iran.The haplogroup affiliations of the foun-ders are indicated in the bottom.
(TIF)
are indicated in the bottom. (TIF)
S34 Fig. Probabilistic proportion of founder clusters considering three migration periods (2.0, 10.0 and 16.0 ka), using thef1criterion and assuming Arabian Peninsula plus Near East and Iran migrations into eastern Africa.The haplogroup affiliations of the founders are indicated in the bottom.
(TIF)
S35 Fig. Probabilistic proportion of founder clusters considering three migration periods (2.0, 10.0 and 16.0 ka), using thef2criterion and assuming Arabian Peninsula plus Near East and Iran migrations into eastern Africa.The haplogroup affiliations of the founders are indicated in the bottom.
(TIF)
S36 Fig. Probabilistic proportion of founder clusters considering three migration periods (2.0, 10.0 and 16.0 ka), usingf1criterion and assuming Arabian Peninsula plus Near East and Iran migrations into North Africa.The haplogroup affiliations of the founders are indi-cated in the bottom.
(TIF)
S37 Fig. Probabilistic proportion of founder clusters considering three migration periods (2.0, 10.0 and 16.0 ka), using thef2criterion and assuming Arabian Peninsula plus Near East and Iran migrations into North Africa.The haplogroup affiliations of the founders are indicated in the bottom.
(TIF)
S38 Fig. Population structure inferred by ADMIXTURE analysis.Each individual is repre-sented by a vertical (100%) stacked column of genetic components proportions shown in col-our for K = 3, 4 and 5.
(TIF)
S1 Table. Haplotypes for whole-mtDNA sequences that were fully characterised in this study and the corresponding geographic region.
(DOCX)
S2 Table. Published whole-mtDNA sequences used in all phylogenetic tree with the corre-sponding origin and subclade affiliation.
(DOCX)
S3 Table. Diversity values ofρandπused for the interpolation maps of the haplogroups J, T and L4.
(DOCX)
S4 Table. Frequency values used in the reconstruction of the interpolation maps for the haplogroups J, T, J1d1a and J2a2b.
(DOCX)
S5 Table. Frequency values used in the reconstruction of the interpolation maps for the haplogroups L4 and L6.
(DOCX)
S6 Table. Founder lineages identified when usingf1criterion from the Near East, Iran and Pakistan to Arabian Peninsula.
(DOCX)
S7 Table. Founder lineages identified when usingf2criterion from the Near East, Iranand Pakistan to Arabian Peninsula.
(DOCX)
S8 Table. Founder lineages identified when using af1criterion from Near East, Iran and Pakistan to Arabian Peninsula, based on whole-mtDNA JT sequences.
(DOCX)
S9 Table. Founder lineages identified when usingf1criterion from Africa to Arabian Pen-insula, Near East and Iran.
(DOCX)
S10 Table. Founder lineages identified when usingf2criterion from Africa to Arabian Pen-insula, Near East and Iran.
(DOCX)
S11 Table. Founder lineages identified when usingf1criterion from Arabian Peninsula, Near East and Iran to North Africa and to eastern Africa separately.
(DOCX)
S12 Table. Founder lineages identified when usingf2criterion from Arabian Peninsula, Near East and Iran to North Africa and to eastern Africa separately.
(DOCX)
S13 Table. Samples used for genome-wide autosomal analysis. (DOCX)
S14 Table. Peaks of rate of population size change through time as obtained from the BSPs and periods of time where the rate of population size increase was of at least one individual per 100 individuals in a period of 100 years.Increment ratio corresponds to the number of times the effective population size increase during this period.
(DOCX)
S15 Table. Ages for the oldest founders in the migration from Africa into the Arabian Pen-insula, Near East and Iran.This is a sub-set ofS9 Table.
(DOCX)
S1 Text. Phylogeographic analyses and supplemental information on founder analyses. In-cludes 15 tables.
(DOCX)
Author Contributions
Conceived and designed the experiments: MBR LP. Performed the experiments: VF JBP TR AM ZF. Analyzed the data: VF PT BC PS. Contributed reagents/materials/analysis tools: FA VC MBR LP. Wrote the paper: VF MBR LP.