ACPD
12, 22309–22353, 2012Atmospheric nitrogen oxides above the Antarctic
Plateau
M. M. Frey et al.
Title Page
Abstract Introduction
Conclusions References
Tables Figures
◭ ◮
◭ ◮
Back Close
Full Screen / Esc
Printer-friendly Version Interactive Discussion
Discussion
P
a
per
|
Dis
cussion
P
a
per
|
Discussion
P
a
per
|
Discussio
n
P
a
per
Atmos. Chem. Phys. Discuss., 12, 22309–22353, 2012 www.atmos-chem-phys-discuss.net/12/22309/2012/ doi:10.5194/acpd-12-22309-2012
© Author(s) 2012. CC Attribution 3.0 License.
Atmospheric Chemistry and Physics Discussions
This discussion paper is/has been under review for the journal Atmospheric Chemistry and Physics (ACP). Please refer to the corresponding final paper in ACP if available.
The diurnal variability of atmospheric
nitrogen oxides (NO and NO
2
) above the
Antarctic Plateau driven by atmospheric
stability and snow emissions
M. M. Frey1, N. Brough1, J. L. France3, O. Traulle4, P. S. Anderson1,2, M. D. King3, A. E. Jones1, E. W. Wolff1, and J. Savarino5
1
British Antarctic Survey, Natural Environment Research Council, Cambridge, UK 2
Scottish Association for Marine Science, Oban, Argyll, Scotland, PA37 1QA, UK 3
Department of Earth Sciences, Royal Holloway, University of London, Egham, UK 4
CNRM-GAME, URA 1357, M ´et ´eo France CNRS, Toulouse, France 5
Universit ´e Joseph Fourier – Grenoble 1/CNRS-INSU, Laboratoire de Glaciologie et G ´eophysique de l’Environnement, St. Martin d’H `eres, France
Received: 31 July 2012 – Accepted: 21 August 2012 – Published: 29 August 2012
Correspondence to: M. M. Frey ([email protected])
ACPD
12, 22309–22353, 2012Atmospheric nitrogen oxides above the Antarctic
Plateau
M. M. Frey et al.
Title Page
Abstract Introduction
Conclusions References
Tables Figures
◭ ◮
◭ ◮
Back Close
Full Screen / Esc
Printer-friendly Version Interactive Discussion
Discussion
P
a
per
|
Dis
cussion
P
a
per
|
Discussion
P
a
per
|
Discussio
n
P
a
per
Abstract
Atmospheric nitrogen oxides (NO and NO2) were observed at Dome C, East Antarctica
(75.1◦S, 123.3◦E, 3233 m) during austral summer 2009–2010. Average (±1σ) mixing
ratios at 1.0 m of NO and NO2, the latter measured for the first time on the East Antarc-tic Plateau, were 111 (±89) and 102 (±88) pptv, respectively. Atmospheric mixing ratios
5
are on average comparable to those observed previously at South Pole, but in contrast show strong diurnal variability, with a minimum around local noon and a maximum in the early evening. The asymmetry in the diel cycle of NOx concentrations and likely any
other chemical tracer with a photolytic surface source is driven by the diffusivity and
height of the atmospheric boundary layer, with the former controlling the magnitude
10
of the vertical flux and the latter the size of the volume snow emissions are diffusing
into. In particular, the NOx emission flux estimated from concentration gradients was
on average (±1σ) of 6.9 (±7.2)×1012molecule m−2s−1and is consistent with the 3-fold
increase in mixing ratios in the early evening when the atmospheric boundary layer be-comes very shallow. Dome C is likely not representative for the entire East Antarctic
15
Plateau but illustrates the need of accurate descriptions for atmospheric boundary layer physics in atmospheric chemistry models. Calculated mean potential NO2 production rates from nitrate (NO−3) photolysis are only about 62 % of the observed NOxflux and
highlight uncertainties in the parameterization of the photolytic NOxsnow source above
Antarctica. A steady-state analysis of the NO2: NO ratios indicates high concentrations
20
of peroxy radicals (HO2+RO2) in the air above the snow and confirms the existence
of a strongly oxidising canopy enveloping the East Antarctic Plateau in summer.
1 Introduction
The nitrogen oxides NO and NO2 (NOx) play a key role in determining the
oxidiz-ing capacity of the atmospheric boundary layer in the high latitudes. This influence is
25
ACPD
12, 22309–22353, 2012Atmospheric nitrogen oxides above the Antarctic
Plateau
M. M. Frey et al.
Title Page
Abstract Introduction
Conclusions References
Tables Figures
◭ ◮
◭ ◮
Back Close
Full Screen / Esc
Printer-friendly Version Interactive Discussion
Discussion
P
a
per
|
Dis
cussion
P
a
per
|
Discussion
P
a
per
|
Discussio
n
P
a
per
ozone (O3), through shifting HOxradical partitioning towards the hydroxyl radical (OH) via the reaction HO2+NO, and finally through the latter also controlling formation rates
of peroxides (H2O2 and ROOH). Atmospheric NOx concentrations in coastal
Antarc-tica are small, with build up prevented by halogen chemistry (Grannas et al., 2007; Bauguitte et al., 2012), whereas mixing ratios reported from South Pole are unusually
5
high equaling those from the mid-latitudes (Davis et al., 2008). Large mixing ratios of NOx are, in part, due to significant emissions from surface snow observed at various polar sites. The emissions equal or exceed in magnitude the gas phase source of NOx
(Grannas et al., 2007; Jones et al., 2011, and refs. therein), and are attributed to UV-photolysis of nitrate in snow (Grannas et al., 2007; Frey et al., 2009b). Emissions of NOx
10
are responsible for significant changes of atmospheric oxidising capacity above snow covered areas: net ozone production was observed in the interior of Antarctica (Craw-ford et al., 2001; Legrand et al., 2009; Slusher et al., 2010) and unusually high levels of hydroxyl radical levels were detected at South Pole (Davis et al., 2008, and refs. therein). Furthermore, release of NO from snow is associated with the inter-seasonal
15
variability of peroxides above polar snow, since the reaction HO2+NO competes with
the recombination reaction HO2+HO2→H2O2(e.g. Frey et al., 2005, 2009a).
Here we recall the basic gas phase chemistry of NOx as described by the Leighton
mechanism (Leighton, 1961):
NO2+hν→NO+O(3P) (R1)
20
O(3P)+O2+M→O3 (R2)
NO+O3→NO2+O2 (R3)
ACPD
12, 22309–22353, 2012Atmospheric nitrogen oxides above the Antarctic
Plateau
M. M. Frey et al.
Title Page
Abstract Introduction
Conclusions References
Tables Figures
◭ ◮
◭ ◮
Back Close
Full Screen / Esc
Printer-friendly Version Interactive Discussion
Discussion
P
a
per
|
Dis
cussion
P
a
per
|
Discussion
P
a
per
|
Discussio
n
P
a
per
halogen (XO, with X=Cl, Br, I) radicals:
NO+HO2→NO2+OH (R4)
NO+OH→HONO (R5)
NO+RO2→NO2+RO (R6)
NO+XO→NO2+X (R7)
5
NO2 reacts further to eventually form HNO3 which is then deposited to the snow
surface. The following simplified reaction scheme summarizes currently known NO−3 photochemistry in snow (Grannas et al., 2007):
NO−
3+hν→NO2+O− (R8)
NO−
3+hν→NO − 2+O(
3P) (R9)
10
NO−
2+hν→NO+O− (R10)
O−+H
2O→2OH (R11)
NO−
2+OH→NO2+OH− (R12)
Major atmospheric chemistry campaigns such as ISCAT and ANTCI at South Pole and CHABLIS at Halley provided the first extensive observations of composition and
15
oxidising capacity of the lower troposphere above Antarctica, including observations of NOx (Davis et al., 2004b; Eisele et al., 2008; Jones et al., 2008). There is now
con-sensus that NOxemissions are an essential component of air-snow cycling of oxidised
nitrogen species above the polar ice sheets and snow-covered surfaces in the mid-latitudes (Honrath et al., 2000; Grannas et al., 2007; Davis et al., 2008; Frey et al.,
20
2009b). However, the quantitative understanding of NOx emissions from snow is still
incomplete and parameterizations for use in global chemistry-climate models are either non-existent or not reflecting recent progress from lab and field studies.
The study presented here is motivated by the sparse data base of NO2observations
above snow and a general lack of comparable measurements of NOx emissons from 25
ACPD
12, 22309–22353, 2012Atmospheric nitrogen oxides above the Antarctic
Plateau
M. M. Frey et al.
Title Page
Abstract Introduction
Conclusions References
Tables Figures
◭ ◮
◭ ◮
Back Close
Full Screen / Esc
Printer-friendly Version Interactive Discussion
Discussion
P
a
per
|
Dis
cussion
P
a
per
|
Discussion
P
a
per
|
Discussio
n
P
a
per
time are observations of both nitrogen oxides in air above the plateau region of the East Antarctic Ice Sheet (EAIS) and their flux estimated from measurements of concentra-tion gradients. The observed diurnal variabilities of NOx concentrations are discussed
with respect to mixing properties of the atmospheric boundary layer and strength of the snow pack source. Measured NOx flux is compared to model predictions to diagnose
5
uncertainties in the parameterization of the NOx source in surface snow. And finally,
ratios of atmospheric concentrations of NO2and NO are used to infer potential radical
concentrations.
2 Methods
Measurements of atmospheric NOxtook place at Dome C, where the year–round oper-10
ated French-Italian Concordia Station is located (75.1◦S, 123.3◦E, 3233 m). The local
climate is dominated by temperature inversion or katabatic winds that coincide with cold, clear and calm conditions. However, wind speeds are low in comparison to near-coastal areas due to the location on top of a Dome, where surface slopes do not ex-ceed 1 %. Occasional synoptic coastal influence coincides with higher wind speeds
15
and brings relatively warmer and cloudier air to the site (e.g. Genthon et al., 2010). Ancillary data collection included standard meteorology from an automatic weather station at 0.5 km distance (air temperature and relative humidity at 1.6 m, wind speed and direction at 3.3 m), and in situ measurements of temperature of air at 1 m and the snow surface, broad band UV-A radiation (UVA CUV4 broadband radiometer, Kipp
20
& Zonen), atmospheric turbulence observations from a sonic anemometer at 1 km dis-tance and surface ozone. All times are given as local time (LT), equivalent to UTC+8 h.
2.1 NOxdetection
For NOxdetection a 2-channel chemiluminescence detector (CLD) was used that was run previously year-round at Halley (75.6◦S, 26.6◦W, 37 m) in coastal Antarctica
ACPD
12, 22309–22353, 2012Atmospheric nitrogen oxides above the Antarctic
Plateau
M. M. Frey et al.
Title Page
Abstract Introduction
Conclusions References
Tables Figures
◭ ◮
◭ ◮
Back Close
Full Screen / Esc
Printer-friendly Version Interactive Discussion
Discussion
P
a
per
|
Dis
cussion
P
a
per
|
Discussion
P
a
per
|
Discussio
n
P
a
per
guitte et al., 2012). One channel of the CLD measured atmospheric NO whereas the other determined the sum of NO and NO originating from the quantitative photolytic conversion of NO2. The signal difference between the two channels was then used
to calculate atmospheric NO2 concentrations. The instrument was operated out of an electrically heated Weatherhaven tent located in the designated clean-air sector 0.7 km
5
upwind (South) of Concordia station. Apart from snow drift due to the tent structure the surrounding snow pack had not been subject to any perturbations such as motorized vehicle or foot traffic for the past 4–5 yr. Three 20 m-long intake lines (Fluoroline 4200
high purity PFA, I.D. 4.0 mm) were mounted on a mast about 15 m upwind outside the snow drift zone to sample air at 0.01, 1.00 and 4.00 m above the natural snow pack.
10
During selected time periods firn air was sampled by inserting one inlet into pre-cored horizontal holes at 5–10 cm snow depth.
The sample intakes were shielded from solar radiation with black heat-shrink tub-ing and connected inside the Weatherhaven tent to a valve box, which automatically switched the CLD between sampling heights on a 90 s duty cycle. In order to achieve
15
continuous flow and reduce sample residence time in the tubing, ambient air was drawn through each one of the long intake lines at 5.0 STP-l min−1
using high-capacity vacuum diaphragm pumps (GAST, Part No. DOA-P725-BN). The CLD inlet drawing sample air from the respective intake line was mass-flow controlled at 1.0 STP-l min−1 for each channel. Spike tests using the NO gas standard showed that air sample residence time
20
between the tip of the sample intake and the reaction vessel inside the CLD was 4 s, and therefore<2 s in the photolytic cell. On three occasions ambient air was sampled for up to 1.5 h through all three inlets mounted at 1.00 m above the snow. Parametric (two-samplet-test) and non-parametric tests (Wilcoxon signed rank test) performed on NO and NO2 mixing ratios did not show any significant differences between the inlets 25
at the 95 % confidence level.
Transforming CLD count rates into atmospheric mixing ratios required regular mea-surement of baseline, instrument sensitivity, conversion efficiency (CE) of Reaction R1
ACPD
12, 22309–22353, 2012Atmospheric nitrogen oxides above the Antarctic
Plateau
M. M. Frey et al.
Title Page
Abstract Introduction
Conclusions References
Tables Figures
◭ ◮
◭ ◮
Back Close
Full Screen / Esc
Printer-friendly Version Interactive Discussion
Discussion
P
a
per
|
Dis
cussion
P
a
per
|
Discussion
P
a
per
|
Discussio
n
P
a
per
rates were measured for 60 s every 13.5 min alternating between all three inlets, i.e. implying a repeat period of 40.5 min for each individual intake line. Instrument sensi-tivity and CE were determined every 14 h based on addition of a 4 ppbv NO standard to the sampled air flow. Some of the automated calibrations were compromised by a small leak and the respective CLD sensitivities were then replaced by average values
5
confirmed by pre- and post-season calibrations.
The detector artefact was measured every 14 h, offset by 7 h to the calibration runs.
CE was on average 0.30 (range 0.25–0.35) (Table 1), thus considerably lower than a CE of 0.5 reported for the same instrument operated at sea level (Bauguitte et al., 2012). We explain this as follows: if one neglects oxidants in ambient air CE depends
10
solely on the photolysis ratej and sample residence timeτin the photolytic cell of the CLD (Ryerson et al., 2000):
CE=1−e−jτ (1)
The former is a function of the optical geometry of the instrument, which had re-mained unchanged, whereas the latter decreases with altitude since the photolytic
15
cell was not pressure controlled. Mean ambient pressure (650 mbar) and temperature (269 K) at Dome C result in a volumetric flow rate about 0.72 that at Halley. Inserting into the equation above the respective values for Dome C (DC) and Halley and taking the ratio yields.
τDC τHalley
= ln(1−CEDC)
ln(1−CEHalley)
(2)
20
With CEHof 0.5 and a ratio ofτDC/τHalleyof 0.72 one obtains a CEDCof 0.4. Contrary to
the Halley measurements we used continuously long sample intake lines, which causes the pressure inside the photolytic cell to drop well below ambient levels. A pressure drop of 250 mbar, which seems reasonable, would then resolve the remaining discrep-ancy with the observed CEDC.
ACPD
12, 22309–22353, 2012Atmospheric nitrogen oxides above the Antarctic
Plateau
M. M. Frey et al.
Title Page
Abstract Introduction
Conclusions References
Tables Figures
◭ ◮
◭ ◮
Back Close
Full Screen / Esc
Printer-friendly Version Interactive Discussion
Discussion
P
a
per
|
Dis
cussion
P
a
per
|
Discussion
P
a
per
|
Discussio
n
P
a
per
2.2 NOxdata processing and uncertainty
The linearly interpolated signal of all baseline intervals was subtracted from the CLD count rates recorded at 1 Hz. The baseline levels were typically the same in between the three inlets, but showed large and systematic variations when NOxconcentrations
between the three inlets were very different, i.e. when either near-surface gradients
5
were pronounced during certain times of the day or when firn air was sampled. During these sampling periods the signals from each inlet were corrected individually by sub-tracting only the baseline interval corresponding to the specific inlet. The repeat period of baseline measurement for the individual inlet increased therefore to 40.5 minutes. An artefact correction was applied during the 11 December 2009 to 3 January 2010
10
period, amounting to 6–8 pptv and 3–4 pptv for NO and NO2, respectively (Table 1).
After 4 January 2010 artefact levels dropped to about 50 % of the above values and were not used.
Shielding an air sample from solar radiation once entering the sample line can po-tentially alter the ratio of NO2 and NO as the Leighton photostationary state (R1–R3) 15
shifts to a new equilibrium. Formation of NO2from reaction R3 at Dome C during this study was estimated to be 4×10⁶molecule cm−3s−1. With a sample residence time in
the inlets of<4 s one obtains median changes in NO and NO2of<1.6 % and therefore
no correction was applied.
The mean wind direction during the field campaign was from SSW (208◦) with an
20
average speed of 2.6 m s−1. During less than 1 % of measurement time the wind came from Concordia station carrying polluted air from the station power generator to the measurement site. To remove pollution spikes a moving 1-min standard deviation filter was applied rejecting data when 1-σ of NO and NO2 mixing ratios exceeded 24 and
90 pptv, respectively. Comparison to logged contamination events and the above wind
25
rose analysis confirmed the efficiency of the statistical filter in suppressing any pollution
episode either from power generators at Concordia station or occasional vehicle traffic
ACPD
12, 22309–22353, 2012Atmospheric nitrogen oxides above the Antarctic
Plateau
M. M. Frey et al.
Title Page
Abstract Introduction
Conclusions References
Tables Figures
◭ ◮
◭ ◮
Back Close
Full Screen / Esc
Printer-friendly Version Interactive Discussion
Discussion
P
a
per
|
Dis
cussion
P
a
per
|
Discussion
P
a
per
|
Discussio
n
P
a
per
Filtered data, still including some negative values in the case of NO2, were then aggregated to 1 min averages. About 6.3 % of all mixing ratios of NO2, equivalent to
65 h, were still negative due to uncertainties in baseline and artefact determinations and were discarded. The uncertainty in the 1-min averages due to random errors was estimated as the standard error (standard deviation of the mean) and amounted to
5
1 and 11 pptv for NO and NO2, respectively (Table 1). The precisions or fractional
uncertainties were 2.6 and 43.6 % for NO and NO2, respectively (Table 1). The errors in NO2are larger than seen previously and are due to the reduced conversion efficiency
at Dome C.
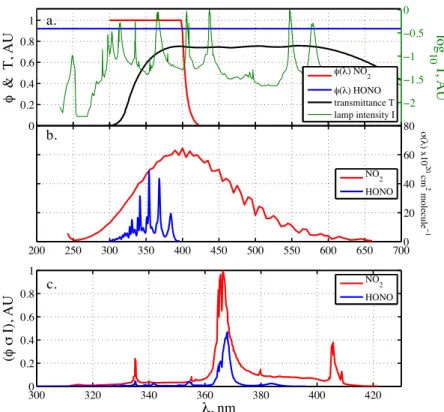
Quantification of NO2as NO after photolytic conversion can be compromised by the
10
presence of other chemical gas phase species, which produce NO in the photolytic converter, i.e. whose absorption cross sections have significant overlap with that of NO2(Fig. 1a, b). Interferents relevant for our system are bromine nitrate (BrONO2) and
nitrous acid (HONO) (Ryerson et al., 2000), of which only the latter its expected to play a role on the EAIS plateau during polar day. We therefore calculated a potential
15
interference as the ratio of the respective photolysis rates,jHONO/jNO2, in the photolytic
converter (Fig. 1c) and obtained a value of 0.22, somewhat smaller than that of 0.37 es-timated for a similar instrument (Ryerson et al., 2000). HONO was previously observed at South Pole in Summer using laser-induced fluorescence and showed median lev-els of 5.8 pptv (maximum 18.2 pptv) (Liao et al., 2006). If similar levlev-els of HONO are
20
present at Dome C, then the seasonal mean of NO2at 1.0 m of 102 pptv (Table 2) would
be overestimated by 1.3 % (maximum 4.1 %). More recent HONO measurements at Dome C report a range of 5–60 pptv, and corrections would be correspondingly larger if interferents in the wet chemical method employed can be ruled out (Kerbrat et al., 2012).
25
2.3 NOxflux estimates
ACPD
12, 22309–22353, 2012Atmospheric nitrogen oxides above the Antarctic
Plateau
M. M. Frey et al.
Title Page
Abstract Introduction
Conclusions References
Tables Figures
◭ ◮
◭ ◮
Back Close
Full Screen / Esc
Printer-friendly Version Interactive Discussion
Discussion
P
a
per
|
Dis
cussion
P
a
per
|
Discussion
P
a
per
|
Discussio
n
P
a
per
∂c/∂z and diffusion coefficient Kc of a chemical tracer relate to its diffusive flux F.
F =−Kc∂c
∂z (3)
Within the atmospheric boundary layer, vertical diffusion is dominated by turbulent
mixing, rather than molecular diffusion, andKc can be estimated by a variety of
meth-5
ods from analogous measurements of the turbulent diffusivity for momentum Km and
heatKh. In this study, we used sonic anemometer measurements of atmospheric
tur-bulence available from a tower at 0.8 km distance, since in situ observations were com-promised due to instrument malfunctioning.K values are calculated according to the Monin-Obukhov similarity theory (MOST) whose predictions of flux-profile relationships
10
at Halley, an Antarctic coastal site of the same latitude as DC, agree well with observa-tions (Anderson and Neff, 2008, and references therein). For the chemical flux estimate
we make the assumption thatKc∼Kh. The NOx fluxF is then given by
F =− κu∗z Φh(z L)
∂c
∂z (4)
whereκ(set to 0.40) is the von Karman constant,u∗is the friction velocity,z is height,
15
and Φh(z
L) an empirically determined stability function for heat with L as the
Monin-Obukhov length. Assuming constant flux across the layer between the two measure-ment heightsz1andz2allows to integrate and yields:
F =−
Rc2 c1κu∗∂c
Rz2 z1
Φh(z L)
∂z z
=−κu∗[c(z2)−c(z1)]
Rz2 z1
Φh(z L)
∂z z
(5)
Stability functions used were Φh=Prt+4.62z/L established previously for stable
20
conditions above snow (King and Anderson, 1994) andΦh=Prt(1−11.6z/L)−0.5 for
ACPD
12, 22309–22353, 2012Atmospheric nitrogen oxides above the Antarctic
Plateau
M. M. Frey et al.
Title Page
Abstract Introduction
Conclusions References
Tables Figures
◭ ◮
◭ ◮
Back Close
Full Screen / Esc
Printer-friendly Version Interactive Discussion
Discussion
P
a
per
|
Dis
cussion
P
a
per
|
Discussion
P
a
per
|
Discussio
n
P
a
per
Note that in the neutral boundary layerΦh is Prt and the denominator in Eq. (5)
sim-plifies to Prtln(z2/z1). Friction velocity u∗ and L were computed from high frequency
(10 Hz) measurements of the three-dimensional wind components (u,v,w) and tem-perature by a sonic anemometer (ATEC1-061101) mounted at 7 m above the snow on a tower at 1 km distance. Processing in 10-min blocks included despiking, temperature
5
cross-wind correction and a double coordinate rotation to force meanwto zero (Kaimal and Finnigan, 1994; Van Dijk et al., 2006). The instrument alternated between 5 min of measurements and 12 min of heating to prevent frost build up on the sensors. Eq. (5) implies that positive flux points in upward direction, equivalent to snow pack emissions and vice versa, equivalent to deposition.
10
The application of MOST and the assumption of constant flux both require a chemical lifetime much longer than the mixing time scale of the respective tracer. This does not hold true for NO and NO2, which are subject to rapid interconversion. However, in the case of NOxprevious estimates of chemical lifetime range between 6.4 h (daily mean)
at Halley (Bauguitte et al., 2012) and 8 h (median) at South Pole (Davis et al., 2004a),
15
whereas the mixing time scale, e.g. estimated as the ratioz2/u∗, was during this study
on average only on the order of seconds. We therefore limit ourselves to deriving only NOxflux.
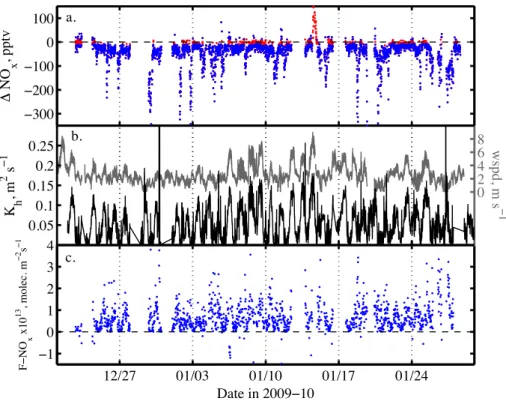
It should be noted that application of the flux-gradient method is only possible, when concentration gradients∆[NOx] can be detected. 10-min averages of ∆[NOx] not
sig-20
nificantly different from zero, i.e. smaller than their respective 1-σ standard error were
therefore not included in the flux estimates (Fig. 4). The total uncertainty of the 10-min NOx flux due to random error in ∆[NOx] (31 %), u∗ (3 % after Bauguitte et al. (2012))
and measurement height (error in lnz2/z1of∼7 %) amounts to 32 %. This reduces to
13 % when considering 1-hr flux averages.
ACPD
12, 22309–22353, 2012Atmospheric nitrogen oxides above the Antarctic
Plateau
M. M. Frey et al.
Title Page
Abstract Introduction
Conclusions References
Tables Figures
◭ ◮
◭ ◮
Back Close
Full Screen / Esc
Printer-friendly Version Interactive Discussion
Discussion
P
a
per
|
Dis
cussion
P
a
per
|
Discussion
P
a
per
|
Discussio
n
P
a
per
3 Results
Mixing ratios of atmospheric NO and NO2were measured at up to three levels above
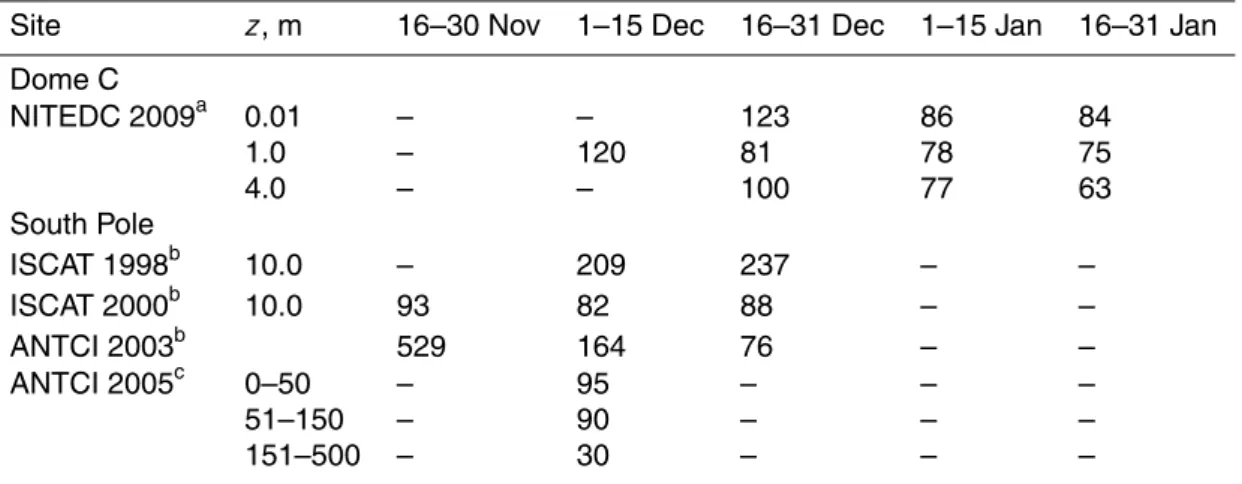
the snow surface from 10 December 2009 to 28 January 2010 (Figs. 2, 3) and show at 1.0 m for the entire season a median of 84 and 74 pptv, respectively (Table 2). The highest mixing ratios are detected in firn interstitial air and systematically decrease with
5
sampling height above the snow surface. For example, median levels of NOxwere 168,
145 and 135 pptv at 0.01, 1.0 and 4.0 m, respectively, whereas the median of available samples in firn air was 371 pptv (Table 2). Furthermore, examination of the median NO2: NO ratio reveals also a dependency on height with a decrease from 1.5 in firn air
to 0.7 at 1 m above the snow surface (Figs. 2, 3, Table 2).
10
Mixing ratios of NO and NO2 show strong diurnal variability out of phase with solar radiation, with a daily minimum occurring around local noon and a maximum in the evening/night time hours (Figs. 3, 7). Build up and decay of the daily maximum mixing ratios follow on calm days a repeatable pattern, with changes always starting at the lowest intake level followed by those aloft (Fig. 3b, c). On a number of days in December
15
and more frequently in January NOxmixing ratios decreased and the diurnal cycle was
suppressed concurrent with wind speeds above 5 m s−1(Fig. 2), which however does
not alter much the median diurnal cycle at Dome C (Fig. 7). Comparison of the two-week medians of atmospheric NOx mixing ratios reveal a decreasing seasonal trend.
For example, NOx mixing ratios at 1.0 m are with 388 pptv highest before the summer
20
solstice during 1–15 December and then decrease via 159, 139, to 128 pptv in the second half of January. Comparison of median NO concentrations shows that also at South Pole the highest atmospheric mixing ratios are observed in early summer, i.e. the second half of November (Table 3).
The mean NOx mixing ratio difference ∆[NOx] between 1 and 0.01 m was−50 pptv 25
with an average standard error of 9 pptv (Fig. 4a). About 14.5 % of the available 10-min ∆[NOx] averages, observed typically around local noon, a time of strong
ACPD
12, 22309–22353, 2012Atmospheric nitrogen oxides above the Antarctic
Plateau
M. M. Frey et al.
Title Page
Abstract Introduction
Conclusions References
Tables Figures
◭ ◮
◭ ◮
Back Close
Full Screen / Esc
Printer-friendly Version Interactive Discussion
Discussion
P
a
per
|
Dis
cussion
P
a
per
|
Discussion
P
a
per
|
Discussio
n
P
a
per
the flux estimate (Fig. 4a). From a total of 1356 10-min average flux values (∼10
days), 52 % were during stable and the remainder during unstable conditions. Cor-rections from Φh decreased (increased) flux during stable (unstable) conditions by
<10 % when compared to the case of a neutral boundary layer. The NOx fluxes were
almost exclusively emissions from the snow surface with an average (±1σ) of 6.9
5
(±7.2)×1012molecule m−2s−1(Table 2, Fig. 4c).
4 Discussion
This study reports the first time direct observations of NO2 in the interior of Antarctica
and the longest NOx flux measurements above snow on the continent. A first look at
absolute atmospheric concentrations shows that the NOx mixing ratios observed at 10
Dome C are highly elevated. For example, median NO mixing ratios of 81–123 pptv in December are about an order of magnitude higher than at other polar sites (Halley, Neumayer, Alert, Barrow or Summit, as reviewed in Grannas et al. (2007)), but fall into the range observed on an airborne campaign across EAIS and at South Pole during some summer seasons (Table 3). However, a striking difference to South Pole is the
15
pronounced diel cycle of NOxout of phase with solar radiation, which will be discussed
below in more detail.
4.1 Diurnal variability of NOxand boundary layer stability
If the photolytic snow source of NOxwas the main driver of atmospheric concentrations
one might expect a daily NOx cycle closely associated with solar irradiance. However, 20
the diurnal NOx variability on calm days lacks any correlation with UV irradiance (e.g. Fig. 8a) and shows a peculiar asymmetry of the maximum with respect to solar noon (Figs. 3, 7). Even though this daily pattern is disrupted at elevated wind speeds, it is preserved in the median diurnal cycle of NO and NO2 for the entire season (Fig. 7). This indicates that the boundary layer might play an important role in controlling
ACPD
12, 22309–22353, 2012Atmospheric nitrogen oxides above the Antarctic
Plateau
M. M. Frey et al.
Title Page
Abstract Introduction
Conclusions References
Tables Figures
◭ ◮
◭ ◮
Back Close
Full Screen / Esc
Printer-friendly Version Interactive Discussion
Discussion
P
a
per
|
Dis
cussion
P
a
per
|
Discussion
P
a
per
|
Discussio
n
P
a
per
centrations of chemical tracers emitted at the surface, as suggested by previous mi-crometeorological studies at Dome C (Argentini et al., 2005; King et al., 2006).
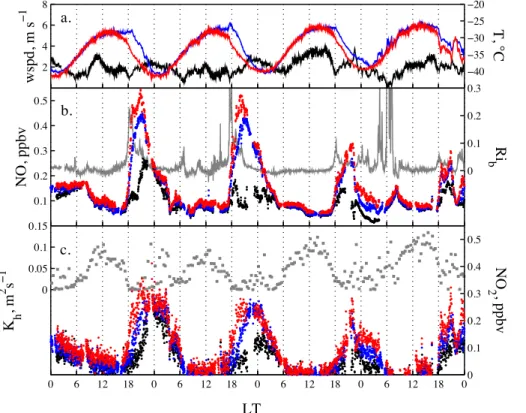
Firstly, it is important to note that at Dome C air temperature and wind speed exhibit a strong diurnal cycle (Figs. 2a, 3a), as observed by King et al. (2006). The air tempera-ture shows daily maxima in the early afternoon, lagging that of solar radiation by about
5
2 h, and has an amplitude of ∼12 K (Fig. 3a). The wind speed peaks around noon,
decreases in the early evening, but picks up again during night time, with a rather small daily amplitude of∼1.5 m s−1(Fig. 3a). Diurnal variations of both parameters are
typi-cal for locations where a convective boundary layer develops as a response to daytime heating (King et al., 2006). Not only wind speed but also wind direction shows a small
10
but significant diurnal cycle. Winds were from 190–200◦ during 10:00–14:00 LT and
then shift to∼220◦during 18:00–24:00 LT. Both, increase in wind speed and change of
wind direction later in the evening suggest development of an Ekman spiral consistent with previous findings at Plateau Station on the EAIS (Kuhn et al., 1977).
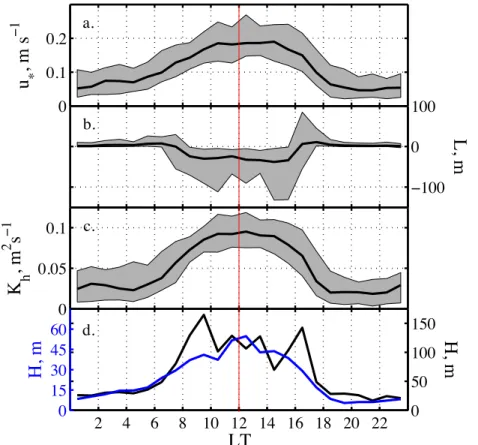
Secondly, boundary layer parameters that can be derived from direct turbulence
15
measurements includeu∗,LandK and contribute to a more complete picture of mix-ing processes. The friction velocityu∗ measures how efficiently a trace gas emitted at
the surface is mixed vertically into the atmospheric boundary layer. The median diur-nal cycle ofu∗ peaks around local noon and drops during night time hours (Fig. 5a). The Monin-Obukhov lengthL is a height proportional to the height above the surface
20
at which buoyancy first dominates wind shear, with negative (positive) L values in-dicating unstable (stable) conditions. The characteristic diurnal cycle ofL during the study period suggests that between 07:00 and 16:00 LT the boundary layer becomes unstable and convective, whereas during the rest of the day stable stratification pre-vails (Fig. 5b), consistent with previous micrometeorological measurements (Argentini
25
et al., 2005; King et al., 2006). And finally, knowing u∗ and L allows to calculate the turbulent diffusion coefficient for heatKhat a given height as defined in Eq. (4).Kh
cor-relates with horizontal wind speeds and its diurnal cycle looks very similar to that ofu∗
ACPD
12, 22309–22353, 2012Atmospheric nitrogen oxides above the Antarctic
Plateau
M. M. Frey et al.
Title Page
Abstract Introduction
Conclusions References
Tables Figures
◭ ◮
◭ ◮
Back Close
Full Screen / Esc
Printer-friendly Version Interactive Discussion
Discussion
P
a
per
|
Dis
cussion
P
a
per
|
Discussion
P
a
per
|
Discussio
n
P
a
per
then contributions from turbulence due to buoyancy (free convection), whereas during night time (18:00–06:00 LT) the atmosphere is stably stratified and turbulence due to wind shear (forced convection) is the sole driver of mixing.
These observations confirm the daily development of a convective boundary layer at Dome C in summer, which had been found previously based on sodar records
(Ar-5
gentini et al., 2005) and quantification of the surface energy budget, with the average diurnal sensible heat flux being in upward direction (i.e. <0) during 06:00–17:00 LT (King et al., 2006). At its origin is the greater partitioning of available energy into the sensible heat flux rather than latent heat because air temperatures and therefore water vapour pressures are low at this location (King et al., 2006). The sensible heat flux is
10
responsible for the large day-night temperature amplitude and drives the development of a convective boundary layer throughout the day, giving thereby rise to efficient
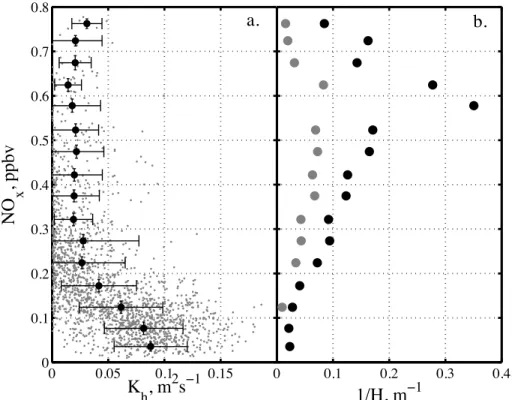
ver-tical mixing (King et al., 2006). Implications for NOx mixing ratios are illustrated by the
inverse relationship withKh, and thereforeu∗: NOxmixing ratios are small around local
noon when efficient convective mixing takes place and increase during the night, when
15
Khis small (Fig. 6a). A similar non-linear relationship has been observed previously at
South Pole between NO andu∗(Neffet al., 2008).
Thirdly, the mixing height H of the boundary layer is another parameter, important for chemical budget calculations, as it determines the available air volume snow emis-sions can diffuse into and which was observed to show significant diurnal variability at
20
Dome C (King et al., 2006). We estimatedH using the parameterizations by Pollard et al. (1973) and Zilitinkevitch et al. (2002) described previously for analysis of bound-ary layer behaviour at South Pole (Neffet al., 2008). Since diurnal cycles are present
at Dome C the use of these simple scaling laws warrants caution as they apply to the stable or weakly unstable boundary layer and assume that an equilibrium boundary
25
vari-ACPD
12, 22309–22353, 2012Atmospheric nitrogen oxides above the Antarctic
Plateau
M. M. Frey et al.
Title Page
Abstract Introduction
Conclusions References
Tables Figures
◭ ◮
◭ ◮
Back Close
Full Screen / Esc
Printer-friendly Version Interactive Discussion
Discussion
P
a
per
|
Dis
cussion
P
a
per
|
Discussion
P
a
per
|
Discussio
n
P
a
per
ability is found and daily ranges of medianH were 5–55 m and 17–165 m, after Pollard et al. (1973) and Zilitinkevitch et al. (2002), respectively (Fig. 5d). No direct observa-tions of H are available to validate the estimates. However, the sodar records from summer 1999 showed that starting from a shallow nocturnal boundary layer of<50 m at 07:00 LT a capping inversion reached heights of 200–300 m at 13:00–14:00 LT in late
5
December to early January and disappeared by 18:00 LT leaving behind the nocturnal boundary layer (Argentini et al., 2005; King et al., 2006). Thus, ourH predictions are likely biased low during unstable conditions, but suggest during stable conditions the existence of a very shallow nocturnal boundary layer withH <20 m (Fig. 5c). This is consistent with visual observations of a defined layer of haze forming at the ground at
10
Dome C, which indicate that the atmospheric boundary layer does not exceed build-ing height of 20 m durbuild-ing night time. A shallow boundary layer is typically associated with elevated NOx (Fig. 6b), as seen also at South Pole (Neff et al., 2008). It should
be noted that a correlation between estimatedH and atmospheric concentration is ex-pected, since the above parameterizations of H depend strongly on friction velocity.
15
This implies that it is the diffusivity of the atmosphere which controls both
concen-tration gradients and the extent of boundary layer height H. The latter is needed in atmospheric chemistry applications to assess the impact of snow emissions on the atmospheric budget and compare to gas phase production rates.
The diel cycles of all parameters based on MOST and related to the diffusivity of the
20
lower atmosphere at Dome C (u∗,L, Kh and H) are asymmetrical around local noon
(Figs. 3c, 5). They increase gradually in the morning, whereas they decrease more quickly in the early evening, illustrating the development and collapse of the convective boundary layer. The daily variability in mixing properties of the lower atmosphere is clearly reflected in the asymmetry of the diel NOx cycle, which shows large increases 25
in the evening but lacks a discernible peak in the morning (Fig. 3).
Examination of wind speed and temperature profiles confirms the impact of atmo-spheric stability on the diurnal variability of NOx mixing ratios. During the relatively
tem-ACPD
12, 22309–22353, 2012Atmospheric nitrogen oxides above the Antarctic
Plateau
M. M. Frey et al.
Title Page
Abstract Introduction
Conclusions References
Tables Figures
◭ ◮
◭ ◮
Back Close
Full Screen / Esc
Printer-friendly Version Interactive Discussion
Discussion
P
a
per
|
Dis
cussion
P
a
per
|
Discussion
P
a
per
|
Discussio
n
P
a
per
perature measured at 1 m above the snow and the snow-surface temperature, show a similar asymmetry: as expected, warming and cooling of air always initiate at the surface, but gradients of temperature are consistently larger in the evening than in the morning (Fig. 3). Mixing ratios of NOx mimic that behaviour, as changes (increase or
decrease) always initiate at the surface (Fig. 3b, c). To analyse this further we calculate
5
the bulk Richardson number Rib, a parameter used in profile methods and not subject
to the assumptions of MOST. Ribis the ratio of temperature and wind speed gradients
and describes the ratio of turbulence due to buoyancy (free convection) relative to that due to shear (forced convection) (Jacobson, 1999):
Rib=
g[θv(zr)−θv(z0)](zr−z0) θv(z0)[u(zr)2+v(z
r)2]
(6)
10
with gravitational accelerationg, potential virtual temperatureθv, measurement heights zr,0, and horizontal wind speed components u and v. Wind speed measurements at
3.3 m were scaled to 1.0 m assuming a logarithmic wind profile and by definition wind speed atz0is zero. Throughout most of the day Ribis positive, equivalent to weakly to
very stable conditions (Figs. 3b, 7). Small and negative Rib values around solar noon 15
indicate that the atmosphere has become unstable with most turbulence from wind shear, but some contributions also from buoyancy (Fig. 7). The Rib approach signif-icantly underestimates the daily duration of convective behaviour when compared to the above analysis of L or existing observations (Argentini et al., 2005). We attribute this to systematic errors in the calculation of Ribdue to the uncertainty in the
tempera-20
ture gradients. This is the case during near neutral and unstable conditions when gra-dients are small compared to the temperature measurement error of∼0.5◦C. During
stable conditions this should be less important. In the early evening Rib rises sharply
to a maximum around 18:30 LT, preceding that of NOx mixing ratios by about 1 h. The increase illustrates the drop in wind shear concurrent with a strong temperature
inver-25
ACPD
12, 22309–22353, 2012Atmospheric nitrogen oxides above the Antarctic
Plateau
M. M. Frey et al.
Title Page
Abstract Introduction
Conclusions References
Tables Figures
◭ ◮
◭ ◮
Back Close
Full Screen / Esc
Printer-friendly Version Interactive Discussion
Discussion
P
a
per
|
Dis
cussion
P
a
per
|
Discussion
P
a
per
|
Discussio
n
P
a
per
Later on Rib decreases again as wind shear grows, leading to upward mixing of NOx accumulated near the ground. NO mixing ratios decrease at a quicker rate than mixing ratios of NO2, also reflecting that photolysis of NO2(Reaction R1) is reduced at higher
solar zenith angles (Figs. 3b, 7).
Since the diurnal cycle of sensible heat flux was observed to be fairly symmetrical
5
around noon (see King et al., 2006), the asymmetry in the temperature gradients must be then due to differences in diffusivity of heat Kh between the morning and evening
situation. Indeed, small temperature gradients in the morning are consistent with larger
Kh values when compared to the same hour of day in the evening and illustrate that
convection is a very efficient process for the upward mixing of heat. In the evening the
10
downward heat flux is smaller due to comparatively lower diffusivities. The assumption
that heat is more effectively moved in upward direction away from the snow surface
than towards it is confirmed by the asymmetry in average snow heat flux which had been found to show a minimum of−30 W m−2 at 08:00 LT (outgoing flux) compared to
a maximum of 20 W m−2at 18:00–23:00 LT (incoming) (King et al., 2006). By assuming
15
similarity between Kh and Kc the same argument applies than also to NOx gradients
and flux.
Direct and profile methods have uncertainties. For example, the application of MOST is limited during very stable conditions and likely causes an overestimate ofKh and
corresponding flux during the early evening hours. Conversely, Rib captures well the
20
asymmetry in atmospheric diffusivity which must be present to explain the NOx
cy-cle, but underestimates strength and duration of convection due to systematic errors. Despite of these shortcomings both direct and profile methods suggest that diurnal changes in atmospheric NOx mixing ratios are driven by the diel cycle of atmospheric
stability.
25
ACPD
12, 22309–22353, 2012Atmospheric nitrogen oxides above the Antarctic
Plateau
M. M. Frey et al.
Title Page
Abstract Introduction
Conclusions References
Tables Figures
◭ ◮
◭ ◮
Back Close
Full Screen / Esc
Printer-friendly Version Interactive Discussion
Discussion
P
a
per
|
Dis
cussion
P
a
per
|
Discussion
P
a
per
|
Discussio
n
P
a
per
daily maxima, one in the morning and one in the evening, about equal in size (Thomas et al., 2011). Two daily maxima are consistent with a stability analysis based on profile measurements that revealed a symmetric diurnal cycle of Rib, e.g. unstable conditions
during the day (Rib<0) and stable conditions (Rib>0) during the night (Helmig et al.,
2002). At Halley, the diurnal cycle of NOx mixing ratios follows with some delay solar
5
irradiance. In contrast to Dome C, no convection occurs and during calm periods the boundary layer height remains almost constant throughout the day (King et al., 2006). Mixing in the boundary layer is exclusively driven by wind shear and depends therefore more on synoptic events (King et al., 2006). The diurnal cycle of NOx mixing ratios
is controlled by the snow source and atmospheric halogen mediated chemistry, i.e.
10
formation and uptake of BrNO3 and INO3, which prevents build up of NOx (Bauguitte et al., 2012).
4.2 The NOxsnow source
The 10 min averages of observed NOx flux show some scatter due to noise present
in concentration gradients andKhvalues (Fig. 4c, 8c), but exhibit a close relationship 15
with solar irradiance and atmospheric diffusivity (Fig. 8), as also seen in the median
diurnal cycle for the entire observational period (Fig. 9b). The observation that mixing ratios of NOx in firn air correlate with surface UV irradiance, albeit on some days with a time lag of a few hours (Fig. 8a), confirms that the NOxemission flux originates from
a photolytic source in the upper snow pack, i.e. the photolysis of nitrate (NO−3) in snow.
20
However, the fate of the emissions is then strongly controlled by atmospheric diffusivity.
Noon time NOx flux is typically three times larger than that during night time (Fig. 9b),
a diel pattern that is occasionally disrupted when the diffusivity of the boundary layer
increases leading also to larger NOx flux values (Fig. 8b). The median NOx reveals also a small secondary flux maximum during night time, which is driven entirely by
25
wind shear (Fig. 9). Generally, maximum NOxflux coincides with minimum atmospheric
ACPD
12, 22309–22353, 2012Atmospheric nitrogen oxides above the Antarctic
Plateau
M. M. Frey et al.
Title Page
Abstract Introduction
Conclusions References
Tables Figures
◭ ◮
◭ ◮
Back Close
Full Screen / Esc
Printer-friendly Version Interactive Discussion
Discussion
P
a
per
|
Dis
cussion
P
a
per
|
Discussion
P
a
per
|
Discussio
n
P
a
per
Assuming that NOx snow emissions are uniformly mixed throughout the boundary layer and that the main NOx loss is NO2+OH to form nitric acid (HNO3), one can
calculate NOxproduction rates based on the estimated surface fluxFNOx with
dNOx
dt ∼ FNOx
H −kNO2[NO2]+[OH] (7)
We assume boundary layer depths H of 250 m during the day based on previous
5
sodar records (Argentini et al., 2005) and 10 m during night time following the estimate after Pollard et al. (1973). The resulting mixing time scales,H/u∗, of 27 and 6 minutes, respectively, are again relatively short in comparison to reported NOx lifetimes on the Plateau and justify to a first order the assumption of uniform mixing. The reaction constantkNO2+OH is calculated for Dome C conditions according to recommendations 10
listed in Sander et al. (2006). Measured NO2is used, whereas OH is set to a constant value of 2.0×10⁶molecule cm−3, which corresponds to the 16–31 December mean at
South Pole in 1998 and 2000 (Eisele et al., 2008). Average NOx production rates of
4 and 98 pptv hr−1 are obtained at local noon (11:30–12:30 LT) and midnight (23:30– 00:30 LT), respectively. This indicates that the increase in boundary layer depth during
15
the day offsets by far the concurrent increase in snow emission flux. Chemical loss
rates from the right hand term in Eq. (7) depended here mostly on NO2(Fig. 7b) and
were therefore smaller during the day (3 pptv hr−1) than during the night (13 pptv hr−1). The night time NOx production rate is of the order of magnitude needed to explain the steep evening rise of NOx concentrations from 110 to 300 pptv in about 2 h (Fig. 9a). 20
These results are sensitive to the choice of mixing depth, but suggest that the photolytic snow source has a significant impact on atmospheric NOx concentrations, especially during times of the day when the boundary layer is compressed (Fig. 9). This is also consistent with independent measurements of the stable isotopic composition of at-mospheric particulate nitrate at Dome C which show on a seasonal time scale a clear
25
ACPD
12, 22309–22353, 2012Atmospheric nitrogen oxides above the Antarctic
Plateau
M. M. Frey et al.
Title Page
Abstract Introduction
Conclusions References
Tables Figures
◭ ◮
◭ ◮
Back Close
Full Screen / Esc
Printer-friendly Version Interactive Discussion
Discussion
P
a
per
|
Dis
cussion
P
a
per
|
Discussion
P
a
per
|
Discussio
n
P
a
per
A quantitative description of the NOx snow source is not only important for the un-derstanding of atmospheric boundary layer chemistry above snow surfaces but also for the interpretation of the nitrate record preserved in ice cores. Relevant processes include snow nitrate photolysis, physical transport and mixing of the main photolysis products and chemical reactions. Comparisons of published flux measurements from
5
different sites and model calculations both can help to derive model parameterizations
of NOx emissions from snow.
For example, average and noon time NOx flux estimated at Halley on 2
Febru-ary 2005 were 7.3×10¹² and 12.6×10¹²molecule m−2s−1, respectively (Bauguitte
et al., 2012). However, the latter study simplified flux estimates by linearizing the
10
logarithmic concentration profile, which can induce significant error depending on the inlet heights. Recalculation of the Halley data with Eq. (5) for neutral conditions yields∼20 % smaller values, i.e. 5.9×10¹² and 10.2×10¹²molecule m−2s−1,
respec-tively. At South Pole (2835 m) average NOx flux during 26–30 November 2000 was 3.9×10¹²molecule m−2s−1 (Oncley et al., 2004). It should be borne in mind that this
15
study measured only NO gradients and inferred NOxflux based on atmospheric
photo-chemical considerations (Oncley et al., 2004). Thus, it appears that the seasonal and noon time average NOx flux at Dome C of 6.9×10¹² and 9.4 molecule m−2s−1
(Ta-ble 3) belong to the largest values reported so far from Antarctica and even the Arctic (see overview in Bauguitte et al., 2012). However, the use of inter-site comparisons to
20
test the current model of the NOx snow source remains difficult since instrumentation
and methods to estimate flux vary considerably in between sites (e.g. Bauguitte et al., 2012).
In the following, observed NOxflux is compared with a simple model that calculates potential NO2 production rates from the main NO−3 photolysis channel (Reaction R8) 25
for Dome C conditions. Briefly, the radiation transfer model TUV-snow (Lee-Taylor and Madronich, 2002) was constrained with measured snow optical properties and actinic flux to calculate depth-resolved photolysis rates of nitrate in snow, jNO−
3, for reaction
ACPD
12, 22309–22353, 2012Atmospheric nitrogen oxides above the Antarctic
Plateau
M. M. Frey et al.
Title Page
Abstract Introduction
Conclusions References
Tables Figures
◭ ◮
◭ ◮
Back Close
Full Screen / Esc
Printer-friendly Version Interactive Discussion
Discussion
P
a
per
|
Dis
cussion
P
a
per
|
Discussion
P
a
per
|
Discussio
n
P
a
per
nitrate σNO−
3 and quantum yield of NO
−
3 on ice are used (Chu and Anastasio, 2003).
The values of jNO−
3 and measured profiles of nitrate concentration in the top 1 m of
snow allow computation of a depth integrated NO2 flux, which yielded a median of 3.7×10¹²molecule m−2s−1 during 18 December 2009–21 January 2010 or ∼69 % of
the observed median flux of NOx(Table 2). 5
Comparison of the respective diurnal cycles suggests that the discrepancy between model and observations is due to underprediction of observations during night time, whereas NO2flux modelled during early morning to noon time matches measured NOx
emissions quite well (Fig. 9b). This suggests that a rather simplistic model, which as-sumes NO2to be the main NO−
3 photolysis product (Grannas et al., 2007) and neglects 10
any secondary chemistry or transport processes, can predict noon time NOxemissions
from snow at Dome C. The mismatch during the remainder of the day highlights existing uncertainties in the parameterization of the NOxsnow source:
Firstly, the dynamics of vertical chemical exchange do not affect average daily values,
but determine the shape of the diurnal NOx flux cycle. For example, the observed 15
night time increase in wind shear potentially drives ventilation of NOx which had been temporarily accumulated in the upper snow pack during very stable conditions to the air above it.
Secondly, nitrite (NO−
2) has been proposed to have the potential to contribute to
NOx emissions from snow (Chu and Anastasio, 2007). Surface snow at Dome C was 20
analysed repeatedly for NO−2 during the 2010–2011 field season. The effect of chemical
loss was minimised by placing the sampled snow into bottles already containing the reagents used for analysis, but concentrations were consistently below the LOD of 0.5 ppbw. A major contribution from NO−2 to the NOx flux seems therefore less likely,
but could still explain part of the flux discrepancy.
25
Thirdly, the quantum yield of NO−3 photolysis in natural snow is not well known. It characterises the so-called cage effect, i.e. the tendency of the ice matrix to trap
ACPD
12, 22309–22353, 2012Atmospheric nitrogen oxides above the Antarctic
Plateau
M. M. Frey et al.
Title Page
Abstract Introduction
Conclusions References
Tables Figures
◭ ◮
◭ ◮
Back Close
Full Screen / Esc
Printer-friendly Version Interactive Discussion
Discussion
P
a
per
|
Dis
cussion
P
a
per
|
Discussion
P
a
per
|
Discussio
n
P
a
per
unity (Zhu et al., 2010), whereas that of NO−3 measured by Chu and Anastasio (2003) on artificial ice pellets and used in the model calculation is three orders of magnitude smaller. It follows that the efficiency of nitrate photolysis is highly sensitive to the
lo-cation of nitrate in the snow grain and its potential range could explain the difference
between observed and calculated NOx flux.
5
4.3 The NO2: NO ratio and potential radical concentrations
Ratios of atmospheric concentrations of NO2 and NO observed at Dome C are <1
during daytime and >1 during nighttime, similar to observations at Halley (Fig. 10). Interestingly, they show a height dependency, i.e. values increase between 1.0 and 0.01 m, with maxima in firn air (Fig. 10, Table 2). They can be compared to
steady-10
state ratios predicted by the simple Leighton mechanism (Reactions R1–3): [NO2]
[NO] =
kR3[O3] jNO2
(8)
Ozone measurements were available from Concordia station and NO2 photolysis ratesjNO2 were calculated with TUV-snow using observed O3 columns and assuming
a standard atmosphere under clear-sky conditions. Scaling of modeled actinic flux to
15
broad band UV measurements allowed to account for cloudy skies (see also France et al., 2011). Observed ratios are found to deviate significantly from Leighton steady-state, and they do so more strongly than at Halley (Fig. 10).
The steady-state assumption might not apply since significant snow emissions pre-dominantly in the form of NO2can shift the NO2: NO ratio, i.e. converting average NOx
20
emission flux to a volumetric production rate yields values of the same order of mag-nitude as NO2formation via R3, especially when the air is stably stratified. However, a
closer examination of the median ratios reveals that they are very similar at the 1.0 m and 4.0 m level throughout the day, whereas at 0.01 m and in firn air they differ,
es-pecially during daytime when the emisson flux is at its maximum (Fig. 10). The ratios
ACPD
12, 22309–22353, 2012Atmospheric nitrogen oxides above the Antarctic
Plateau
M. M. Frey et al.
Title Page
Abstract Introduction
Conclusions References
Tables Figures
◭ ◮
◭ ◮
Back Close
Full Screen / Esc
Printer-friendly Version Interactive Discussion
Discussion
P
a
per
|
Dis
cussion
P
a
per
|
Discussion
P
a
per
|
Discussio
n
P
a
per
are therefore suggested to be perturbed by photolytic NO2 release in firn air and at the snow surface, but likely reach a pseudo steady-state after having diffused some
distance away from the snow source, i.e. here to the 1.0 m level.
Deviations from steady-state are then due to oxidants other than O3such as peroxy and halogen radicals and can be accounted for in an extended Leighton ratio as derived
5
in Ridley et al. (2000). For small carbon number peroxy radicals (RO2) kR4∼kR6 and
for XO=BrO, ClOkR4∼0.5kR7. The ratio can then be written as:
[NO2]
[NO] =
kR3[O3]+kR4[OX] jNO2
(9)
where the total radical concentration [OX]=[HO2]+[RO2]+2[XO] (Ridley et al., 2000).
With the extended Leighton ratio we calculate a season mean for [OX] of 7.4×
10
108molecule m−3(38 pptv), which are attributed to radicals if only the above reactions are responsible for the observed shift in NO2: NO ratios. These values are about 9
times the HO2+RO2concentrations observed at South Pole (Eisele et al., 2008) and
3 times those seen at Summit (Sjostedt et al., 2007).
Including observed levels of halogen radicals BrO and IO into Eq. (9) explained the
15
shift in NO–NO2 partitioning in coastal Antarctica (Bauguitte et al., 2012). However, even if halogen radicals were occasionally present at Dome C, coastal levels of∼5 pptv
would be too low to explain a significant part of the inferred shift in NO2: NO. Thus, the
ratios suggest that peroxy radical levels in the boundary layer of Dome C are either significantly higher than measured elsewhere in the polar regions or other processes
20
leading to elevated NO2have to be invoked.
5 Conclusions
First-time observations of both nitrogen oxides, NO and NO2in the interior of
ACPD
12, 22309–22353, 2012Atmospheric nitrogen oxides above the Antarctic
Plateau
M. M. Frey et al.
Title Page
Abstract Introduction
Conclusions References
Tables Figures
◭ ◮
◭ ◮
Back Close
Full Screen / Esc
Printer-friendly Version Interactive Discussion
Discussion
P
a
per
|
Dis
cussion
P
a
per
|
Discussion
P
a
per
|
Discussio
n
P
a
per
troposphere are highly elevated compared to coastal Antarctica. The average NOx lev-els at Dome C appear to be typical for the summer boundary layer of the larger EAIS region as a comparison with NO measurements from a recent airborne campaign sug-gests (Slusher et al., 2010, Table 3). Meaningful site inter-comparisons of NOx and other chemical species need to take into account not only season or latitude but also
5
measurement height, since vertical gradients of mixing ratios can be significant, espe-cially during times when the air is stably stratified. A steady-state analysis of NO2: NO ratios indicates potentially large mixing ratios of peroxy radicals in the air above the snow confirming the existence of an oxidising canopy enshrouding the East Antarctic Plateau.
10
The asymmetry in the characteristic diurnal cycle of NOx mixing ratios at Dome C, i.e. a maximum in the early evening but lack thereof in the morning, is explained as follows: a convective boundary layer develops from the early morning hours reaching maximum heights around mid day. Efficient convective upward mixing of NOx snow
pack emissions and the concurrent increase in boundary layer height prevent build up
15
of vertical gradients and a pronounced maximum in NOxmixing ratios. Contrary to that,
in the early evening strong radiative cooling and temporary decrease in wind shear dur-ing the decay of the convective boundary layer lead to significant accumulation of NOx
mixing ratios from snow emissions above the snow surface. This is supported by strong vertical gradients of mixing ratios and a measured NOxsnow emission flux on the order
20
of magnitude needed to explain the rapid increase in mixing ratios when the boundary layer becomes very shallow (Fig. 9). It is possible that a highly non-linear HOx-NOx
system as seen at South Pole forms at Dome C on a daily basis. Later in the evening a small increase of wind shear gives rise to increases in atmospheric diffusivity and NOx
emission flux, again consistent with observed reductions in gradients of NOx mixing 25
ratios and temperature (Figs. 5, 9). In summary, a strong diurnal cycle of atmospheric mixing ratios of NOxand likely any other chemical tracer with a surface source is driven
by the diffusivity and height of the boundary layer, with the former controlling vertical