Geological Quarterly, 2000,44 (1): 27-3 1
Glacial and periglaeial data integration in a
GIs:
methodology used
in the Serra da Estrcla, Portugal
Gonqalo Teles WEE4
Vieira 0 . T. (2000)
-
Crlaciaf and pcriglaciol data integration in a GIS: mcthodalogy used in the Serra da Estreta, Portugd. Geol. Quart., 44 (1): 27-3 1.The methodology applied in the research in Serra da Estrela (Potttlgal} is to integrate glacial and pcriglacial gcomorphological data in a Geographical Information System and a Database Management System. The main objective of thc procedure is to make use of low cost software for geospatial data integration, statistical analysis and production of geomorphoEogicd mag. The digital storage format provides the means for fast access and easy tmnsportation of Ule data during field cnmpaigns. I t is also a very useful way to store the geomorphologicui data, so it can be used in the future by other researchers working in the area
GonpIa Teles Yreim, Centm de Estrrdas Geogr&cm, Unhvrsidade de Lisboa, Faculdade & L e m , CiAde Universitnriu, 160IF214
L~sboa, Por~ugol; e-maib [email protected] (received: August 12, 1999; accepted: September 27,1999). Key words: PortugaI, Serra dn Esttela, glacinl geomorpholagy, GIs, DBMS.
MTRODUCTION mapping, sedimenhlogical study ofthe d~posits and dating, led to a new lihe of research conducted by investigators from the Physical Geography and Environmental Research Group ofthe
The Serra da Estrela (1,993 m as.1.) is a granitic mountain Centro de Estudos Geogdficos (University of Lisbon), whicli
located in the Iberian Cordillera Central (Fig. I). It is a started in 1995.
significant ma
in
the framework of Quaternary science, as it It became clear very early that the data collection generatedpresents the best preserved glacial and periglacial landscape of signscant amounts of information that would rapidly become Portugal.
ne
geographical position of the mountain at 40"20'N difficult to manage. It was decided to store the data in digital md1 5 ,
and low altihlde make it an important format in order to promote an easy access to information,site for palaeogeographical reconsmction in
the
western availability for statistical analysis, visualisation, printing, etc, European framework. Despite the absence of direct absolute Furthermore, the use o f CD-ROM for data storage should allowdatings, glacial deposits and landfms are attributed to the Last high mobility for the whole database (e,g, during fieldwork Glacial Maximum (Daveaq 1 97 1 ; Ferreira, I 998; Vieira and campaigns)-
Ferreira, 1998). 'I%e more significant periglacial evidences are Taking into account the financial limitations for the research
attributed to the same period, but mom recent periglacial events and the lack of personnel it was decided that the software should
seem to have occurred (Vieira, 1 998). Above ca. 1,750 m a.s.l., be affordable
and
relatively simple to use. Therefore, for themarginal cryogenic processes are active today and play a role in construction and analysis of the cartographic database we use
the morphogenesis. the raster Geographical Information System
IL
WlS CJntegmtedGeneral aspects ofthe glaciation of h e Serra da Estrcla were Land and Water Infomation System) and for the final outputs
fmt pointed out by Lautensach in 1932. In the late 60"s S . the design package Microstation 95 is employed. The alphanu- Daveau defined with a good accuracy the glaciation limits and meric data are stored in a relationaI data basr: management sys-
their chamcteristics (see Daveau, 1971). But until the mid-90's tern (cf. IAEA, 1993). The data transfer between the three pack- research on glacial and perigIacia1
problems
of the Serra da ages is relatively simple but not direct. In the future we intend toEstrela had almost: stopped The need for better knowledge of compile the data in CD-ROM using a current Internet bmwser glaciation, especially rearding detailed geomorphological
as
a viewer (Fig. 2).28 Gonqalo Teles Vieira
I
The examples presented in this paper relate to the geomorphoIogical research carried out in the ZGzere catchment (ca. 62 km2), chosen as the first area to be studied in the Serra da'
Eslxela.
CARTOGRAPHIC DATABASE
The
cartographic database incorporates the spatiaI informa- tion and includes point, line and area (polygon and raster) dataand attribute tables (Fig. 33,
The
GI5
software that is used al- lows the djrect digitising (via digitising tablet or on-screen, us- ing a pointing device) of cartographic data (Budde e& al., 1997; Van Wesren and Parifteh, 1997; Van Westen et a/., 1997). Thedata sources are published maps, aerial photographs, orthophotographic maps and field maps. Georeferenced points also can be entered into the database (e.g. txpostrres of deposits or
GPS
reference marks), Point, line and polygon data are linked to attribute tables. 11ese types of layers can onlybe
used di- rectly for visualisation purposes; for analytical purposes a rastertransformation needs to be performed.
The geomorphoIogica1 data layers constructed in the GIs are to be exported to Microstation 95 and will be used For the
production of detaiIed geornorphological maps of the study
areas.
THE DlGFTAL ELEVATlON MODEL AND DERIVATIVE LAYERS I
The
Zkere
catchment Digital ElevationModel
(DEM)
wasconstructed from a 10 rn contour interval topographic map rasterized using 10 rn pixels. This size allows the detailed loca-
tion of the fentures in the field and a good spatial resolution for
the DEM. Fig. 1. Location of the Serrn da Estrcja in Pottug~l
D a t a b e M a n a g m t
Information System System
-
Ribliographical rcse=mh-
Colle~tiog pre-cxisting m a p-
Awinl photo inlerpmtion-
Sedimentologicol analysisI
Dnta a d y s i sI I
S t m g d A r e h i ~ i yI I
Compufer Aidcd DrawingI
-
Reeonaissancc ofthe terrain-
Dcbiled geommpholog~cal mopping -1dentificalion and sludy d t h e m&e s%psurcs -Photos ond obaemtions-
Dmriptivc I Visualfsation based-
Duailtd gmmorpholo~igicol-
Quantilieatian I Morphamerrienl -StatisticalGlacial and perigIacial data integration in a GIs 29
Digital Elovation Modd
-
TopoPPfic
M P
-
D ~ n e ~ O T k IL.LCssnd&+..m
Geologid map -w . . GeoIom-.r'-
--
b r n
Field survey . ~ i o l d k v s y path8
,
photDgnphs
t + m
Pig. 3. CMogmphic datab1~3c of h e Zhere catEhmeot
I n gempatid analysis, theDEUis
we ofthemast
hpmt From theDEM
itis
pmsibIe h3genemte slope weand
'layers,
as
itis
ibe ~ F W for the ~~nof
ofher topographic q a c t mapsand
withtrigmmelrical
formulae appliedusing
derivative Iayers (e.gslope md wpe@ that
are important iterations, to calculate ashmiow map for a chosen d&and
hourw h b h h
a gemtatisticalapproach
to geomorphologicaI (Vieira, 1999)and
therefore potential radiation mapsmdysis (Fig. 4).
(Feficisimo, 1994;
Meijerhk et d ,1994; Vie& 1999)pig.
4).Slope
Angle Aspect4
Digital Elevatiw
Modd
Potential Radiation (21 Dec)
Potential Insolation (21 Dec)
30 Goado Teles Vieha
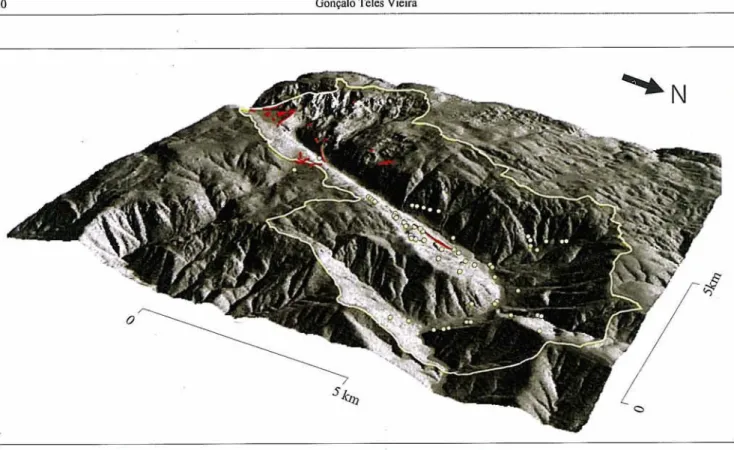
Fig. 5. Display of the Dighi Elevation Model o f the Ztzcrc valley with shaded rcticf as draw file
Tfie Zeztre dcbrnent in markd in yellow, the main m i l = ridges in red and !he dnts reprepent h e exposum of Quaternary deposits
These
are especial& sigdlcantin tbe
study of@ial
and periglacial geommphoIogy.The
DEM can also be used for generation ofcross-sections
and 3-D
vhaIisaeion
of
lhe landscape, ifnecessary, using alsoraster drapes {e,g. geology or
location
ofthemoraines -Fig.5).
Hydrography. Layers with thehydrograpbicd
Wmx include the drainage networkand
theIakes
and dams.
Theywere Wtised from the 1:25,000 topogmphc map. The lakes in
the Serra
da
W acorrespond toold
glacier basins and arerelict glacial forms. A
unique
identEcation was given toeach
of
them, d they are linked to a table usedfor
stmage ofrefated
informdun.The
&&age network layer sems for perfodng morphometrical analysis, and useful information can be retrieved from it enabling thebc-
of
valley floors andcalcuIations derived h m k t parameter.
GeoIogy.
The
geology
layerrwas digitised h m the 1:50,000 g w l o g i ~ l map of the areaq d
represents the substratum.Surface deposits were digitised in a s e p m t e hyer and were
mapped diredy
in
the
field.The
geology
layer
is originaUy apolygon layer connected to a
table
where the mainchwacteristics
of
the geological formations are incIuded. Wheneveran
analysis is tobe
done,
a raster layer with thechosen
lifiological m u t e mustbe
produced (e.g, texture,lithologid
type).Geomorphology.
The
constnrctionof
the
laye13on
the
geomqhologicaI variables is one ofthe main objectives of thestudy that is being carried
out
in the ZEzere valley. The data arein
fact
a result of theresearch
inthe area and therefore their inte- grationproceeds
as new Eeld data become available.The
~0morphoIogid layers include the swlicial depositsand
the
landforms layer. They were constructed using fieldobsmations
and
aerialphoto
hlqretation and their purposeis
to serve
both
for visudisation
and geostatisticalanalysis.
Exposures of deposits are represented in a point map with unique identifiers for
each
deposit and linkedto
a table thatallows
logging their geographical andsedimentoIogica1
characteristics. The unique identifier allows fast access to
fhe
dphagumeric database
of
the deposits, which includesphotographs
andsketches
ofthe
exposum.ALPIMNUMERIC
DATABASEThe
alphanumeric
database incIwles the gem-efmnced point data repmentiug the exposuresof
deposits and pictures taken duringfield
wmk Itserves
both for archiveand
analysis purposes and can be exported to the GIS package.The exposures database is an h u s t i v e
record
of
theexposures
in
Quaternary depositsand holds
photographs andother significant sedimentological
and
interpretativedata
(Fig.6).
The
datq canbe
used
for
statistical analysis and cattographic representation. It is a vrtluableresource
for future research in thearea and aIso for landscape pImning issues
in the
h e w o k of the Smada
EstreIa MaturaI Park, as it allows for rapid W c a t i o nof
the more-
si
depositsand
of
their &m&ristics.Glacial and pcriglacial data integration in a GIS 31
Deposit exposures data Iayer
Deposit exposures data table
D.id Location TL FA MT Coord. x Coord. y Alt (...)
--
USI-t US 1 -esp (,..). . . ... . . .
... C.S 3Ih3 ... . . . ... .,, . . .
...
Photo database
Ph.id D.id Datc Location Catchment Kcy-words Notcs (...I
. . .
... 5km
,
Fig. 6. Organisntion o f the dcposit exposum data in the GIS and DBMS (please note that the survey ofthe exposures in not yet cornplele)The photographs database includes all the pictures (and observations on their characteristics) made during field work. The digital fonnat of the data makes ie especialIy easy for bansportatioi~ and therefore to be carried
in
field campaigns. Inthis way, it is possible to visualise older photos and notes.
CONCLUSIONS
7l1e integration of the glacial and periglacial data of the Serra da Estrela in a GTS constitutes an excellent way for storage
of the data captured and produced during research projects in
the area. This data is easy to retrieve and use, both for visualisation and analytical procedures.
Expected uses for the database include the support for research conducted by investigators of the Centre de Estudos
Geogr3icos and by students ofthe Deparhncnt of Geography of tlie University oflisbon. A project with thc Natural Park of the
Serm da EstreIa is expected in order to promote the use of the database as a tool for planning purposes, especially in what
concerns to the conservation of the geomoiphological assets of
glacial and periglacial origin.
BUDDE P., BROEKEMA L., DOST R., VAN DUREN I. and EELDERIW
L. (1997)
-
ILWIS 2.1 tor Windows, Reference Guide. ILWlSDepartment, ITC. Enschedc.
DAVEAU S. (1971) -Laglaciation & l a Serrn daEstrela. Finistcrm Rev.
Partugucsa Geogr., 15 (1 1): 5 4 0 .
FELIC~SIMO A. M. (1 994)
-
mode lo^ Digitales det Terreno. Introduccibn y apl icaciones en la ciencias ambienlales. Penlalfa. Ovicdo. FERREIRA A. R. (1998)-Short note on the dating prohlcms of the glaciaIand periglncinl events of lhe Serra da Eslrela. in: Glacial and Pcriglaciat Geomorpltology of t l ~ c Serradn Estrela. Guidebook for the field-tr~p (ed.
G. T. Vieira): 24-25. IGU Commission on Ciimate Change and Periglacinl Elmironments, 28-28 August 1998. CEG and Oepartmcntof Geography, University of Lisbon.
lAEA (1993)
-
Guidelines Tor the arganimtioi1 and management o f Earth sciences data on a personal computer, International Atomic E~iergy Agency, Vienna. unpublislied IAEA Tcchnical hcumcnt.MEIJERTNK A. M. J.. DE BROUWER H. A. M., MANNAERTS C. M. altd
VALENZUELA C. R. (1994)- Introduction to the Use o f Geographic Infarmat~on Systems For Practical Hydrology. JTC Publ., no. 23. Enschede.
VAN WESTBW C. and FARTFTEH J. (1997)
-
ILWIS 2.1 for Windows, Users Guide. ILWIS Department, LTC. E~ischede.VAN WESTEN C., SALDAYA LOPEZ A,, U R ! ~ CORNWO P. and
CHAVEI.
ARDANZA G. (1997)-
ILWtS 2.1 for Windows, Applications Guide. I L W S Depnrtrnent, ITC. Eoschedc.V I E I M G. T. (t998)
-
Periglacinl research in the Sern da Eslrela: anoverview. In: Glacial and PcriglaciaI Gcomorpliology o f the Serrn da Estrela. Guidebook for the iield-trip (ed, G. T. Vieirn): 4G-65. IGU Cornmissio~~ on Climate Change and Periglacial Environments. 26-28
August 1998. CEG nndDeparlment ofGcography, UniversityofLisbon. VlEIiiA G. T. (1999)
-
CAlculo do efeito de soinbra corn a Sistema delnforrna~Bn Geogrifico lLWIS 2.1. Docul~lentos de Trabalho, 3, CEG.
Lisboa.
VIEIRA G. T. and FERREIRA A. B (1998)-Gcneral characteristics olthe glacial geomorphology o f thc Serra da Estrela. In: Glacial and Periglocial Geomorphology o f the Serrn da Estrela. Guidebook for thc field-trip (ed. G. T. Vieira): 3748. IGU Commission on Climale Change and Periglacial Environmenk, 2G-28 August 1W8. CEG and