Usefulness of financial statement information in forecasting earnings of high-technology companies
Accounting Master's thesis Raakel Leppähaara 2012
Department of Accounting Aalto University
School of Economics
Aalto University Abstract
School of Economics April 19, 2012
Master’s Thesis Raakel Leppähaara
USEFULNESS OF FINANCIAL STATEMENT INFORMATION IN FORECASTING EARNINGS OF HIGH- TECHNOLOGY COMPANIES
PURPOSE OF THE STUDY
The purpose of this study is to examine whether financial statement information is useful in explaining and predicting the future earnings of high-technology companies.
In addition, the study further analyzes whether the firm-specific uncertainty factors recognized by the prior literature are associated with the forecasting errors calculated from the hold-out sample.
DATA
The data collection consists of 10 642 active and inactive high-tech companies of which 5 341 were listed during 1990-2010. High-tech industries were identified based on the U.S. Bureau of Labor Statistics research which emphasizes companies’
human effort on research and development (Hecker 2005). The earnings forecast model replicates the forecast model of Hou et al. (2010). The study was conducted as a cross-sectional analysis.
RESULTS
The findings of the study indicate that basic financial statement information has explanatory power in association with future earnings based on the IPO sample during 1991-2010. Especially lagged earnings, dividends and accruals were identified to explain future earnings.
When analyzing the forecasting errors in the hold-out sample 2001-2010, the estimated earnings forecast model performed rather well in terms of the precision and bias of the forecasts. Forecasting errors slightly increased with the forecasting horizon. There were no substantial differences documented in the performance of forecasts for IPO and all listed high-tech companies.
The observed forecasting errors could not be explained by the generally recognized uncertainty factors and, therefore, the model should be cautiously applied in high-tech samples.
KEYWORDS
High-technology, earnings forecasting, usefulness of financial statement information, cross- sectional analysis
II
Aalto-yliopiston kauppakorkeakoulu Tiivistelmä
Pro Gradu - tutkielma 19. huhtikuuta 2012
Raakel Leppähaara
TILINPÄÄTÖSTIETOJEN HYÖDYNNETTÄVYYS HIGH-TECH YRITYSTEN TULOKSEN ENNUSTAMISESSA
TUTKIELMAN TAVOITTEET
Tutkimuksen tavoitteena on selvittää, voidaanko tilinpäätösinformaatiolla selittää ja ennustaa high-tech yritysten tulevaisuuden tulosta. Lisäksi tutkimus analysoi, selittävätkö aikaisemmassa kirjallisuudessa tunnistetut yhtiökohtaiset epävarmuustekijät ennustemallin riippumaton otoksen ennustevirheitä.
LÄHDEAINEISTO
Tutkimuksen aineisto koostuu 10 642 aktiivisesta ja inaktiivisesta high-tech yrityksestä, joista 5 341 listautui vuosien 1990–2010 aikana. High-tech toimialojen määritelmä perustui U.S. Bureau of Labor Statisticsin tutkimukseen, joka korostaa yhtiöiden henkilöstön tutkimuspainotteisuutta (Hecker 2005). Tutkimuksessa käytetty tuloksen ennustemalli jäljittelee Hou ym. (2010) tuloksen ennustemallia. Tutkimus toteutettiin poikkileikkausanalyysina.
TULOKSET
Tutkimuksen tulokset osoittavat, että perinteinen tilinpäätösinformaatio pystyy selittämään tulevaisuuden tulosta 1990–2010 aikana listautuneiden yhtiöiden otoksessa. Etenkin edellisen tilikauden tulos, osingot ja jaksotukset todettiin selittävän tulevaa tulosta.
Estimoitu ennustemalli toimii kohtalaisen hyvin, kun analysoidaan riippumattoman otoksen (2001–2010) ennustevirheiden suuruutta ja suuntaa. Ennustevirheet kasvavat hieman ennusteajan pidetessä. Mallin toimivuudessa ei havaittu merkittäviä eroja verrattaessa ennusteita juuri listautuneiden ja kaikkien listautuneiden high-tech yhtiöiden välillä.
Ennustevirheitä ei kyetty selittämään yleisesti tunnetuilla epävarmuustekijöillä ja tämän vuoksi mallia tulisi käyttää varoen high-tech otoksissa.
AVAINSANAT
High-tech, tuloksen ennustaminen, tilinpäätösinformaation hyödynnettävyys, poikkileikkausanalyysi
III Acknowledgements
This year has been a year of change not least because of this master thesis and the upcoming graduation. This year has also taught a lot, taught me to survive the downturns and to enjoy the ray of light. I would not have accomplished these changes without the sincere support of several people. I am deeply grateful to all of those people who contributed in this process.
First my deepest thanks to my supervisors. Harri Seppänen, Assistant Professor at Aalto University School of Economics, encouraged me through the whole process and offered all his expertise when I needed it the most. Juha Kinnunen, Professor of accounting at Aalto University School of Economics, provided the utmost important and supportive feedback. I would also like to thank my fellow student and “partner in crime”, Saara Hietanen, who gave valuable support in the data collection phase.
Thanks to my co-workers for understanding the pressure to accomplish this piece.
Then my friends, first my profound apologies that I have not been there for you during this process, and at the same time, thank you for still being there for me.
But lastly, my dearest thanks to my family. Thank you Mom for nursing me when I was at my weakest. Thank you Dad for setting everything up as you have always done for me. And Laura, thanks for cheering up and giving me a shelter when I really needed it.
Helsinki, April 19, 2012 Raakel Leppähaara
IV
TABLE OF CONTENTS
1 Introduction ...2
1.1 Background ...2
1.2 Research question ...2
1.3 Sample and methods ...3
1.4 Results ...4
1.5 Implications ...5
1.6 Structure of the study ...6
2 Prior research on earnings forecasting...7
2.1 Introduction to earnings forecasting ...7
2.1.1 Motivations of earnings forecasting ...7
2.1.2 Development of earnings forecasting research ...8
2.2 Main trends in earnings forecasting research ...10
2.2.1Mean reversion of earnings and profitability ...10
2.2.2Time-series estimation ...10
2.2.3Cross-sectional estimation ...11
2.3 Multivariate earnings forecasting models ...12
2.3.1Recent models using accounting variables ...12
2.3.2The DuPont model in earnings forecasting...16
2.3.3Industry-level forecasting models ...17
2.4 Forecasting errors and uncertainty factors ...18
3 Prior research on high-tech’s future performance ...21
3.1 High-tech IPO markets ...21
3.2 High-tech firm specific characteristics and financial reporting ...23
3.2.1Firm specific characteristics ...23
3.2.2Financial reporting ...25
3.3 Operating performance and valuation of high-tech companies ...27
3.3.1Operating performance ...27
3.3.2Financial statement information in relation to valuation ...30
V
4 Research design ...35
4.1 Predictions ...35
4.2 Empirical model ...36
4.3 Variable descriptions ...37
4.4 Definition of high-tech industries and sample selection ...40
4.4.1 Definition of high-tech industries ...40
4.4.2 Sample selection...42
4.4.3 Information collection ...43
4.4.4 Subsamples of the explanatory and estimated forecast models ...44
5 Empirical results ...46
5.1 Descriptive statistics...46
5.1.1Sample companies ...46
5.1.2Variables ...48
5.1.3Correlations ...50
5.2 Explaining future earnings ...52
5.2.1Linear regression results ...53
5.2.2Ordinal regression method ...54
5.2.3Ordinal regression results ...55
5.3 Forecasting future earnings...59
5.3.1 Estimation of the model...59
5.3.2 Forecasting errors ...60
5.4 Explaining forecasting errors ...64
5.4.1 Descriptive statistics ...64
5.4.2 Regression results ...66
6 Conclusion ...69
REFERENCES ...73
APPENDICES ...79
VI List of Tables
Table 1. Expected signs of the variables. ...40
Table 2. Level 1 high-technology industries (Hecker 2005, 64). ...42
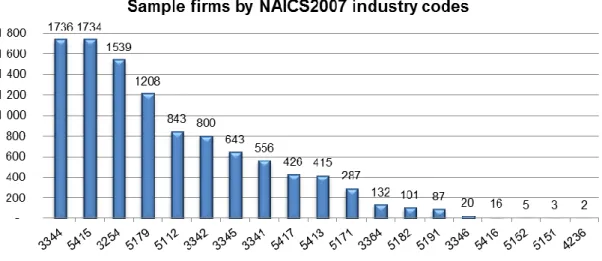
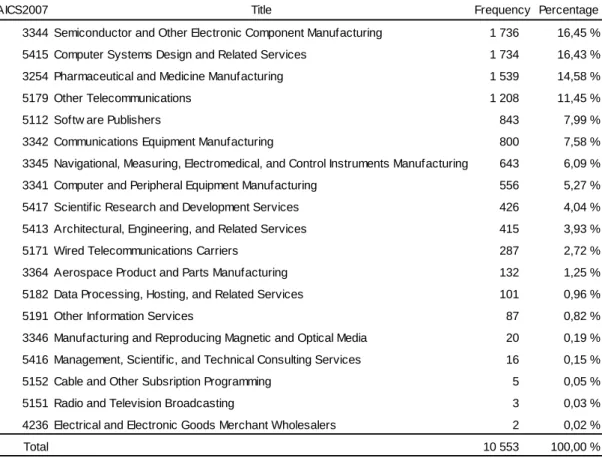
Table 3. Industries of all listed high-tech companies 1990-2010. ...48
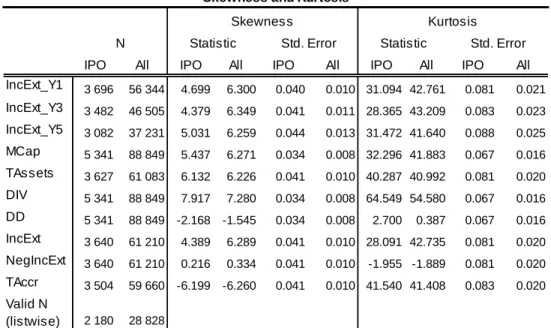
Table 4. Kurtosis and Skewness statistics after winsorizing. ...49
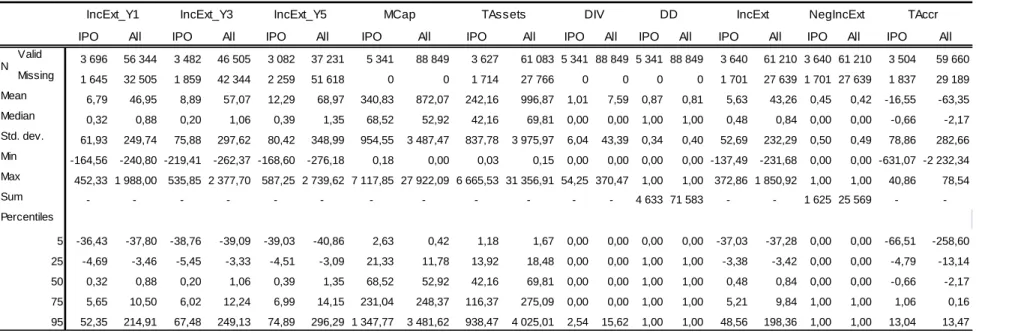
Table 5. Descriptive statistics of the explanatory model. ...51
Table 6. OLS and ordinal regression results of the IPO explanatory model. ...56
Table 7. Model fitting and Goodness-of-Fit results of the ordinal regression. ...57
Table 8. OLS regression results of the estimated earnings forecast model. ...61
Table 9. Bias, precision and one-sample t-test results of the forecasts. ...62
Table 10. Descriptive statistics of the uncertainty factors. ...65
List of Figures Figure 1. Composition of ROA in connection to ROE (Trotta 2003, 153). ...17
Figure 2. Sample selection and information collection process. ...41
Figure 3. Analysis of the empirical results. ...46
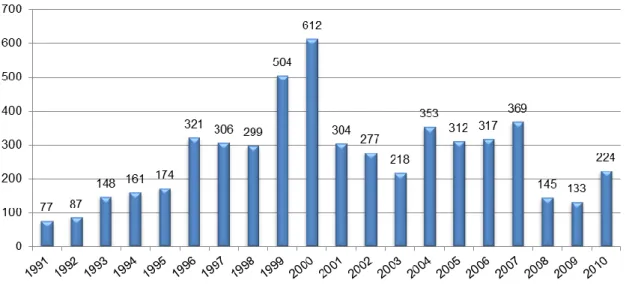
Figure 4. Industries of all listed high-tech companies 1990-2010. ...47
Figure 5. High-tech IPOs during 1991-2010. ...47
Figure 6. Bias of the forecasts for all and IPO companies. ...62
Figure 7. Percentage of positive bias forecasts. ...63
Figure 8. Forecasting error categories in precision. ...64
2
1 Introduction
1.1 Background
Earnings forecasts are often incorporated into analyses of the future performance and value of companies. Past research has extensively addressed the usefulness of accounting information in valuation and predicting earnings. Financial statement information is useful for investors if they can exploit it to forecast earnings and evaluate the risk associated to future earnings (Richardson et al. 2010). Useful information should be relevant and reliable.
Relevant financial information makes a difference in investment decisions and has predictive and confirmatory value (IFRS Framework 2010). “To date, very little research combines multiple accounting attributes to forecast future earnings or returns” (Richardson et al. 2010, 412). On the other hand, there is lack of generally agreed variables which should be included in earnings forecast models (Richardson et al. 2010).
Especially the usefulness of financial statement information in high-tech context has been widely debated (see e.g. Keating 2000, Demers & Lev 2001, Hand 2000, Bowen et al. 2002, Trueman et al. 2000). Keating (2000, 163) captures the essential idea of analyzing the financial performance of high-tech companies: “New economy firms are of particular interest because of concerns about whether the traditional accounting model can be used to value firms in instances where most of that value consists of growth opportunities”. High-tech industries are of particular interest also because high-tech is commonly referred to the economic growth of economies, the source of employment growth, innovation and technological opportunities (see e.g. OECD Science, Technology and Industry Scoreboard 2005, Tong 2005, Kask & Sieber 2002).
High growth potential, but also a high degree of uncertainty, characterizes the technological markets. Volatile earnings, young age with lack of historical data and the intangible intensive business model impede the forecasting of high-tech firms’ performance compared with more established, seasoned firms (Trueman et al. 2000). Uncertain prospects may also result in positive unexpected performance. For instance, analysts tend to underestimate the earnings of Internet firms (Trueman et al. 2001). Moreover, financial press is currently arguing the social media bubble related to the new and possible IPOs of social media firms (e.g.
LinkedIn, Facebook, and Twitter, see e.g. Helsingin Sanomat 13 July, 2011).
1.2 Research question
Motivated by the challenges and importance of high-technology industry, the objective of the thesis is to analyze whether financial statement information is useful in explaining and
3
predicting the future earnings of high-tech companies. Briefly, the research question can be stated as:
Does financial statement information have explanatory and predictive power with respect to the future earnings of high-technology companies?
The study is executed as a fundamental analysis of accounting-based metrics which presumably have explanatory and predictive power in association with the future earnings of high-technology companies. The performance of the earnings forecast model is evaluated in terms of the bias and precision of the forecasts. In addition, the study further analyzes whether the uncertainty factors recognized by the prior literature are associated with the forecasting errors of the estimated earnings forecast model.
1.3 Sample and methods
The study is carried out by analyzing the financial statements of global listed high-technology companies from 1990–2010. The data is retrieved mainly from Thomson Reuters database.
High-tech industries were identified based on the U.S. Bureau of Labor Statistics research which emphasizes companies’ human effort on research and development (Hecker 2005). In total, 10 642 active and inactive companies were identified operating in high-tech industries and of which 5 341 firms were listed during 1991-2010.
Firstly, the explanatory power of accounting metrics was analyzed with the sample of newly listed high-tech firms during 1991-2010. The IPO sample was used because the accounting has been argued to poorly capture the economics of high-tech firms (see e.g. Lev & Zarowin 1999, Francis & Schipper 1999). The earnings forecast model used in this study replicates the forecast model in Hou et al. (2010). Large cross-sectional analyses across industries have proven the applicability of the model. Lee et al. (2011) find that Hou et al.’s (2010) earnings forecasting model produces reliable forecasts in their comparison of the implied cost of capital (ICC) estimates. However, the model has not yet been tested in industry-level context. The independent variables of the model include basic accounting variables, for instance total assets, dividends paid, lagged earnings and accruals, completed with market capitalization. The dependent variable consists of absolute dollar earnings of one, three and five years ahead. The data was first analyzed with multivariate OLS regression. However, the results of the explanatory power are founded on the ordinal logistic regression because of the statistical issues encountered in OLS regression analyses. For the ordinal regression, the dependent variable was divided into 20 equal sized groups based on the size of the future earnings.
4
Secondly, for the analysis of predictive power, high-tech companies were divided into two samples, IPOs and all listed companies. The split was made to compare whether the forecasts for IPOs are less accurate than the forecasts for seasoned firms. Hou et al.’s (2010) model was estimated based on the cross-sectional analysis of the data from 1990- 2000 and tested in a hold-out sample from 1991-2010. The model was estimated with multivariate OLS regression separately for both samples and the forecast horizons of one, three and five years. The predictive performance of the model was analyzed in terms of bias and precision of the forecasts in the hold-out sample. Precision describes the absolute deviation of the expected value from the actual earnings (calculated as abs(actual – expected)). Bias takes into account the direction of the error. Bias is defined as the raw difference of the expected value from the actual earnings (calculated as actual – expected).
Both statistics are scaled by market capitalization.
Thirdly, the study examines whether the uncertainty factors recognized by the prior literature are associated with the estimated forecasting errors of the hold-out period 2001-2010 with the samples of IPO and all listed high-tech companies. Uncertainty factors include firm age, sales growth, analyst coverage, research and development expenditures and intangible assets. Both the bias and precision of the forecasts were tested as dependent variables. The association of the uncertainty factors with the forecasting errors was first analyzed with OLS regression but also binomial logistic regressions were employed.
1.4 Results
Regarding the explanatory power of the model, the findings indicate that financial statement variables provide valuable information regarding the future earnings of newly listed high-tech companies. These results are founded on the ordinal regression analysis where the future earnings were divided into 20 equal sized groups based on the size of the future earnings.
Ordinal regression was employed because of the statistical problems encountered in OLS regression. Especially lagged earnings, dividends and accruals were identified to explain future earnings whereas the relation of the size variables (market capitalization and total assets) to future earnings was weak. In a conclusion, financial statement information is useful in explaining the future earnings of newly listed high-tech firms.
Usefulness of financial statement information requires that the riskiness of forecasted earnings should be reliably evaluated (Richardson et al. 2010). When analyzing the predictive power of the model, overall, the Hou et al.’s (2010) model performed rather well in terms of the precision and bias of the forecasts in the hold-out sample. Previously, the model has only been tested in large pooled samples across industries (see Lee et al. 2011).
Contrary to the findings of Hou et al. (2010), the bias of the forecasts in both samples was
5
close to neutral or slightly positive with an average bias of 0.045 for IPOs and 0.09 for all listed firms over all forecasting horizons. Surprisingly, the earnings forecast model did not perform better with the sample consisting of all listed high-tech companies than with the IPO sample. In fact, the performance of the model was rather similar with both samples in terms of mean and median errors in precision. The forecasting errors tend to increase with the forecast horizon, however, the increase was not substantial. Approximately half of the forecasts in both samples and throughout the forecasting horizons produced forecasting errors within 10% of the market value. In a conclusion, financial statement information is useful in forecasting the earnings of high-tech firms.
The association of the uncertainty factors with the estimated forecasting errors was examined to improve the Hou et al.’s (2010) model. There was no conclusive evidence found that the chosen uncertainty factors explain either the precision or bias of the forecasts in the hold-out sample. These findings impact on the applicability of Hou et al.’s (2010) model in high-tech context. Even though the model seems to perform rather well in terms of the precision and bias of the forecasts, the observed forecasting errors could not be explained by the generally recognized uncertainty factors. In order to improve the forecasting model of Hou et al. (2010), the root causes of the forecasting errors should be identified. Meanwhile, the model should be cautiously applied in high-tech analyses. In a conclusion, the uncertainty factors do not improve the Hou et al.’s (2010) earnings forecast model.
1.5 Implications
The findings of this study have several practical implications. Firstly, the results of the study provide confirmatory evidence that financial statement information is useful in analyzing high- tech firms’ future earnings. Basic accounting variables are documented to have explanatory power for the future earnings of IPOs in high-tech context which is generally recognized as hard to predict.
Secondly, the study provides some answers to Richardson et al.’s (2010) question which variables should be included in earnings forecasting models. The findings of the study indicate that lagged earnings, dividends and accruals have explanatory power in relation with future earnings.
Thirdly, the results benefit especially the investors and analysts evaluating the performance of high-tech firms. Based on the findings of the study, Hou et al.’s (2010) cross-sectional multivariate model does fairly good job in forecasting of the earnings of high-tech firms. The model performed rather well in terms of the bias and precision of the forecasts in an out-of- sample test. Also the variance in the earnings with longer forecast horizon was captured by
6
the model. Financial statement information seems to take into account the uncertainty factors recognized by the prior literature because the findings indicate that none of the uncertainty factors explained the forecasting errors. However, the high-tech firms are generally identified to be hard-to-predict and, therefore, it is not surprising that there are also some large forecasting errors detected. Still, approximately half of the forecasts for IPOs and all listed high-tech firms produced forecasting errors within 10% of the market value throughout the forecasting horizons. The forecasts of absolute dollar earnings can also be compared with the analysts’ estimates. However, further analysis of the forecast errors produced by the model is left for future research. Factors causing the forecasting errors should be identified in order to ensure the quality and applicability of the earnings forecast model.
1.6 Structure of the study
The study is structured as follows. Chapter 2 provides insight into prior literature on forecasting earnings. The chapter covers the main trends in earnings forecasting and presents recent multivariate earnings forecast models. Chapter 3 continues with outlining the empirical studies related to high-tech firms’ future performance. Especially the usefulness of financial statement information in context of high-tech industries is discussed. Chapter 4 describes the research design including the expectations and sample of the study. Results of the empirical analyses are presented in Chapter 5. Lastly, Chapter 6 concludes the study as well as gives proposals for future research.
7
2 Prior research on earnings forecasting
2.1 Introduction to earnings forecasting
The goal of this chapter is to review the prior earnings forecasting literature. First, the purpose of forecasting earnings and the development of earnings forecasting research are discussed. Then the main trends in prior empirical studies including the mean reversion of earnings and profitability as well as time-series and cross-sectional estimation are reviewed more profoundly. Recent forecasting models using accounting variables as predictors of future performance are introduced first in Chapter 2.3. The DuPont model is briefly discussed in order to understand the properties of earnings. Also the usefulness of forecasting at industry-level is surveyed since this study is focused on a specific industry, high-tech. Lastly, the uncertainty factors commonly related to forecasting errors are discussed in Chapter 2.4 and, in fact, there are several uncertainty characteristics which can be recognized in the firms operating in high-tech industry.
2.1.1 Motivations of earnings forecasting
Forecasting firms’ operating performance and earnings can be motivated by several approaches. The Framework of International Financial Reporting Standards emphasizes the qualitative characteristics of useful financial information (IFRS Framework 2010). Useful information should be relevant and reliable. Information which makes a difference in decision making is defined as relevant information. Relevant information should have predictive value and confirmatory value. Richardson et al. (2010) conclude that the financial statement information is useful for investors if they can use the information for forecasting earnings, evaluating the riskiness of these earnings and finally make an analysis of the firm value.
Forecasting companies’ performance is important for investors but also for other stakeholders. “Managers need forecasts for planning and to provide performance targets;
analysts need forecasts to help communicate their views of the firm’s prospects to investors;
bankers and debt market participants need assess the likelihood of loan repayment.” (Palepu et al. 2007, 260) The key motivation for investors to forecast earnings is the link between companies’ expected performance and stock valuation. Valuation requires knowledge of future earnings and cash flows (Kinnunen 1988). Beaver (1998) argues that the current earnings provide information to predict future earnings. Bowen et al. (1986) note that the earnings based on accrual accounting provide valuable information about future cash flows.
Kothari (2001) presents five key motivations for research on earnings forecasts. First of all, valuation models often employ either directly or indirectly earnings forecasts. Discounted
8
cash flow model uses forecasted earnings as proxy for future cash flows. In addition, the residual-income valuation model requires knowledge of net “normal” earnings. Secondly, in the calculations of security returns, researchers frequently use earnings forecasts as a benchmark for unexpected earnings. Thirdly, earnings forecasts are often analyzed in the evaluation of market efficiency. Fourthly, the research requires knowledge of the “normal”
earnings for a comparison to manipulated earnings. Earnings management is based on the choices of the management in accounting procedures. The last motivation Kothari (2001) lists concerns the informative input of analysts’ and management’s forecasts for the capital market.
2.1.2 Development of earnings forecasting research
Forecasting earnings has been a research topic for a rather long time and there can be some main trends recognized. The research started from the time-series analysis of earnings by exploiting the random-walk and random-walk with a drift methods. Then the research headed towards more complex models taking into account different accounting variables. Univariate and time-series models turned into multivariate and cross-sectional models. Also new aspects in earnings’ behavior including the mean reversion of profitability and earnings were discovered. Next, these development phases are discussed more in detail.
Earnings forecasting literature is usually linked to capital market research and, particularly, to its usefulness in stock valuation. Brown (1993) surveys the studies on earnings forecasting mainly from the 1970s and 1980s. It has been argued that, prior late 1970s, most earnings forecasting studies lacked implications for capital market research. Previously, the focus was solely in the accuracy of the earnings expectation models. Researchers concentrated to provide evidence whether the annual earnings followed a random walk process. Several times the researchers failed to disprove the power of the random walk process. For instance, autoregressive integrated moving average (ARIMA) models were extensively tested but the findings indicated that the earnings forecasts of ARIMA models were not more accurate than the random walk models. (Brown 1993)
Brown (1993) uses a term “association approach” for describing the research trend which was developed especially in the 1980s. The association approach linked the capital market performance and earnings forecasts. In capital market research, the earnings forecast models have been used to measure earnings expectations (Brown 1993). Foster (1977) was amongst the first ones to focus on the accuracy of earnings expectation models in relation to abnormal stock returns. Brown (1993) questions whether the best earnings forecast model in terms of accuracy actually has the strongest association with abnormal returns. After finding the association between earnings forecasts and capital market reactions, the main trend in
9
the research was to combine two worlds, accounting and finance, in different ways. For example, in the 1980s, the researchers evaluated analysts’ earnings forecasts and, in fact, found that analysts’ forecasts were actually more accurate than the time-series models at that time (see e.g. Fried & Givoly 1982, Brown et al. 1987). Earnings forecasting research maintained the link to capital market research but examined also the time-series properties of earnings and pure earnings forecasting. (Brown 1993)
Kothari (2001) reviews the capital market research in accounting, in other words, the relation between capital markets and financial statement information, focusing on the studies of the late 1980s and 1990s. The researcher suggests that a major academic challenge lies in the absence of rigorous theory for the time-series properties of earnings (Kothari 2001, 124).
Kothari (2001) categorizes earnings forecasting to the methodological research of capital markets. Earnings forecasting research includes the research on the properties of time series, the management’s and analysts’ earnings forecasts and the earnings growth rates.
Forecasting earnings is useful also in defining firms’ cost of capital. Analysts’ earnings estimates are often employed as an earnings expectation in the cost of capital models. Hou et al. (2010) presents a new method to estimate earnings expectations in their cost of capital model. Hou et al. (2010) use a cross-sectional analysis to estimate an earnings forecast model based on accounting variables. Also Lee et al. (2011) have employed the model of Hou et al. (2010). This earnings forecast model is tested in this study. The model is discussed in detail in Chapter 2.3.1 and in the empirical part in Chapter 4.2.
Richardson et al. (2010) survey the recent research, papers published after 2000, on forecasting future earnings and returns. Richardson et al. (2010) emphasize the significance of financial statement information for investors. “An investor can use information in these statements to forecast earnings for the reporting entity, estimate the risk of these earnings and ultimately make an assessment of the intrinsic value of the firm that can be compared to observed market prices” (Richardson et al. 2010, p. 410). Richardson et al. (2010) recognize that there are still interesting topics for future research in this field of studies. For instance, the researchers state that to date there are still very little study on forecasting future earnings or returns which combines multiple accounting factors or uses macroeconomic data. In fact, Richardson et al. (2010) document that there is lack of generally agreed variables which should be included to earnings forecast models. However, Manegold (1981) reminds that the accuracy of multivariate earnings forecasting models appears not to be substantially better than the accuracy of less sophisticated univariate models. Also the additional costs of developing a complex multivariate model have to be taken into consideration.
10 2.2 Main trends in earnings forecasting research
2.2.1 Mean reversion of earnings and profitability
Predicting annual earnings is often linked to the mean reversion of earnings and profitability.
Stigler (1963, 54) states that “ -- under competition, the rate of return on investment tends toward equality in all industries. Entrepreneurs will seek to leave relatively unprofitable industries and enter relatively profitable industries”. Furthermore, above-normal profitability should not be sustainable due to competitive markets. In a competitive environment, profitability should be mean reverting within as well as across industries (Fama & French 2000). The mean reversion of profitability and earnings would lead to a situation where the changes in profitability and earnings are to some extent predictable (Fama & French 2000).
However, accounting conservatism and litigation risk result in negative correlation in earnings since managers tend to recognize losses more quickly than positive outcomes (Kothari 2001). Furthermore, managers are motivated to take “big baths” in earnings and firms often recognize anticipated losses which make losses less permanent (Kothari 2001). Large changes in earnings are documented to reverse more rapidly than small changes and negative changes are documented to reverse faster than positive changes (Fama & French 2000).
Fama and French (2000) study the mean reversion of earnings and profitability. The researchers note that existing forecasting literature is focused primarily on the mean reversion of earnings instead of the mean reversion of profitability. Fama and French (2000) find in their cross-sectional analysis that profitability is mean reverting. There appears to be a predictable variation in earnings due to the observed mean reversion of profitability (Fama &
French 2000). Also Allen and Salim (2005) examine the mean reversion of profitability in the UK companies during 1982-2000. Allen and Salim (2005) apply the same method as Fama and French (2000). The findings in the British sample support the results of Fama and French (2000). Fama and French (2000) state that the earnings forecasts should exploit the observed mean reversion in profitability. However, Kothari (2001) notes that, according to prior literature, the predictive ability of mean reversion is not better than a random walk model in out-of-sample testing.
2.2.2 Time-series estimation
Forecasting earnings has often been studied as a time-series analysis. Brown (1993) surveys that the random walk model of earnings is extensively discussed in the research of earnings properties. According to prior research, “a random walk or random walk with drift is a reasonable description of the time-series properties of annual earnings” (Kothari 2001,
11
145). However, Kothari (2001) points out that the random walk in earnings is not supported by any economic theory. In addition, the time-series approach in earnings forecasting is argued to be lacking important information which could be achieved via cross-sectional estimation. Fama and French (2000) assert that one of the key weaknesses in the time- series forecasting of earnings is the shortage of time-series observations available for several companies. Often there is no required data for the whole time-series for each sample company. If these companies with incomplete data are excluded from the research, the results may exhibit survivor bias which implies that there may be more observations of positive earnings changes (Fama & French 2000). The survivor bias issue is especially discussed in the high-tech research since the survival of these smaller, young and unprofitable companies is questioned (see e.g. Demers & Joos 2007). In addition, Kothari (2001) argues that the time-series estimation exhibit low explanatory power due to both large standard errors and survivor bias. Kothari (2001) even proposes that these weaknesses of time-series estimations lead to preferring the random walk in annual earnings forecasts.
2.2.3 Cross-sectional estimation
In a cross-sectional analysis, the estimation is performed annually across all firms.
Conclusions are based on the annual parameter estimates from the cross-sectional regressions. Cross-sectional method originates from Fama and MacBeth’s (1973) research and Fama and French (2000) introduced the method in earnings forecasting. There are several benefits discovered in using the cross-sectional method in forecasting. Cross- sectional analysis allows exploiting a large sample data throughout a long time period.
Kothari (2001) states that generally cross-sectional analysis enhances the power in estimations compared to time-series estimation and reduces the issue of survivor bias.
Furthermore, economic determinants, for example inflation, may be incorporated in the cross-sectional analysis.
There are also observed weaknesses in a cross-sectional estimation. One of the most significant drawbacks is the loss of the firm-specific time-series properties (Kothari 2001).
Allen and Salim (2005) as well as Fama and French (2000) argue that the correlation of regression residuals across firms is not often taken into account in the standard errors of the regression. This correlation has been a problem in the prior research employing cross- sectional estimation (Allen & Salim 2005). Furthermore, the researchers question the underlying assumption that “there is no correlation across firms in current changes in the dependent variables earnings or profitability driven by common macroeconomic or industry shocks beyond those picked up by lagged predictor variables” (Allen & Salim 2005, 2010).
The assumption has to be carefully analyzed especially in the case of high-tech firms and the
12
high-sentiment periods of Internet companies, for example, the Internet boom in the beginning of the 2000s. Moreover, financial press is now discussing the rise and possible second bubble created by the social media companies (e.g. LinkedIn, Facebook, and Twitter, see e.g. Helsingin Sanomat 13 July, 2011).
2.3 Multivariate earnings forecasting models
2.3.1 Recent models using accounting variables
This study is focused on the forecast models using accounting information. The studies of Fama and French (2000, 2001, 2006) Hou et al. (2010), Hou and van Dijk (2010), and Hou and Robinson (2006) have developed multivariate earnings and profitability forecasting models which are mostly based on accounting variables. These studies employ either profitability or earnings forecasts as tools for further analysis of stock returns. For instance, Hou and van Dijk (2010) and Hou and Robinson (2006) both examine the explanatory power of profitability shocks in relation to stock returns. In Hou et al. (2010), the researchers exploit their earnings forecasting model in calculating the implied cost of capital.
The recent studies often utilize the findings of Fama and French (2000). Fama and French (2000) investigate the mean reversion of earnings and profitability. Forecasting earnings and profitability are commonly linked to the studies of mean reversion of earnings and profitability. Fama and French (2000) construct their model of very basic accounting variables. The explanatory variables include market value to total assets, dividend dummy variable for firms not paying dividends and dividends to book value of equity. Dividends are expected to have information about future earnings and firms not paying dividends are found to be less profitable than the dividend paying companies (Fama & French 2001). In fact, Fama and French (2001) document that the larger and more profitable firms are more likely to pay dividends whereas firms with heavy investments, efforts in R&D and higher market value of assets to book value are less likely to pay dividends. However, the number of firms paying dividends has declined dramatically from the late 1970s to late 1990s (Fama &
French 2001). Market value is chosen for the model since market value should reflect the current value of future net cash flows. Market value also completes the model by picking up the variation in expected profitability missed by the dividend variables (Fama & French 2000). The researchers chose this parsimonious model after testing different additional variables, for example, the logarithm of total assets as a measure of firm size. Fama and French (2000) find that all the chosen explanatory variables including the dividend dummy, dividends paid and market value have explanatory power to future profitability. Dividends to book value of equity are positively related to expected profitability. Also market value is found to have a strong positive association with profitability.
13
Fama and French (2006) analyze expected profitability in the study of expected stock returns. The researchers suggest that expected profitability is one component explaining the future stock returns. The constructed proxy for expected future profitability employs accounting fundamentals: a dummy variable for negative earnings, lagged profitability, accruals to book equity separately for positive and negative accruals, an investment variable including the change in assets to lagged assets, a dummy variable for firms not paying dividends and dividends to book value. The model is rather similar to Fama and French (2000) but it is completed with additional accounting variables. Lagged profitability is added since it tends to be persistent over time. Also the logarithm of market capitalization is included in the model because smaller firms tend to be less profitable.
Fama and French (2006) find that lagged profitability has the strongest forecasting power and it is considerably persistent. Profitability is found to be mean reverting similarly to Fama and French (2000). Also the results on dividends are in line with Fama and French (2000) meaning that firms not paying dividends are less profitable in the future. Firms with higher book-to-market ratio are found to be less profitable. For the additional variables, Fama and French (2006) document that lagged asset growth is negatively related to future profitability and growth in earnings. Negative coefficients for accrual variables support the prior literature findings that accruals result in transitory variation in earnings. In detail, the reversal of positive accrual occurs faster but both negative and positive accruals have long-run transitory effects. Also Sloan (1996) documents that higher current accruals indicate lower future profitability. Richardson et al. (2010) argue that investors do not understand the time- series impact of accruals when constructing earnings forecasts and, therefore, accruals are reflected in market prices. The phenomenon where the investors incorrectly weight the accrual information is called accrual anomaly and it is widely studied in prior research (see e.g. Sloan 1996). However, Richardson et al. (2010) argue that the anomaly has gradually decreased in recent years.
Motivated by the argument that analysts do not often follow and, thus, forecast earnings of small and distressed companies, Hou and van Dijk (2010) construct a cross-sectional model based on accounting variables to forecast profitability. The model is employed to examine whether the disappearance of size effect in realized returns can be explained by unexpected shocks in profitability. Profitability shock is considered to be the difference between the realized and expected profitability. Also Hou and Robinson (2006) examine cash flow shocks with almost similar method as Hou and van Dijk (2010) but Hou and Robinson (2006) consider the profitability shock as a regression error of the constructed model for expected profitability.
14
Hou and van Dijk (2010) replicate the models used in Fama and French (2000, 2006). The dependent variable earnings at year t+1 is divided by lagged total asset. The explanatory variables include market value to total assets, a dummy variable for dividend payers (value of 0), dividends to book equity and lagged earnings scaled by total assets at the time of t-1. The variables are winsorized at the 0.5 and 99.5 percentiles in order to avoid the interference of extreme values especially in the scaled variables. However, the robust tests indicate that the results are in line with and without winsorizing the variables. Following Fama and French (2006), Hou and van Dijk (2010) test also the effect of additional variables, such as asset growth, negative earnings dummy, and positive and negative accruals. The test results indicate statistically significant coefficients for most of these additional variables but those are ignored in the further examination as they do not enhance the overall explanatory power.
Hou and van Dijk (2010) argue that, according to prior studies, small firms have experienced large negative profitability shocks after the early 1980s whereas bigger firms have encountered large positive shocks compared with expected profitability. The results confirm these expectations. All explanatory variables including market value to total assets, a dummy variable for dividend payers, dividend payments to book equity and lagged earnings scaled by total assets are statistically significant at the level of 0.01 and adjusted R2 for the model is approximately 60 percent. Hou and Robinson (2006) note that the inclusion of lagged profitability increases the regression R2 values compared with Fama and French (2000).
Otherwise the results follow the studies of Fama and French (2000, 2006) and Hou and Robinson (2006) since market-to-book and dividend-to-book ratios, and lagged profitability are all positively related to profitability whereas the dividend dummy is negatively associated with profitability. However, the results differentiate between the two periodical subsamples because the coefficient for market-to-book is statistically significant for the period before the 1980s but not from the 1980s onwards. In addition, the coefficient for the dividend dummy is statistically significant from the 1980s onwards and the reverse holds true to the earlier period from 1963 to the 1980s. Fama and French (2004) argue that the variation in market- to-book ratios is less significant in the latter period because of the flow of young, low or zero profitability firms with substantial growth opportunities to the markets. Hou and van Dijk (2010) document a decline in profitability and survival rate which is also in line with the results of Fama and French (2004). Moreover, since the number of companies paying dividends has declined, the dividend dummy has become a more powerful tool in explaining the future profitability from the 1980s onwards (Fama & French 2001). Hou and van Dijk (2010, 25) note that “significant proportion of profitability shocks can be attributed to new lists”. In addition, several industries including high-technology sectors have experienced
15
significant development steps and those industries are leading in the number of IPOs (Hou &
van Dijk 2010).
Hou et al. (2010) introduce a different approach to estimate the implied cost of capital (ICC).
ICC estimates are generally based on the analysts’ earnings forecasts. Instead of analysts’
earnings forecasts, Hou et al. (2010) construct a cross-sectional model of accounting variables completed with market value to forecast future earnings one, two and three years ahead. The model developed by Hou et al. (2010) is replicated in this study and the formula is presented in Chapter 4.2. As discussed in Chapter 2.2.3, there are several advantages using the cross-sectional approach whereas there are several disadvantages, including the recognized biases and narrow coverage of firms and time-series, in using analysts’ forecasts.
Moreover, there is documented lack of reliability in the estimated ICCs based on analysts’
forecasts. Therefore, accounting based proxies for future earnings are demanded (Hou et al.
2010). Hou et al. (2010) insert the calculated expected earnings into the discounted residual income model to estimate the ICC for each company. The dependent variable used in Hou et al.’s (2010) earnings forecast model differs from the other models discussed in this chapter.
Hou et al. (2010) has chosen absolute dollar earnings as the dependent variable due to the comparability with analysts’ forecasts. In addition, the forecasting horizon in Hou et al. (2010) is longer whereas the other previously mentioned studies calculate the expected profitability only for the next year. Variables employed are in line with the previous studies but those are not scaled by any size variable, for example market capitalization or total assets. The dependent variable is net income before extraordinary items and the explanatory variables are market value, total assets, dividends paid, a dividend dummy for non-paying firms (value 0), lagged earnings, a negative earnings dummy (value 1) and operating accruals. The variables are winsorized at the 0.5 and 99.5 percentiles and the results are robust to scaling all variables with total assets, market equity, sales and net operating assets.
The results of Hou et al. (2010) are consistent with Fama and French (2000, 2006), Hou and Robinson (2006), and Hou and van Dijk (2010). In addition, all the explanatory variables except the negative earnings dummy have the same sign consistently throughout the forecasting horizons of one to three years. Especially lagged earnings are highly persistent and statistically significant. Lagged market value is positively and lagged total asset are negatively associated with future earnings. Furthermore, firms that pay out more dividends and firms with lower operating accruals tend to have higher future earnings. The negative earnings dummy is negative for the year t+1 and positive for the years t+2 and t+3 but the dummy is statistically significant only for the third year. The overall explanatory power of the model is high with adjusted R2 of 87%, 81% and 77% for the years one to three ahead, respectively. The model seems to capture a substantial part of the variation in future
16
earnings by using ex ante accounting variables. Moreover, the researchers considered and tested several additional earnings predictors, for example capital expenditure, R&D, and firm age, but those were not included in the model because they did not improve the quality of the earnings forecasts or the reliability of the calculated ICC estimates (Hou et al. 2010). When examining the forecast bias and accuracy, the researchers find that both the cross-sectional model and analysts’ forecasts tend to be overoptimistic but analysts’ forecasts are documented to exhibit even more severe negative bias. However, when considering the forecasting accuracy defined as the absolute value of the forecast bias, analysts’ forecasts were more accurate than the model-based forecasts. For example, Lee et al. (2011) employ the cross-sectional model of Hou et al. (2010) to avoid problems associated with analysts’
earnings forecasts in calculating future earnings in their study of ICC estimates.
2.3.2 The DuPont model in earnings forecasting
The DuPont model is one method of modeling present and future earnings. Figure 1 illustrates the composition of ROE. The DuPont model is often used as a basic tool for ratio analyses and analyses of firms’ performance. The DuPont model splits the company’s return on equity (ROE) into its key value drivers: net profit margin, asset turnover, and financial leverage (Palepu et al. 2007). Return on equity answers to a question of “how well managers are employing the funds invested by the firm’s shareholders to generate returns” (Palepu et al. 2007, 199). Trotta (2003) argues that the main advantage of the DuPont model is its simplicity as it is solely based on basic accounting variables. Palepu et al. (2007) explain that the three components of DuPont capture different aspects of firms’ management. Net profit margin reflects the effectiveness of companies’ operating management, asset turnover the effectiveness of investment management and financial leverage the effectiveness of liability management. Soliman (2008) suggests a slightly different approach for the terms of ROE.
The researcher argues that profit margin provides information about firms’ pricing power, for example, about product innovation and positioning, brand name recognition as well as first mover advantage. On the other hand, asset turnover results from the asset utilization and the efficiency derived from efficient processes in using property, plant and equipment and inventory. Hence, the management of working capital is vital for firms’ profitability. (Soliman 2008)
17
Palepu et al. (2007) demonstrate the link between valuation and return on equity. The authors explain that “in the long-run value of the firm’s equity is determined by the relationship between its ROE and its cost of equity capital” (Palepu et al. 2007, 199). In other words, firms for which the forecasted ROEs exceed the cost of equity capital in the long-term should have valuations in excess of book value.
ROE is also a tool for forecasting firms’ future performance. Beaver (1998) argue that current earnings provide information to forecast earnings. Furthermore, prior literature documents a positive relation between the components of DuPont model and equity returns (see e.g.
Soliman 2008). For instance, asset turnover is documented to be positively associated with future changes in earnings and both, asset turnover and profit margin are documented to have explanatory power for changes in future profitability (Soliman 2008). Moreover, asset turnover is found to be more persistent in nature than profit margin (Soliman 2008). However, Fairfield and Yohn (2001) document that profit margin and asset turnover do not have predictive power but change in asset turnover is positively associated with future changes in earnings. Palepu et al. (2007) add that comparing the cost of capital with ROE is useful also in analyzing future profitability.
2.3.3 Industry-level forecasting models
The need for the industry-specific forecasts of financial performance has been questioned.
When analyzing the usefulness of industry-level forecasts, the aforementioned Stigler’s (1963, 54) statement have to be kept in mind: “ -- under competition, the rate of return on investment tends toward equality in all industries. Entrepreneurs will seek to leave relatively unprofitable industries and enter relatively profitable industries”. In other words, as prior studies (e.g. Fama & French 2000, Allen & Salim 2005) document, profitability and earnings across industries tend to be mean reverting. However, there are also studies (see e.g.
Fairfield et al. 2009) which question the economywide thinking of mean reversion and suggest that mean reversion would be more of an industry-specific phenomenon. Fairfield et
Figure 1. Composition of ROA in connection to ROE (Trotta 2003, 153).
18
al. (2009) argue that there are systematic differences between industries which hinder the mean-reversion across the industries. For example, barriers to entry, product demand and business risk may have influence on the persistence and level of firm performance. Fairfield et al. (2009) explain that industry membership is one of the key factors affecting the cross- sectional differences and firms’ performance. For instance, Fama and French (2000) suggest that average industry profitability may be higher in industries with higher risk.
Fairfield et al. (2009) test whether the long-term firm profitability or sales growth converge to industry or economywide benchmarks. Fairfield et al. (2009, 148) state that “if mean reversion contributes to the predictability of firm performance and the mean reversion parameters differ systematically across industries, then it follows that industry-level prediction models will provide more accurate forecasts of firm performance than economy-wide models”. The researchers criticize that the prior research on mean reversion is mainly focused on year-ahead firm performance. Thus, Fairfield et al. (2009) examine the long-term forecasts since the effect of industry membership on firms’ performance may not be immediate.
Fairfield et al. (2009) find that industry-specific models are rather accurate in predicting firm growth but not profitability. Industry-specific forecast models are both in short (one year ahead) and long-term (five years ahead) more accurate than the economywide models when estimating sales growth. Fairfield et al. (2009) argue that growth is more dependent of product demand which is connected to industry level factors. Rather surprisingly, Fairfield et al. (2009) find that the industry-level forecasts of profitability (ROE and RNOA) are not more effective than the economywide forecasts either in short-term or in long-term analysis. In fact, the long-run ROEs are found to be closer to economywide than to industry-specific benchmarks. Moreover, Porter (1979) argues that firms’ profitability depends on the structure within industries and differs between strategic groups within an industry. Fairfield et al.
(2009) also suggest that profitability measures may converge to industry benchmarks gradually over time as firms leave less profitable industries and new firms enter more profitable industries. This kind of movement in the economy takes time to adjust. In a conclusion, as Fairfield et al. (2009, p. 148) state, “heterogeneity within industries and/or homogeneity across industries will reduce or eliminate the incremental benefits of industry- level forecasting models”. Cost structures exhibit even greater variance than revenues within industries (Fairfield et al. 2009).
2.4 Forecasting errors and uncertainty factors
Uncertainty about the future scenario affects the predictions of future performance and makes predicting future performance more difficult (Pastor & Veronesi 2003). Especially in
19
the case of young and small firms uncertainty contributes to the high valuations (Pastor &
Veronesi 2003, Baker & Wurgler 2006). The increase of new lists has impacted on the average volatility of expected profitability and decreased the number of dividend paying firms (Pastor & Veronesi 2003). Gu and Wang (2005) find that more uncertain prospects are related to innovative technologies. Earnings forecasting is documented to be especially difficult for high-intangible firms (Barron et al. 2002). Uncertainty not only describes the negative outcomes and riskiness of the company but also positive unexpected performance.
There are several studies focusing on the analysts’ forecasting errors and the factors affecting the precision and bias of the forecasts.
Several researchers argue that the increase in the number of intangible intensive firms and the complexity of intangible information have made predicting future performance even more difficult (Higgings 2011, Gu & Wang 2005, Barron et al. 2002). Forecasting errors produced by analysts and empirical models, for example random-walk and extrapolative models, are documented to be positively related to the magnitude of intangible assets and R&D costs (Barron et al. 2002, Gu & Wang 2005, Higgings 2011). However, analysts’ forecasting accuracy is found to be better than the accuracy of empirical models especially for high-R&D firms (Barron et al. 2002). Still, the analysts’ consensus is lower and associated with more uncertainty when analyzing the high-technology manufacturing companies, for instance electronics, drug and software, because of relatively high R&D expenditures (Barron et al.
2002). Due to the information complexity of intangibles, it has been argued that analysts place greater relative emphasis on their private information when deriving estimations for intangible intensive firms (Higgings 2011, Gu & Wang 2005, Barth et al. 2001, Barron et al.
2002). Nevertheless, analysts have an incentive to cover the firms with higher intangibles and R&D costs because the market prices are less informative (Barth et al. 2001, Gu &
Wang 2005). Pastor and Veronesi (2003) suggest that analysts’ coverage could be one proxy for uncertainty. However, IBES mainly covers big and established firms and there is lack of analysts following small firms (Pastor & Veronesi 2003).
Uncertainty about the future performance is often linked to the age of the firm. Learning phenomena cause a decline in uncertainty when firms mature. Investors are, on average, too optimistic about the future profitability of young companies (Pastor & Veronesi 2003).
Earnings volatility tends to be higher for younger firms. However, profitability is assumed to be mean reverting over time as discussed in Chapter 2.2.1. Pastor and Veronesi (2003) argue that the high valuations of young firms are an indication of overoptimism. Baker and Wurgler (2006) analyze investor sentiment and firms’ characteristics compared with firms’
valuations. The researchers emphasize that the firms linked to subjective valuations are typically small, young, unprofitable, highly volatile, not paying dividends, distressed and
20
extreme growth stocks with lack of earnings history. Investor sentiment has larger effects on these kinds of securities and increases uncertainty and speculative trade (Baker & Wurgler 2006). Several uncertainty characteristics are recognized in the firms operating in high-tech industry. Typical high-tech firm-specific factors are discussed in Chapter 3.2.
21
3 Prior research on high-tech’s future performance
The goal of this chapter is to review the prior research on high-tech companies’ future performance. Prior literature is mainly focused on the stock performance rather than operating performance. In this chapter, the industry specific factors and prior empirical research on high-tech firms’ performance are covered. Firstly, the development of high-tech IPO markets, the most common high-tech specific factors and the financial reporting of high- tech firms are described. Then, the prior literature on financial statement information linked to the operating performance and the valuation of high-tech firms in IPO and post-IPO situations is reviewed.
3.1 High-tech IPO markets
“The high-tech IPO is a mysterious beast. It’s attractive, seductive and irresistible. But it’s also fickle, temperamental and not always well- behaved. Still, investors have a difficult time resisting the high-tech IPO even when the fundamentals aren’t solid or even exist.”
(Evans 2010)
“US IPO markets were rejuvenated by small-cap high-tech and energy companies”
(Ernst & Young, Global IPO trends 2011)
Social media rushing to markets, speculations about the listings of Facebook, LinkedIn, Twitter, Hulu and Skype, second IT bubble, another sign of the technology apocalypse, Silicon gold rush 2.0: The next wave of high-tech IPOs. All the previous wordings describe the recent opinions of financial press. After couple years of downshifting the high-tech industry is rising again. Discussions about the performance of high-technology industries are often connected with the economic growth of economies, the source of employment growth, profits, innovation and technological opportunities in products and production processes (see e.g. OECD Science, Technology and Industry Scoreboard 2005, Tong 2005, Kask & Sieber 2002). Technological markets are characterized by high growth potential but also by a high degree of uncertainty. Uncertainty makes forecasting the performance of high-tech companies exceptionally difficult. The challenge to predict future performance was remarked especially during the dot.com bubble from the late 1990s to 2000 when the industry exhibited investors’ extreme high-sentiment period and the subsequent crash. High-technology and particularly Internet stocks were popping to public trade. The dot.com bubble was a rather unique event in the industry and also extensively studied (see e.g. Trueman et al. 2001, Penman 2001, Demers & Lev 2001).
22
The increase in the listings of high-tech companies has driven also the whole IPO markets.
In fact, Demers and Joos (2007) document that the proportion of high-technology and especially Internet IPOs has been increasing rapidly relative to nontechnology firms in the U.S., particularly since 1995. Technology stocks began their stroke in IPO markets and increased the amount of new lists already since the 1980s but high-tech industries have jumped into picture after the born of New Economy (Ritter & Welch 2002). Schultz and Zaman (2001) argue that one possible motive behind the numerous listings of Internet companies is that the firms attempt to grab market share in industries where there are large economies of scale. The significant number of high-tech IPOs has led to a situation where high-technology IPO offerings have become more important key drivers for economy-wide growth (Ritter & Welch 2002, Fama & French 2004).
The listing of Netscape (an Internet browser company) in 1995 started a new era in business called the New Economy. Especially in North America, the financial market has facilitated the growth of new lists. Venture capitalist have helped the startup companies by financing companies’ innovative ideas and IPO market participants have been supporting by buying the future shares. In fact, it has been argued that the possibility of big gains from innovations has changed the investment incentives towards investing in high-risk new businesses. The financial market has made these kinds of investments possible by offering a liquid stock market also for the small and risky stocks. Financing has pushed the innovation and productivity forward. (Mandel 2001) However, high-technology industry is widely recognized as hard-to-value and forecast due to several special challenges in accounting data, performance and company characteristics. These characteristics are described below in Chapter 3.2.
The market has exhibited several waves of IPO “hot issue markets”. Hot issue market is defined as a situation where there is a significantly greater number of new lists and higher average initial returns. The situation leads to a chain effect where there is an excessive investor demand for the IPOs due to the higher initial returns and, on the other hand, the high demand attracts new firms to enter the market. Regardless, Schultz and Zaman (2001) find only weak support for the assumption that Internet firms are going public to sell overpriced stock. It has been argued that also new lists with poorer economic condition ran into markets.
This kind of rush of several new lists and high valuations were experienced at the turn of the 21st century in the technology and especially Internet industry. However, the bubble burst after the boom and several companies were in big trouble. (See e.g. Loughran & Ritter 2004)