Science Arts & Métiers (SAM)
is an open access repository that collects the work of Arts et Métiers Institute of Technology researchers and makes it freely available over the web where possible.
This is an author-deposited version published in: https://sam.ensam.eu Handle ID: .http://hdl.handle.net/10985/21765
To cite this version :
Mohammad AHMADIFAR, Khaled BENFRIHA, Mohammadali SHIRINBAYAN, Abbas
TCHARKHTCHI - Additive Manufacturing of Polymer-Based Composites Using Fused Filament Fabrication (FFF): a Review - Applied Composite Materials - Vol. 28, n°5, p.1335-1380 - 2021
Any correspondence concerning this service should be sent to the repository Administrator : [email protected]
https://doi.org/10.1007/s10443-021-09933-8
Additive Manufacturing of Polymer‑Based Composites Using Fused Filament Fabrication (FFF): a Review
M. Ahmadifar1,2 · K. Benfriha2 · M. Shirinbayan1 · A. Tcharkhtchi1
Abstract
In this review paper, recent developments in the Fused Filament Fabrication (FFF) approach are provided for composite materials. Influencing parameters in FFF process such as road width, print speed, layer thickness, feed rate and build temperature of the model (both liquefier and envelope temperature), fiber orientation, the layer position, volume frac- tion, and infill orientation have been studied. These considered parameters in the strength/
bonding or physicochemical characterizations of FFF-fabricated parts have been presented in detail. An overview of the mechanical properties of printed parts for different composite material systems is presented and discussed. Three types of reinforced polymers in FFF process have been considered: filled reinforced polymers, continuous fiber-reinforced poly- mers, and short fiber reinforced polymers.
Keywords Fused Filament Fabrication · Composite · Continuous fiber · Short fiber
1 Introduction
In recent years, a new stereo-lithography process has been developed to produce complex shapes. The main mechanism of the process was based on the 3-D design of a thin layer from the liquid polymer by using a laser beam. The final product was based on a layer of hardened resin having the same shape and dimension, which has been already generated by a computer-generated slice. The production of this kind of shape was then named rapid prototyping (RP) [1].
* M. Ahmadifar
* M. Shirinbayan
[email protected] K. Benfriha
[email protected] A. Tcharkhtchi
1 Arts Et Metiers Institute of Technology, CNAM, PIMM, HESAM University, 75013 Paris, France
2 Arts Et Metiers Institute of Technology, CNAM, LCPI, HESAM University, 75013 Paris, France
Rapid prototyping (RP) is a generic term for several technologies in which components are fabricated without the requirement for conventional tooling. The use of these technolo- gies allows for the automatic construction of physical objects from computer geometric models and permits quick production of prototypes, and thus substantially reduces product development time. Conventional milling and turning are good examples of subtractive pro- cesses. In contrast, RP techniques are additive processes and RP components are build-up gradually in layers. In RP, a computer-aided design (CAD) file of an object is converted into a physical model using a variety of manufacturing techniques [2, 3].
These technologies are commonly referred to as solid freeform fabrication (SFF) meth- ods. SFF has become very successful in the marketplace in the past 3 decades [2]. The most popular SFF technologies to date are as follows: Stereo-lithography (SL), Laminated object manufacturing (LOM), Fused Filament Fabrication (FFF), Selective laser sintering (SLS), and Multi-jet modeling (MJM) [2, 3].
In addition, the number of different materials that can be employed in each process has increased significantly, improving the precision and functionality of the end products.
Therefore, RP techniques are now worthy of consideration as alternative methods of the direct production of parts, components, or models for use in manufacturing processes [4].
Additive Manufacturing (AM) technologies offer the potential for significant cost sav- ings due to reduced material waste and the capability for a tool-less production of intricate geometries. Therefore, they have gained considerable attention during the last decade. The Fused Filament Fabrication (FFF) process, which is also termed Fused Deposition Mod- eling (FDM), is one of the most popular AM methods for manufacturing the parts by poly- mer or composite materials. This process utilizes a continuous filament of a thermoplas- tic material as raw material. The molten raw material extrudes from the print head, then deposits on the build platform layer by layer. Which caused the formation of the designed and required part(s) [4].
The Fused Filament Fabrication (FFF) process is the main objective of this paper. FFF process typically begins with a solid model of the planned part as generated in a CAD system. This model is oriented in the desired build direction and post-processed within the CAD system into a stereolithography format (STL). The STL representation is then decom- posed into horizontal layers representing thin cross-sections of the product. Solid models for these structures are then defined and sliced similarly. Actual instruction codes for the FFF machine are then generated and include a path plan for each layer of the sliced model [4]. The only required post-processing activity is the removal of the support structures.
Fused Filament Fabrication (FFF), first developed by Stratays Inc [4], USA, is a solid freeform fabrication process. It forms three-dimensional objects from computer-generated solid or surface models. An FFF machine is a computer numerically controlled (CNC) machine, carrying extruder nozzles. A spool of modeling filament feeds the one head, and a spool of support material feeds the other. The machine fabricates prototypes by extruding the filament through a heated nozzle in a prescribed pattern onto a platform (Fig. 1). As the material is deposited, it cools, solidifies, and bonds with the surrounding material. At the end of each finished layer, the base platform is lowered in preparation for the deposition of the next layer. The deposition path and parameters for every layer are chosen depending on the material used, the fabrication conditions, and the applications of the designed part, and the preferences of the designer.
The most common materials employed in the FFF process could be classified as fol- lows: Polylactic acid (PLA), Investment casting wax, Acrylonitrile butadiene styrene (ABS), Polycarbonate (PC), Polyphenylsulfone (PPSF), Polypropylene (PP), Polyethylene (PE), Polyether ether Ketone (PEEK), Nylon (PA), etc. These polymers may be filled with
different types of fillers like talc, mica, wollastonite, calcium carbonate, mineral pigments, carbon black, and micro-glass marble. It could be also reinforced by the continuous or dis- continuous glass or carbon fibers to produce the composite material [4].
The materials are selected based on their thermo-physical and mechanical characteris- tics. Key mechanical properties of an FFF material include strength, stiffness, and ductility [5]. The other requirements on thermo-physical properties include the low coefficient of thermal expansion, minimal shrinkage, high heat resistance, no/few volatile molecules, and no phase transformation in the solid-state. Lower thermal expansion is essential to achieve dimensional accuracy and stability of the part. The amount of linear shrinkage in a part between the building temperature and the end-use temperature should be less than 1%.
Rheological and thermal properties are also taken into consideration in the material for- mulation and selection [4]. Relatively low melt viscosity is required for the material to flow through the nozzle. It is therefore necessary to increase the temperature to obtain a low vis- cosity. However, this increase in temperature is limited due to the low thermal stability and the degradation of the polymer. In the FFF process, several parameters can influence the process with different degrees of influence. Therefore, the optimization of all these param- eters is necessary to allow a good adhesion between each layer with the layer previously deposited.
To be able to make a part with the FFF process, the polymer must be in the molten state with low viscosity. This condition limits the area of the process. The viscosity of polymer depends on its molecular weight and temperature. The temperature-molar mass diagram of the polymer allows knowing the process area of a polymer (Fig. 2). On this diagram, the different zones correspond to the different physical states of the polymer:
• Zone I: solid-state.
• Zone II: Rubbery state.
• Zone III: liquid/viscous state.
• Zone IV: zone of degradation. Zones are separated by transition temperatures:
MC (≈ 5 kg/mol) is the critical molecular weight.
Tg: glass transition temperature (relative to the amorphous phase).
Tf: melting point related to the crystalline phase.
TD: degradation temperature of the polymer: from this border, the polymer begins to degrade.
Fig. 1 Schematic of FFF process [4]
TCL: transition temperature rubber / liquid state. This last temperature has essentially technological signification. It is the temperature below which material is too viscous to be used. The process temperature must be always higher than TCL. In the FFF process, the molten polymer in the extruder passes through the cylin- der, and the molten filament will be deposited onto the previous one (according to Fig. 1) that is in the progress of cooling and causes the re-heating of this last one [6, 7]. Because of the cyclic temperature profile of each layer during deposition, the key point that affects the bonding of two adjacent filaments would be the optimization of the temperature profile.
The manufacturing capabilities of complex geometries and low manufacturing costs have motivated researchers to undertake various studies for improving the behavior of parts manufactured by the Fused Filament Manufacturing (FFF) process [8, 9]. Despite the mentioned advantages, in comparison to the conventional methods [1], mechanical properties of parts manufactured by the FFF process are inherently poor and there is a limited number of researches in this regard [10, 11].
To have a better understanding of the features of temperature profiles between adjacent filaments, various mathematical approaches have been proposed. A transient heat transfer analysis for the filament deposition with physical contacts between any filament and its neighbors has been proposed [2]. Also, a 2D heat transfer model of two-filament was generated to consider the temperature evolution during FFF process deposition using Finite Element Method (FEM) [3]. Furthermore, a 1D transient heat transfer model was developed by Q. Sun [4] and combined with the spherical particle sintering model (O. Pokluda et al. [4]) to estimate the FFF temperature profile and the bond formation for a single filament depositing process [4].
In this review paper, process parameters, and experimental works in the case of composite materials obtained by the FFF process will be reviewed. Different experi- mental characterization results are presented. This research helps design and optimize the processing parameters to improve the mechanical properties of composite products fabricated by FFF. Control of these parameters allows designers to better adapt the mechanical characteristics of composite parts to their usage.
Fig. 2 Temperature-Molecular Weight diagram of thermoplastic polymers
2 FFF influencing parameters
The manufacturing of the parts depends on many parameters related to the following elements: Material, shape and geometry, process, and tools (mold, machine, and …).
Numerous studies focused on finding a relationship between the properties and process- ing parameters of FFF process in printed parts, such as layer thickness or raster angle [10, 12, and 13]. In FFF process, each parameter has its own influence on the micro- structure and bonding/strength of the fabricated parts. Some process parameters have been introduced in Fig. 3.
Due to the nature of FFF, almost all the 3D-printing machines comprise numerous process parameters. This allows users to utilize a wide range of parameters. Following Fig. 3, process parameters such as road width, print speed, layer thickness, feed rate and build temperature of the model (both liquefier and envelope temperature), fiber orienta- tion, the layer position, volume fraction, infill orientation contribute to be considered and taken into account in the strength/bonding or physicochemical characterizations of FFF-fabricated parts. Almost all of them affect the filament bonding and consequently the mechanical behavior of 3D-printed parts. However, researchers tried to focus on some key parameters due to the numerous values that exist for the FFF process by opti- mizing the experimental procedure to obtain the best combination of parameters that help to improve the bonding of adjacent filaments, as much as possible. The develop- ment of the mechanical behavior and dimension accuracy of the printed parts in com- parison with the desired dimension values are considered as the criteria of the suitable combination of the process parameters, as optimized additive manufacturing procedure.
Fig. 3 Representation of influencing parameters in FFF process [5]
Various research exists on the consideration of the influence of parameters on parts fab- ricated using FFF. Build orientation and raster angle and their effects on the mechanical properties of 3D-printed parts have been consequently studied and they have tried to ana- lyze the effect of raster angle by consideration of infill patterns (Fig. 4) [10, 12].
Regarding the type of applied material and the studied parameters, it was found that almost all researchers tried to consider the effect of parameters by the different methods of characterization (e.g. tensile or bending).
3 FFF process in polymers
The effect of in-process and post-process thermal treatment and the environment tem- perature or envelope temperature on the fabricated parts have been studied. Based on Fig. 5, diffusion, and neck-growth between of two adjacent filaments would be affected Fig. 4 FFF parameters in composites, (a) Effect of infill density, (b) Effect of the quantity of the layers, (c) Effects of tool path, nozzle size, and layer thickness, (d) Effect of the type of the used reinforcement mate- rial, (e) Effect of the type of the used matrix, (f) Effect of infill pattern
Fig. 5 In-process thermal treat- ment at the different type of heat gradient on printed structure [14]
by changing of environment or envelope temperature in which it approves the impor- tance of heat transfer in this process.
Table 1 presents an overview of FFF process parameters for polymers without any reinforcements. One can note that these studies can be useful for the understanding of FFF process in composite especially the effect of reinforcements to improve mechanical properties of structures. In fact, in this table different research works have been reviewed to show their importance. In these studies, some processing parameters such as raster, air gap, raster width, layer thickness, temperature, building orientation, etc. have been analyzed. The results of all studied to confirm the importance of temperature and build- ing orientation effects on the mechanical properties of the printed sample. However, as mentioned this information could help us to better study the bonding filaments and con- sequently mechanical properties of composite parts made by the FFF process.
Table 1 FFF process in polymers
Study Materials Parameters
Fodran [15] ABS Fill gap, line width, slice thickness
Bertoldi [6] ABS Building orientation, raster orientation
Es-said [16] ABS Layer orientations
Rodriguez [17] ABS Fiber gap, flow rate
Ahn [18] ABS Raster orientation, bead width, color, temperature
Lee [7] ABS Raster, air gap, raster width, layer thickness
Sun [8] ABS Temperature variations with part building location
Sood [9] ABS Layer thickness, orientation, raster angle, and air gap Fatimatuzahraa [10] ABS Raster (axial, crisscross, cross, and transverse) Sood [19] ABS Layer thickness, orientation, raster angle, air gap
Croccolo [11] ABS Raster pattern, building orientation
Durgun [1] ABS Raster angles, building orientation
Gorsky [2] ABS Building orientation
Baich [3] ABS Infill (low, high, double dense, solid)
Gorski [4] ABS Orientation
Ziemian [20] ABS Raster orientations
Onwubolu [21] ABS Layer thickness, orientation, raster angle, and air gap Tymark [22] ABS, PLA Layer thickness, raster orientation
Ebel [23] ABS, PLA Infill pattern, infill percentage
Rankouhi [24] ABS Layer thickness, raster orientations
Letcher [25] ABS Number of layers, raster orientation
Fernandez [26] ABS Infill, fill pattern
Alvarez, 2016 [27] ABS Infill
Hernandez [28] ABS Building orientations
Torrado [29] ABS Raster patterns
Mahmood [12] ABS Width, thickness, infill density, no. of shells
Ransey [13] ABS Building orientations, infill
Tanikella [14] Nylon, ABS, PC Different materials, color, building orientation
Cantrell [30] ABS, PC Raster, building orientations
4 FFF process in polymer‑based composites 4.1 Powder reinforced polymers
Nikzad, et al. [31], used three types of materials as the development of the new powder reinforced composite materials by the FFF process. The main reason for using powder as a reinforcement (filler) is to improve the electrical properties and thermal conduction (using metals powders). The powders, which were utilized as reinforcement (filler) for improv- ing the electrical or thermal conduction, often reduce the strength of the materials. There- fore, they are not often considered as mechanical reinforcements in polymer composite materials.
The first used material was Acrylonitrile Butadiene Styrene (ABS) thermoplastic, as the matrix. Other used ones were two composites used as feedstock materials, which were cop- per powder mixed in ABS matrix and another one was iron powder mixed in ABS matrix.
According to characterize the related viscoelastic properties of these developed compos- ites materials as feedstock in the FFF process, Dynamic Mechanical Analysis (DMA) tech- nique has been used. The varying volume fractions of metal powders (5%, 10%, 20%, 30%, and 40%) were used according to produce the appropriate feedstock filament. The related shape of the used powder particles was spherical for copper and irregular for iron. The purity of both used powder (copper and iron) was 99.7% with two particle sizes of 10 μm and 45 μm for copper and one particle size of 45 μm for iron powders (Table. 2).
Figure 6(a) is related to the variation of the measured thermal conductivity of the copper composites of the large used particle sizes with different copper content at different tem- peratures. According to Fig. 6, the observed temperature increase had a negligible influ- ence. However, in the case of sample B4, which was related to the high concentration of the copper particles (30 vol. %), an obvious thermal conductivity increase, above the glass transition temperature of the matrix was observed. The increase of the particle’s mobility at the beyond the temperature of the matrix glass transition was reported as the reason.
The lower concentration of the copper particles up to the volume fraction of 10%
(samples B1 and B2), could not useful, according to improve the thermal resistance of the ABS matrix. In the case of the volume fraction of 20%, the conductive chains of the
Table 2 Metal/polymer composites constituents [31]
Composite designation Matrix Metal filler type Filler size (μm) Filler loading (%) A1A2
A3A4 A5B1 B2B3 B4B5 C1C2 C3C4 C5
ABSABS ABSABS ABSABS ABSABS ABSABS ABSABS ABSABS ABS
CuCu CuCu CuCu CuCu CuCu FeFe FeFe Fe
1010 1010 1045 4545 4545 4545 4545 45
510 2030 405 1020 3040 510 2030 40
copper were formed. In the other words, the volume fraction of the 20% copper powders was required to achieve a percolation concentration. This formation and its related effect on the thermal resistance were more tangible in the case of 30% volume fraction. As for the reason, easier mobilization thanks to the matrix state change from the solid to the liquid state at the above glass-transition temperature of the matrix.
According to Fig. 6(b), as the comparison of the effect of the iron and copper as the used reinforcements of the ABS matrix on the thermal conductivity of the fabricated composites, it was clear that the iron particles had lower influence. The effect of iron particles was sensible when the related particle concentration reached the 30% volume fraction (sample C4).
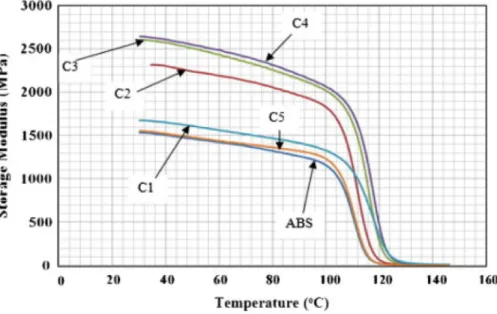
Figure 7(a) is related to the dynamic mechanical result of the ABS reinforced by the used finer copper particle size. It was observed that below the glass-transition tem- perature, as the volume fraction of the used filler was increased, the storage modulus of the composite was increased, too. The trend was continued up to 30% of the filler volume fraction (sample A4). Nevertheless, the storage modulus of the composite was decreased as the volume fraction of the filler was increased by more than 30%. The agglomeration of the used reinforcement particles (sample A5) and accumulating of the voids have been stated as reasons for the weakening of the ABS matrix by the used finer copper particles, instead of strengthening the matrix.
Fig. 6 Thermal conductivity of (a) copper-filled ABS and (b) iron-filled ABS composites at various tem- peratures [31]
Fig. 7 The storage modulus of various Copper/ABS composites with the copper particle size of (a) 10 nm and (b) 40 nm at the different temperature values [31]
Figure 7(b) shows the dynamic mechanical result of the ABS reinforced by the used coarser copper particle size. The storage modulus of the composite was increased as the volume fraction of the filler was increased up to 10%. However, the stated trend was inverted as the filler fraction was increased more than 10%. The weaker interlock of the filler matrix and the inappropriate distribution of the used fillers in the matrix were stated as the reason. In fact, the maximum achieved storage modulus in the case of the used larger copper particles was about 2GPa, while it was reported about 3.5-4GPa, in the case of the used finer copper particles as reinforcements.
Figure 8 presents the dynamic mechanical result of the ABS reinforced by the used iron particles. The effect of the iron particles was considered up to 30% volume fraction, which caused the range of the 2.5-3GPa as the storage modulus (stiffness) of the fabricated com- posite. The stiffness values of the Iron/ABS composites were higher in comparison with the same used particle size of the copper as reinforcement, under the 10–20% volume frac- tion condition of the fillers.
Hwang et al. [32] studied the thermo-mechanical properties of the developed metal/
polymer composite and the printing parameter, by the FFF process. The used metal pow- ders were copper and iron with the size of 24 μm and 34 μm, to reinforce the ABS matrix.
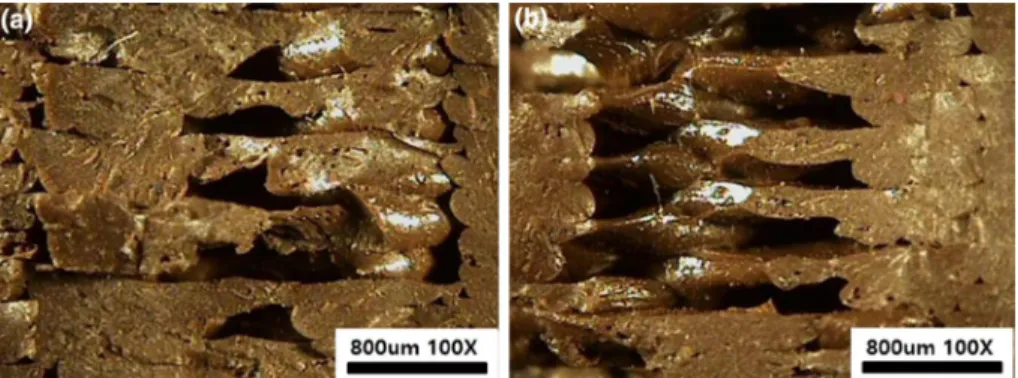
The loading deal of the metal particles was varied to study the effects of the used metal powder on the mechanical behavior of the fabricated filament. It has been reported that by the increase of the metal content, the tensile strength of the specimens was decreased. As finding it reason, the microstructure of the cut plane of the printed specimens (ABS-CU composite) was observed (Fig. 9, 10). It was observed more voids in the case of the 30 Wt.
% of the copper particles in comparison with the use of the 10 Wt. % of copper particles.
These voids caused the lower bonding between the layers, then the lower tensile strength of the specimens with 30 Wt. % copper particles in comparison with specimens with 10 Wt.
Fig. 8 The storage modulus of various Iron/ABS composites with the iron particle size of 45 μm at the dif- ferent temperature values [31]
% copper particles. In addition, the thermal conductivity of the prepared metal/polymer composite was progressed and improved by the increase of the metal content.
Isakov et al. [33], could improve the dielectric permittivity by adding BaTiO3 and CaTiO3 into the polymer matrix (ABS and PP) by the FFF process. Also, Shemelya et al.
[34], could improve dielectric permittivity, X-ray attenuation factor, and impact resistance of PC (polymer matrix) by adding the Tungsten particles.
Boparai et al. [35] studied the tribological properties of the fabricated ABS and Nylon 6-Al-Al2O3, by the FFF method. As for tribology characterization, the wear test was car- ried out on the related FFF manufactured specimens with the dimensions of 10 mm as diameter and 30 mm as length. The wear test was performed following ASTM G 99 stand- ard at room temperature. This research illustrated that the use of Al and Al2O3 as fillers could develop the wear properties, by comparison of the printed Nylon 6-Al-Al2O3 and the printed ABS parts. The related particle size of the used Al and Al2O3 were 41–44 μm and 125–149 μm, respectively. As the tribological test, the different loads were applied during 5 and 10 min at 1.36 (m/s), as sliding velocity. In the case of the fabrication of the nylon 6-Al-Al2O3 up to 40% of the filler materials (Al2O3 and Al) were used, as the filler of the nylon 6 matrix.
Table 3 shows the composition of each printed type of the nylon 6-Al-Al2O3 com- posites and the respective MFI of each composition. Indeed, the rheological behavior of Fig. 9 The microscopic structure of cutting plane of specimens: (a) ABS-Cu10 wt. % and (b) ABS-Cu30 wt. % [32]
Fig. 10 Material weight loss with applied load for (a) 5 min and (b) 10 min, obtained from tribology evalu- ations [35]
composite material with consideration of temperature and viscosity within processing in the liquefier head section of FFF was studied employing the melt flow index (MFI) test.
The MFI is introduced as an alternative measure of viscosity for comparative purpose. It is defined as the amount of the related polymer in ‘gm’ extruded in ‘10’ min via a capil- lary of standard dimensions (diameter 2.0955 ± 0.0051 mm and length 8.0 ± 0.025 mm), according to ASTM D1238–73 standard.
It has been reported that the MFI values of each composite were decreased by the decrease of Al and the increase of Al2O3. The increase of the amount of the large parti- cle size in the reinforced matrix was stated as the decrease of the MFI value.
In addition, it has been understood that as the content of Al2O3 in the printed com- posites was decreased, the related material loss to the wear was increased, according to Table 3.
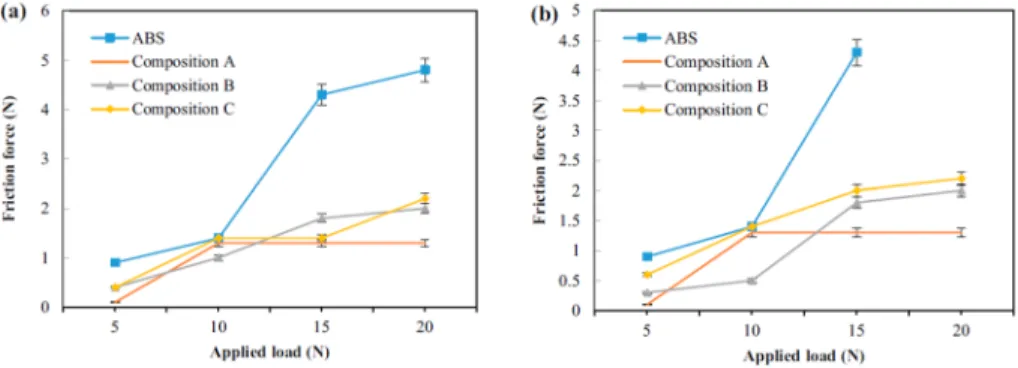
It was stated that the ABS material had more friction force under all conditions, in comparison with composite ones. In fact, the presence of the Al2O3 in the reinforced nylon composites introduced such as the bearing, caused less material loss, too. So, because of the stated property of the existence of Al2O3 particles, the composition
“A”, had the lowest friction load in comparison with the other compositions (B and C), according to Fig. 11. Also, the printed composites had the lower friction coefficient in comparison with the fabricated ABS parts. It was observed that the friction coeffi- cients of the composite materials were changed, slightly by varying the applied load and duration.
SEM observation revealed that in the case of the comparison between the printed nylon 6-Al-Al2O3 and ABS parts, the composite ones had higher wear resistance, ther- mal stability, and stiffness (Fig. 12).
Table 3 Weight proportion and MFI of different compositions [35]
Composition Nylon 6 Al Al2O3 MFI
A 60 26 14 2.19
B 60 28 12 2.25
C 60 30 10 2.31
Fig. 11 Obtained curves related to friction force with applied load for (a) 5 min and (b) 10 min on ABS, nylon 6–26 Al-14 Al2O3 (composite A), nylon 6–28 Al-12 Al2O3 (composite B), and nylon 6–30 Al-10 Al2O3 (composite C), from tribology evaluations [35]
4.2 Fused filament fabrication of fiber‑reinforced polymers 4.2.1 Continuous fiber‑reinforced polymers
The strength of polymeric composites is mainly dependent on their two impor- tant components, which are the polymer matrix and the used reinforcement(s). In fact, the strength of polymeric composites, mainly originates from two aspects. First, the individual consideration, which is the strength of polymer matrix side and used reinforcement(s) side, separately. The second aspect is the related consideration of the collaboration of these two components, in the unique manufactured materials as com- posites, such as their adhesion. Between the two stated considerations, the second one sometimes is possible to be manipulated. In the case of the used 3D printer, which have one nozzle, different methods according to increase the impregnation of the fibers have been reported such below:
• Heating the fibers before entering to the nozzle, to increase the permeation of poly- mer [36].
• Heating of the used polymer (matrix) and passing the reinforcement through the pol- ymer matrix, which has been in the molten state [37].
• Modification of the fibers by chemical solution before the feeding (sizing agent) [38].
• Printing without any heating and modification of the used fibers [39].
Matsuzaki et al. have studied the manufacturing of the PLA-continuous carbon com- posite by FFF. They have heated the fiber for fusing the fiber surface with polymer Fig. 12 SEM images of (a) ABS material, (b) composition ‘A’, (c) composition ‘B’ and (d) composition
‘C’, obtained from tribological observations [35]
matrix in synchronized fiber and polymer filament feeding (one-nozzle 3D printing machine), according to Fig. 13. In fact, the used fibers have been heated before enter- ing the nozzle, by nichrome wire. It has enhanced the infiltration and permeation of the carbon fiber bundle with used PLA resin. The heat has diffused to the resin, decreased viscosity of the PLA, and caused the increase in the tensile strength [36].
Haoa et al. [37] studied the continuous carbon fiber reinforced thermosetting compos- ites by FFF. An epoxy resin (E-54(616)) was utilized as the thermosetting matrix mate- rial; also as for reinforcement, a carbon fiber bundle (HF10, 3000 fibers in a bundle) was applied. It is stated that the high costs related to manufacturing of the continuous carbon fiber reinforced thermosetting composites restrict their use in the automotive industries, but these materials have a wide application in astronautics and aeronautics, thanks to their special properties and behaviors, such as good corrosion resistance, good fatigue behav- ior, high specific stiffness, and high specific strength [40]. Therefore, the approaching of the new low-cost methods of manufacturing of these composite structures will attract the industrials’ attention. The used method was proceeding the fiber bundle through the pool of epoxy and then entering the printing head. After printing onto the building platform, the specimens were cured in high-temperature chamber. The composites lamina, honeycomb, and grid were manufactured, as was stated, according to Fig. 14.
Finally, the tensile and three-point bending behaviors of the printed composite lamina were characterized, therefore the fiber orientation of the three-point bending and tensile tested specimens were according to the lamina pattern (Fig. 14(a)). The dimensions of the printed samples for the stated mechanical tests were 250 mm × 25 mm × 3 mm. The Fig. 13 Schematic of the 3D printer head used to produce continuous FRTPs using in-nozzle (Left) and photograph of the 3D printing of a CFRTP (Right) [36]
Fig. 14 Scheme for the printing process [37]
flexural strength and elastic modulus were 202 MPa and 143.9 GPa, respectively. In addition, the tensile strength and elastic modulus were 792.8 MPa and 161.4 GPa. These results were compared with similar printed reinforced thermoplastic composites and printed short carbon fiber reinforced thermosetting composites. The failure mechanism of the printed composite lamina was studied. The failure was started by in-plane matrix cracking. Then, the crack has expanded with an increase in the applied load. Eventually, the separation of the layers occurred, and the fiber and the matrix were debonded, which caused partial fiber breakage. The fractography of the printed continuous carbon fiber reinforced thermosetting composite lamina specimens were performed after tensile and three-point bending tests. The fractography was done by use of SEM observation of the fractured cross-section of the tested specimens (Fig. 15). The fiber breakage was started as the related dominant failure mode of the fiber-reinforced thermosetting composites.
However, the fiber pull-out was stated as the dominant failure mode of the manufactured reinforced thermoplastic composites by 3D printing (according to [38]).
In another study, Akhundi et al. studied the manufacturing of the PLA-continuous fiber (here, glass fiber yarn) composite part by FFF. In fact, the continuous glass fiber yarn entered polymer, which were molten in the nozzle, so the yarn was coated and par- tially impregnated with molten used PLA, as has been stated. It was concluded that the mechanical properties of produced composite by FFF was depended on the fiber volume content. It was noted that it is important to maximize the content of the fiber-volume to produce the composite part with high strength and modulus and then, to increase the accuracy of the prediction of the printed composite [41].
Nanya Li et al. [38] applied modification on carbon fiber bundles, which were rein- forcement components of produced composite by infiltration in PLA sizing agent before the printing as the manufacturing process, to improve the mechanical properties. In fact, the used 3D-printing machine was a one-nozzle setup (according to Fig. 16) and the applied approach for fiber impregnation was “Modification of the fibers by chemical solution, before the feeding”.
Printed samples under three different conditions, which were PLA, carbon fiber rein- forced PLA and modified carbon fiber reinforced PLA were produced. Then, the printed samples were characterized by mechanical tests.
Fig. 15 SEM images of the fractured cross-sections related to epoxy resin (E-54(616)) reinforced with con- tinuous carbon fiber composites [37]
According to Table 4, the flexure strength of the original carbon fiber was so close to the PLA samples. But the modified carbon fibers showed more strength (about 164%) than the original composite. As a reason, it was stated that this observation could be attributed to the reason that the three-point bending test and flexural property is affected by interfacial strength between matrix and reinforcement, significantly. In addition, the tensile strengths of the two kinds of carbon fiber composite (with and without modification), were signifi- cantly more than PLA printed samples.
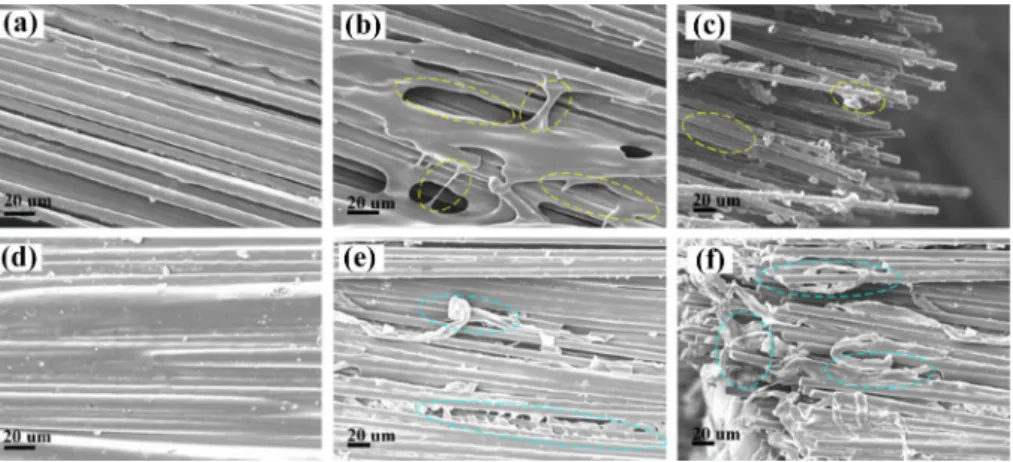
As the SEM observation, the microstructure of the original carbon fiber and modified carbon reinforced composites, before and after tensile test have been compared (Fig. 17).
According to Fig. 17(a) and (b), the stronger interface and better wetting of carbon fibers by PLA resin, due to the applied modification was clear. According to Fig. 17(b), there are just small bridges between fibers (yellow circle), which transfer the loads between fibers.
By the way, there were many voids between carbon fibers, which are representative of poor infiltration of PLA and fibers. On another hand, the higher infiltration and more bonding of matrix and modified carbon fiber are visible in Fig. 17(e). Finally, as for a comparison of the fractured surfaces of two kinds of original and modified composites (Fig. 17(e) and (f)), the complete coated fibers (cracked fibers) by PLA resin, were rare. On the contrary, Fig. 16 Schematic of the
designed extrusion device to printing continuous carbon fiber reinforced PLA [38]
Table 4 Statistic results of tensile and flexure strength of three different samples [38]
Mechanical properties PLA Carbon fiber
reinforced PLA Modified carbon fiber reinforced PLA
Tensile strength (MPa) 28 80 91
Flexure strength (MPa) 53 59 156
most of the carbon fibers were completely coated by PLA resin, and the significant separa- tion of fiber and matrix was not observed. This observation has been stated as the reason for the remarkable difference in flexure strength of the original carbon fiber composite and modified ones, which were studied [38].
Tian et al. [39] studied the continuous carbon fiber reinforced PLA composites, in which the reinforcement and PLA filament have been fed into the FFF machine, simultaneously.
They studied the five parameters, which have affected the pressure and temperature of the fabricated PLA composite. The chosen parameters were temperature of liquefier, layer thickness, feed rate of filament, hatch spacing (which was introduced as the central distance between two adjacent lines) transverse movement speed. As the parameters were changed, the mechanical performance of manufactured specimens was changed. The obtained flex- ural strength and modulus from the 3-point bending test, as the criteria of the mechanical properties, were considered to optimize the stated selected parameters of the process.
The study on the effect of liquefier temperature was done in the range of 180–240 °C, in which the melting flow index of PLA at the temperature of 180 °C and 240 °C, were meas- ured 2 g/10 min and 36 g/10 min, respectively according to the Fig. 18.
The related results of the evolution of the flexural strength and modulus were reported in Fig. 19. Therefore, the flexural strength and modulus were increased as the tempera- ture was increased (in the selected temperature range). The maximum flexural strength and modulus were related to the 240 °C, which were 155 MPa and 8.6 GPa, respectively. How- ever, it was reported that the surface accuracy of the manufactured specimens, due to the overflow of molten PLA, was lost. So, as the optimizing the lower temperature, which was 230 ֯C was reported, according to have high flexural strength and modulus, and the reason- able surface accuracy. Normally, the final printed parts with a smoother surface and also without deflection and distortion are considered as desired printed parts in viewpoints of reasonable surface and dimension accuracy.
More details from the effect of temperature on the mechanical properties have been achieved by studying the multiple interfaces, which were the interfaces between fiber and matrix. Deposited adjacent lines and layers.
Fig. 17 SEM micrographs of printed composites, (a) fiber-matrix interface of carbon fiber reinforced PLA specimen, (b) carbon fiber reinforced PLA specimen after tensile test, (c) fiber pull-out of the specimen after tensile test, (d) fiber-matrix interface of modified carbon fiber reinforced PLA specimen, (e) modified carbon fiber reinforced PLA specimen after tensile test and (f) fiber pull-out of modified carbon fiber rein- forced PLA specimen after tensile test [38]
It was observed that the delamination was prepared between layers, because of inad- equate bonding in the lower temperature of liquefier (180 °C) according to Fig. 20(a).
But, by increasing the temperature up to 240 °C, no interface between the layer were not observed, because of increase of flowability of melt plastics by temperature (Fig. 20(d)).
As an observation of the interface between the matrix and fibers, the impregnation of the matrix into the fiber bundle wasn’t occurred in the lower temperature (180 °C) according Fig. 18 Melting flow index of
PLA with temperature from 180 °C to 240 °C [39]
Fig. 19 Effect of the liquefier temperature on the flexural strength and modulus of 3D printed continuous carbon fiber reinforced PLA composites [39]
to the Fig. 20(b), but by increasing the temperature up to 240 °C, the impregnation of PLA into the carbon fiber bundle was achieved (Fig. 20(e)). As the reason, by increasing the temperature, the melt flow index of the matrix was increased. It was observed that the matrix was broken first and could not transfer the applied load to the reinforcement fibers at lower temperatures. The fibers were pulled out (Fig. 20(c)). However, by increasing the temperature, the pattern of the fracture was changed, in which the fiber bundle breakage was observed (Fig. 20(f)). Therefore, that is why the flexural strength was increased by temperature increase.
As the study on the layer thickness parameter, the thickness of 0.3 mm to 0.8 mm was selected [39]. The flexural strength was decreased by an increase in thickness value, according to Fig. 21.
In fact, the tight space for the just deposited melt materials and increasing of the contact pressure between the nozzle and surrounding deposited lines were prepared, by decrease of the layer thickness. As more detail, the microscopic observations were applied. In the case of the smaller thickness (0.5 mm), it was observed that the homogenous bonding between the layers without obvious delamination in the interfaces was achieved (Fig. 21(a)), also the carbon fiber bundles were impregnated with matrix (Fig. 21(b)), and the load was transferred from PLA to carbon fibers, as was revealed during the fractography. However, in the case of the larger layer thickness (0.7 mm), the weaker bonding (Fig. 21(d)), inad- equate impregnation (Fig. 21(e)), and fiber pull-out and shear delamination were observed (Fig. 21(f)).
The hatch spacing was studied from 0.4 mm to 1.8 mm. It was understood that as the hatch spacing was decreased from 1.8 mm to 0.4 mm, the average flexural strength and modulus were improved, simultaneously, from 130 to 335 MPa and 6.26 GPa to 30 GPa, respectively (Fig. 22).
As microscopic observations, by decreasing the hatch spacing from 1.6 mm to 0.6 mm, the impregnation of the matrix into the carbon fiber bundle was improved, according to Fig. 23.
Fig. 20 Microstructures of the obtained fractured cross-section from the applied flexural test on the carbon fiber PLA composites with liquefier temperature of 180 ̊C (a, b, c) and 240 ̊C (d, e, f), respectively: (a) and (d) overall cross-section, (b) and (e) interface, (c) and (f) fracture pattern [39]
The feed rate of the filament (E) and the printing speed was studied, too. The feed rate of the filament affected the pressure and extrusion speed of molten material in the print- ing head and nozzle. According to Fig. 24, by increasing the feed rate from 60 mm/min Fig. 21 Microstructures of the obtained fractured cross-section from the applied flexural test on the carbon fiber PLA composites with a layer thickness of 0.5 mm (a, b, c) and 0.7 mm (d, e, f), respectively: (a) and (d) overall cross-section, (b) and (e) interface, (c) and (f) fracture pattern [39]
Fig. 22 Influence of hatch spacing on the flexural strength and modulus of the 3D printed carbon fiber PLA composites [39]
Fig. 23 Microstructures of the obtained fractured cross-section from the applied flexural test on the carbon fiber reinforced PLA composites with hatch spacing of 0.6 mm (a, b, c) and 1.6 mm (d, e, f), respectively:
(a) and (d) overall cross-section, (b) and (e) interface, (c) and (f) fracture pattern [39]
Fig. 24 Influence of feed rate of the filament and printing speed on the flexural strength of the 3D printed carbon fiber PLA composites [39]
to 80 mm/min, the flexural strength of the PLA composite was increased. But the flexural strength of the composite wasn’t improved anymore, by furthermore increasing the feed rate. The reason for this phenomenon could be the short impregnation period. The printing speed was found as an insignificant impact on the flexural strength, according to Fig. 24.
As its reason, it was stated that the two contradictory factors which were the impregnation period, then pressure, and overall fiber contents, were influenced the flexural strength ver- sus the printing speed.
Frank van der Klift et al. [42], studied the printed carbon fiber reinforced thermoplastic (CFRT) composite, fabricated by Mark One® printer. Three kinds of tensile test specimens were printed according to Fig. 25, with the same thickness and the quantity of the layers (10 layers). In fact, the first kind of the printed specimens were made of 100% Nylon (10 layers). The second type of the prepared samples (6CF) consisted of two layers of Nylon, six middle layers of carbon fiber reinforced thermoplastic, and two layers of Nylon, again.
The third kind of printed specimens (2CF) was composed of four layers of Nylon, then two middle carbon fiber reinforced thermoplastic composite, and the four layers of Nylon.
The 6CF specimens showed more tensile strength in comparison with other stated specimens. The tensile strength of the 2CF specimens was about one-third of the prepared 6CF. The cross-section of the 2CF and 6CF specimens were exposed to micro-observation, according to Fig. 26. The observed void areas in 6CF were more in comparison with Fig. 25 Schematic drawing of the
three types of samples created by the Mark One® From left to right: 100% Nylon® specimen, 2CF specimen, 6CF specimen [42]
Fig. 26 Cross-sections of the carbon fiber (2 and 6 layers) reinforced Nylon specimens. (a): It shows a cross-section of the 6CF specimen. (b): It shows the cross-section of a 2CF specimen. As can be seen, there is a lot more void area visible in (a) than in (b) [42]
2CF specimens. In addition, it has been reported that the 2CF specimens were close to the rule of mixing for the composite specimens that were made by the conventional methods, against the 6CF specimens were not close. The existence of more void areas in 6CF has been stated as the reason for this matter.
Kuldeep Agarwal et al. [43], studied on comparison of composite filament fabrication (CFF) which was Nylon-fiberglass reinforced polymer, and conventional composite pro- cesses, which was Epoxy-fiberglass, made by wet lay-up and vacuum bagging. System 1000 Epoxy resin with stated viscosity of 850 cps at 77 ֯°F and Saertex 955 g/m2 stitched unidirectional fiberglass have been utilized for matrix and reinforcement, respectively.
The process parameters’ effect on the mechanical properties of the printed composite were studied. The tensile test and fatigue test were conducted to evaluate the mechanical properties. The dimensions of the tested specimens were 250 mm long, 25 mm wide, and 2.5 mm thick. The standards of ASTM D3039 and ASTM D3479,28 have been utilized for tensile and fatigue tests, respectively. The tension-tension fatigue test at the frequency of 5 Hz was applied. The applied parameters have been related to fiber volume fraction and fiber-layering technique. In the concentric infill pattern related to reinforcements, fiber rings were printed around the perimeter of the specimen, from the outer to the inner section of the specimen. In addition, in the isotropic infill pattern, fiber reinforcement is printed linearly and unidirectionally in a considered direction in a horizontal plane.
According to the mean stress–strain curves, related to the tensile test, (Fig. 27), the prepared specimens with a higher volume fraction of fiber, showed higher strength. The printed composite was stronger than the prepared composite by wet lay-up and vacuum bagging. The isotropic fill related to 0֯ orientation had a higher strength. Also, the 45° and 90° orientation had lower strength, in comparison with the 0° ones. In the comparison to the used conventional method, it was reported that the manufactured specimens by wet lay-up had about 30–40% lower strength in comparison with manufactured specimens by vacuum bagging. Also, the better adhesion between the layers, which probably caused the delamination between the layers of the prepared composite, by wet lay-up, was the main failure mechanism.
Fig. 27 Stress–strain curves after tensile test of 3D printed Nylon-fiberglass composites, compared with Epoxy-fiberglass composites manufactured by conventional composite processes for range of fiber orienta- tions [43]
According to Figs. 28 and 29, the prepared 50% volume fraction composites had better fatigue performance in comparison with the prepared 25% volume fraction, according to the tension-tension fatigue results at the frequency of 5 Hz (Figs. 27 and 28). The printed isotropic longitudinal composite (0°) showed the highest fatigue property followed by the printed concentric, 12-layers specimens. Also, the vacuum bagging, as a conventional pro- cess, resulted in parts that had a fatigue performance just near to the concentric composite, also about 70–80% of the printed isotropic composite.
Oztan et al. [44], studied the microstructures related to the various three-dimensional- printed continuous fiber composites and their connection to the mechanical test results, which the tensile test was considered. The printed prepared samples were unidirectional carbon fibers in nylon matrix, unidirectional Kevlar fibers in nylon matrix, and Kevlar fibers in nylon matrix in the directions of ± 45°. Also, the unreinforced nylon specimens Fig. 28 Fatigue lifetime for 25% volume fraction related to 3D printed Nylon-fiberglass composites, com- pared with Epoxy-fiberglass composites manufactured by conventional composite processes, 0° orientation [43]
Fig. 29 Fatigue lifetime for 50% volume fraction, 0° orientation [43]
with 100% fill density were printed by Mark One printer. The PLA specimens were printed in 100% fill density condition, by Ultimaker2 printer (Fig. 30).
The comparison between the manufactured polymer specimens by 3D printing and traditional methods (in which the PLA and nylon filament samples from the supply coil of the printer were used), was made, too. The related tensile test results of the unidi- rectional and the printed PLA and nylon were according to Fig. 31. According to the tensile test results, the tensile strengths of the printed polymers were lower than those, which were traditionally fabricated. This distance between the tensile strengths, were more obvious, in the case of the nylon samples. In fact, the related ultimate strength of the printed nylon was reported as half of the nylon’s samples, which were traditionally fabricated. Also, the start of the stiffness loss has happened in the printed specimens, firstly in comparison with the traditionally fabricated ones. It was reported that the max- imum tensile strain values were independent of the manufacturing methods, against the ultimate stress.
Then, the microscopic observations were applied according to Fig. 32. Figure 32(a) is related to the cross-hatched pattern. The imperfect fusion of the layers (between the layers) is visible clearly. Also, a common defect of the printed material, which is the rectangular gap, was observed in Fig. 32(b). Figure 32(c) is related to the insufficient material inter- diffusion between the printed lines, which causes the surface roughness on the upper print face. Figure 32(d) is reported as the related SEM photo to the observed porosities in PLA samples, which caused the mechanical properties reduction.
Therefore, according to the tensile test results of the printed reinforced composites (Fig. 33), it was reported that all tensile tested specimens had a linear-elastic behavior.
The comparison between the matrix and the fiber types, also their related orientation, is Fig. 30 3D-printed samples
were used in the research. Left to right: PLA sample produced using Ultimaker 2 printer, ± 45°
Kevlar fiber, unidirectional Kev- lar fiber, unidirectional carbon fiber, and unreinforced nylon matrix [44]
Fig. 31 Stress–strain curves of the 3D-printed and traditionally fabricated polymers (a) Nylon specimens and (b) PLA specimens [44]
clear according to Fig. 32. The printed carbon fiber reinforced composites had the highest tensile strength and the lowest failure strain, in comparison with the Kevlar fiber-reinforced composites. The fabricated Kevlar-reinforced composites, in the orientation of ± 45°, had lower tensile strength in comparison with the unidirectional ones. It was reported that the strength of the unreinforced nylon samples was increased by a factor of 2–11, depending on the specimen direction.
Fig. 32 Microstructural defects in 3D-printed, unreinforced polymer specimens. (a) Crosshatch voids in nylon sample, (b) fiber tow gaps in nylon sample, (c) surface roughness in nylon sample, and (d) micropo- res at the surface of PLA sample [44]
Fig. 33 Stress–strain curves of the 3D-printed composites (unidirectional carbon fibers in nylon matrix, unidirectional Kevlar fibers in nylon matrix, ± 45°-oriented Kevlar fibers in nylon matrix, also the unreinforced nylon specimens with 100% fill density, according to Fig. 29) [44]
According to the related micro-observation (Fig. 34), the rupture of the carbon fibers was brittle; also there was no distortion or elongation of the broken ends. However, the fracture of the Kevlar fibers was ductile and the related elongation and distortion in the failure section were reported.
Dong et al. [45], studied on the continuous Kevlar fiber reinforced nylon thermoplastic, manufactured by Mark One printer as FFF process. Four parameters were considered to study to understand the mechanical properties development, by use of the continuous Kev- lar fibers as reinforcement into 3D printer reinforced nylon composites. These four param- eters were as below:
1) Effect of fiber orientation 2) Effect of the layer position 3) Effect of volume fraction 4) Effect of the infill orientation
In addition, the details of the samples were as Table 5.
As the effect of the fiber orientation, samples 8 and 9 were studied. Sample 8 was con- sisting of 5 layers of 0°-Kevlar fibers and 5 layers of 90°-Kevlar fibers. Also, sample 9 was Fig. 34 SEM images of fractured fibers, (a) carbon fibers showing brittle damage morphology, and (b) Kev- lar fibers showing significant elongation and distortion, after tensile tests [44]
Table 5 The design parameters of continuous Kevlar fiber reinforced composites (KFRCs) [45]
Sample No Total Layers Layers of fibers Direction of fibers Position of fiber layers
1 20 10 0 6–15
2 20 10 90 6–15
3 20 10 0 2–6, 15–19
4 20 10 90 2–6, 15–19
5 20 0 - -
6 20 18 0 -
7 20 18 90 -
8 20 10 0°-5, 90°-5 6–15
9 20 10 45°-5, -45°-5 6–15
10 Same as No.1 but with 0°- and 90°-degree Nylon
consisting of 5 layers of 45° fibers and -45° fibers. It was stated that the continuous Kevlar fiber showed high elastic modulus in the longitudinal direction. The Young’s modulus and tensile strength of the continuous KFRs in this research were higher than the printed short fiber-reinforced composites, reported by [46]. As the effect of the layer position, it was concluded that the fiber position does not have influence the related tensile modulus of the fabricated continuous KFRCs, by FFF. Also, it was understood that the related tensile stress of sample 3 was lower than sample 1, at the break.
As the effect of volume fraction, it was stated that the higher volume fraction of the used Kevlar fibers, could improve related tensile stress and elastic modulus to the break. But the condition of the fiber and nylon matrix may be causing the lower ultimate strength and elastic modulus of the continuous Kevlar fiber-reinforced composites than the predicted value from the rule of mixtures. As the effect of the infill orientation, the related infill angles of Nylon in the printed composite samples were ± 45° by default, except sample 10. In fact, sample 10 was printed with 0° and 90° infill angles. The fiber direction in samples 1 and 10 was parallel to the tensile direction. It was stated that the effect of the infill angle of Nylon could be neglected, because it was much lower than the Kevlar fiber, according to the related stress–strain curves of sample 1 and 10. Also, this effect was studied by samples 8 and 9, too. The related stress–strain curves are as Fig. 35.
The failure mode of the tested samples was debonded on the Kevlar fibers orien- tation. In the case of the unidirectional specimens, in which the Kevlar fiber was in the same direction of the applied stress, the breakage of the unidirectional fibers was reported as the reason for the failure (Fig. 36(c)). Also, in the case of the 90° fibers (perpendicular to the applied tension stress), the failure between two fiber filaments was Fig. 35 Stress–strain curve and breaking points of 3D printed Kevlar fiber reinforced PLA composite with layups shown in Table 5 (a) samples 1, 3, 6, 8, 10 and (b) 2, 4, 5, 7, and 9 [45]
Fig. 36 (a) failure of sample 4, (b) failure of sample 7, (c) failure of sample 8, and (d) shear defor- mation of fibers in sample 9 [45]
reported (Fig. 36(a) and (b)). In case of the failure, related to ± 45° specimens, it was stated that the fibers did not break during the tensile test. The debonding between the Kevlar and nylon layers was stated as the reason for the ± 45° printed specimens. Gener- ally, the difference between the Poisson’s ratio of nylon and fiber layers was stated as the reason for the fiber-nylon layers debonding.
Nekoda van de Werken et al. [47] investigated the mechanical properties of the man- ufactured continuous carbon fiber reinforced Nylon by 3D printing. The specimens were printed utilizing a Markforged commercial printer (Fig. 37).
The microstructure of the 3D printed continuous carbon fiber reinforced Nylon samples were characterized. The printed specimens were cut for cross-sectional microscopic obser- vations. The microscopic observations showed that a huge number of voids were existed in the manufactured specimens by FFF. The existence of the voids was introduced as the rea- son for the failure of the samples at the lower stresses in comparison with the theoretically predicted stresses (Fig. 38).
According to the tensile tested specimens, the various failure modes such as delami- nation, inter-filament failure, and fiber failure were observed, like the prepared com- posite parts by conventional methods. According to the fiber pullout phenomenon observations, the weakness of the related interfacial strength between the matrix and reinforcement was shown (Fig. 39).
Fig. 37 The related 2D internal layer structure of a manufactured continuous carbon fiber reinforced Nylon by 3D printing [47]
Fig. 38 The cross-sectional microstructure of the 3D printed carbon fiber reinforced Nylon specimens (a) the existence of the voids in the 3D printed composite, (b) the carbon fibers as for the reinforcement in the 3D printed carbon fiber reinforced Nylon composite [47]
It was stated that the approached strength of the manufactured specimens by 3D printing strictly depends on the part geometry and infill pattern. In fact, the interfaces between the non-reinforced and reinforced sections and regions and the fiber curvatures caused the multi-axial stress states, stress concentrations, and pre-mature failure in the printed parts.
Ali N. Sarvestani et al. [48] studied the effects of volume fraction and fiber orienta- tion on mechanical properties of the manufactured carbon fiber reinforced polymer com- posites (CFRP) by FFF. Post fracture microscopy observations (Fig. 40) exhibited the fiber pullout phenomenon. The fiber pullout demonstrated that the interfacial strength between the fiber and polymer matrix was relatively low.
Different tensile test sample geometries related to carbon fiber reinforced Nylon com- posite, which caused different fiber volume fractions in the gauge section, were taken Fig. 39 The fiber pullout
phenomenon in the 3D printed carbon fiber reinforced Nylon composite [47]
Fig. 40 Post fracture microscopy observation 3D printed carbon fiber reinforced Nylon composite samples showing fiber pullout [48]
into account. The stated samples were printed by consideration of the different configu- rations for fiber orientation. Any of the samples weren’t broken in the gauge section and none of the samples failed just because of the fiber failure phenomenon. Other modes of damages such as fiber pull, matrix cracking, and delamination were reported (Table 6).
Yolnan Chen et al. [49] studied the effect of the orientation of the used continuous reinforcement on the tensile strength of the manufactured part by FFF. The considered orientations were “concentric” and “isotropic” infill. According to concentric layout, the reinforcement rings printed along the boundary walls of the part, but according to the isotropic fill the reinforcement located at the desired orientation in the one complete layer (Fig. 41).
PLA, ABS, nylon as for polymers, also Carbon fiber, glass fiber, and Kevlar fiber were used as reinforcements. In the case of composite fabrication, the nylon used as matrix and the stated fiber reinforcement materials were applied by Markforged printer.
Firstly, the carbon fibers were used for reinforcing the all below stated geometries and infills via FFF method (Table 7). Then the best fiber orientations, which showed the highest yield stress were selected, and tested with Kevlar fibers and glass fibers.
As for concentric infill type, Fig. 42 exhibits the related stress–strain graph of the concentric fill reinforced nylon. The strongest specimen was reinforced by five concen- tric fiber rings (the highest-fiber volumetric fraction), which had a fracture stress level of 250 MPa. In addition, the reinforced specimens by two concentric fiber rings were the weakest ones.
Figure 43 is related to tensile test results of isotropic fill reinforced nylon. According to the below-obtained results, the reinforced specimens by isotropic infill with two concentric rings of the reinforcement exhibited the highest strength. The volumetric fraction of the reinforcement was reported as almost constant for all of the printed specimens.
Table 6 Tensile test results and prevalent damage modes of the 3D printed carbon fiber reinforced Nylon composite samples, by Mark Two, Markforged [48]
Sample Description Fiber volume
fraction in the gauge section
Modulus of Elasticity (GPa)
Failure Strength (MPa)
Prevalent Damage Mode (failure region)
ASTM D638-14 Type 1 5 7.2 94.7 Matrix failure
(grip region)
12 17.5 258.1 Matrix failure
(grip region)
14 21.3 265.8 Matrix failure
(grip region)
28 55.7 270.4 Delamination
(grip region)
ASTM D638-14 Type 4 24 46.1 171.9 Matrix failure
(grip region)
ASTM D3039/D3039M – 14 30 52.4 580.0 Fiber Fail-
ure + Delamina- (gauge region)tion
![Fig. 5 In-process thermal treat- treat-ment at the different type of heat gradient on printed structure [14]](https://thumb-eu.123doks.com/thumbv2/123doknet/19368575.0/7.659.77.585.85.264/process-thermal-treat-treat-different-gradient-printed-structure.webp)
![Fig. 10 Material weight loss with applied load for (a) 5 min and (b) 10 min, obtained from tribology evalu- evalu-ations [35]](https://thumb-eu.123doks.com/thumbv2/123doknet/19368575.0/12.659.77.584.709.886/material-weight-applied-obtained-tribology-evalu-evalu-ations.webp)
![Fig. 15 SEM images of the fractured cross-sections related to epoxy resin (E-54(616)) reinforced with con- con-tinuous carbon fiber composites [37]](https://thumb-eu.123doks.com/thumbv2/123doknet/19368575.0/16.659.82.586.702.884/images-fractured-sections-related-reinforced-tinuous-carbon-composites.webp)
![Table 4 Statistic results of tensile and flexure strength of three different samples [38]](https://thumb-eu.123doks.com/thumbv2/123doknet/19368575.0/17.659.261.580.85.476/table-statistic-results-tensile-flexure-strength-different-samples.webp)
![Fig. 19 Effect of the liquefier temperature on the flexural strength and modulus of 3D printed continuous carbon fiber reinforced PLA composites [39]](https://thumb-eu.123doks.com/thumbv2/123doknet/19368575.0/19.659.255.588.89.351/effect-liquefier-temperature-flexural-strength-continuous-reinforced-composites.webp)

