ACPD
12, 8269–8318, 2012Characterization of submicrometer aerosol in Po Valley
S. Saarikoski et al.
Title Page
Abstract Introduction
Conclusions References
Tables Figures
◭ ◮
◭ ◮
Back Close
Full Screen / Esc
Printer-friendly Version Interactive Discussion
Discussion
P
a
per
|
Dis
cussion
P
a
per
|
Discussion
P
a
per
|
Discussio
n
P
a
per
|
Atmos. Chem. Phys. Discuss., 12, 8269–8318, 2012 www.atmos-chem-phys-discuss.net/12/8269/2012/ doi:10.5194/acpd-12-8269-2012
© Author(s) 2012. CC Attribution 3.0 License.
Atmospheric Chemistry and Physics Discussions
This discussion paper is/has been under review for the journal Atmospheric Chemistry and Physics (ACP). Please refer to the corresponding final paper in ACP if available.
Chemical characterization of springtime
submicrometer aerosol in Po Valley, Italy
S. Saarikoski1, S. Carbone1, S. Decesari2, L. Giulianelli2, F. Angelini2, K. Teinil ¨a1, M. Canagaratna3, N. L. Ng3,*, A. Trimborn3, M. C. Facchini2, S. Fuzzi2,
R. Hillamo1, and D. Worsnop1,3,4
1
Finnish Meteorological Institute, Air Quality, Helsinki, Finland
2
Institute for Atmospheric Sciences and Climate (ISAC), National Research Council (CNR), Bologna, Italy
3
Aerodyne Research, Inc. Billerica, MA, USA
4
University of Helsinki, Department of Physics, Helsinki, Finland
*
now at: Georgia Institute of Technology, School of Chemical and Biomolecular Engineering and School of Earth and Atmospheric Sciences, Atlanta, GA, USA
Received: 12 March 2012 – Accepted: 14 March 2012 – Published: 28 March 2012 Correspondence to: S. Saarikoski (sanna.saarikoski@fmi.fi)
ACPD
12, 8269–8318, 2012Characterization of submicrometer aerosol in Po Valley
S. Saarikoski et al.
Title Page
Abstract Introduction
Conclusions References
Tables Figures
◭ ◮
◭ ◮
Back Close
Full Screen / Esc
Printer-friendly Version Interactive Discussion
Discussion
P
a
per
|
Dis
cussion
P
a
per
|
Discussion
P
a
per
|
Discussio
n
P
a
per
|
Abstract
The chemistry of submicron particles was investigated at San Pietro Capofiume (SPC) measurement station in the Po Valley, Italy, in spring 2008. The measurements were
performed by using both off-line and on-line instruments. Organic carbon (OC) and
elemental carbon, organic acids and biomass burning tracers were measured off-line
5
by using a 24-h PM1filter sampling. More detailed particle chemistry was achieved by
using an Aerodyne high resolution time-of-flight aerosol mass spectrometer (HR-ToF-AMS) and analyzing the data by positive matrix factorization (PMF). Oxalic acid had
the highest concentrations of organic acids (campaign-average 97.4 ng m−3) followed
by methane sulfonic, formic, malonic, and malic acids. Samples were also analyzed for
10
glyoxylic, succinic, azelaic and maleic acids. In total, the nine acids composed 1.9 and 3.8 % of OC and water-soluble OC, respectively (average), in terms of carbon atoms.
Levoglucosan concentration varied from 17.7 to 495 ng m−3with the concentration
de-creasing in the course of the campaign most likely due to the reduced use of domestic heating with wood. Six factors were found for organic aerosol (OA) at SPC by PMF:
15
hydrocarbon-like OA (HOA), biomass burning OA (BBOA), nitrogen-containing OA
(N-OA) and three different oxygenated OAs (OOA-a, OOA-b and OOA-c). Most of the OA
mass was composed of OOA-a, HOA and OOA-c (26, 24 and 22 %, respectively) fol-lowed by OOA-b (13 %), BBOA (8 %) and N-OA (7 %). As expected, OOAs were the most oxygenated factors with organic matter:organic carbon (OM:OC) ratios ranging
20
from 1.9 to 2.2. The diurnal variability of the aerosol chemical composition was greatly
affected by the boundary layer meteorology. Specifically, the effect of the nocturnal layer
break-up in morning hours was most evident for nitrate and N-OA indicating that these compounds originated mainly from the local sources in the Po Valley. For sulfate and OOA-a the concentration did not change during the break-up suggesting their origin
25
ACPD
12, 8269–8318, 2012Characterization of submicrometer aerosol in Po Valley
S. Saarikoski et al.
Title Page
Abstract Introduction
Conclusions References
Tables Figures
◭ ◮
◭ ◮
Back Close
Full Screen / Esc
Printer-friendly Version Interactive Discussion
Discussion
P
a
per
|
Dis
cussion
P
a
per
|
Discussion
P
a
per
|
Discussio
n
P
a
per
|
measurements in a total new extent elucidating novel features and sources of organic aerosol in the Po Valley region.
1 Introduction
The Po Valley is located in the Northern Italy between two mountain ranges, the Alps in the north and west and the Apennines in the south. It is characterized by a high density
5
of anthropogenic emissions and by the frequent occurrence of stagnant meteorological conditions. There are many large industrial, urban and agricultural areas within the Po Valley, resulting in pollution with diverse composition. The area has been identified as one hot spot place where pollutant levels remain problematic in spite of the application of the current European legislation devoted to air pollution control. In general,
long-10
range transport represents less than half of the air pollution in the Po Valley region (Sofiev et al., 2011), emphasizing the importance of local control measures in the area
to efficiently reduce the impact of air pollution.
Globally, one major air pollution factor is particulate matter. In many locations organic aerosol (OA) makes up a large fraction (20–90 %) of the submicron particulate mass
15
(Sillanp ¨a ¨a et al., 2005; Zhang et al., 2007) whereas the rest of the mass consist of soot, inorganic salts, metals and elements. The inorganic and elemental fraction of the particle mass has been characterized well, while much less is known about the composition of the organic fraction. OA is a complex mixture of many classes of organic compounds, which makes tracking of its sources, atmospheric processing, and removal
20
challenging.
OA quantification and chemical composition analysis methods can be divided into
two categories: off-line and on-line techniques. Off-line techniques, e.g., gas
chro-matography/mass spectrometry (GC/MS), liquid chromatography/MS (LC/MS), nuclear magnetic resonance (NMR) and fourier transform infrared (FTIR) spectroscopy,
pro-25
ACPD
12, 8269–8318, 2012Characterization of submicrometer aerosol in Po Valley
S. Saarikoski et al.
Title Page
Abstract Introduction
Conclusions References
Tables Figures
◭ ◮
◭ ◮
Back Close
Full Screen / Esc
Printer-friendly Version Interactive Discussion
Discussion
P
a
per
|
Dis
cussion
P
a
per
|
Discussion
P
a
per
|
Discussio
n
P
a
per
|
techniques (e.g., aerosol mass spectrometry, AMS) usually provide less specific infor-mation on the composition, i.e., some level of chemical characterization without details on individual species, but have the advantage of fast acquisition times providing near real-time data.
The measurements and models reveal organic aerosol to be a highly dynamic
sys-5
tem, tightly coupled to gas-phase oxidation chemistry (Jimenez et al., 2009). Gas-phase reactions transform OA constituents, and OA itself is an intermediate, often form-ing from gas-phase precursors and ultimately returnform-ing, in part, to gas-phase products. Based on the AMS measurements, OA can be separated into oxygenated OA (OOA), hydrocarbon-like OA (HOA), and sometimes other components such as biomass
burn-10
ing OA (BBOA) in most places. It has been found that the majority of OA mass is OOA which can be further deconvolved into low-volatility OOA (LV-OOA) and semi-volatile OOA (SV-OOA) (Ng et al., 2010). There have been some studies in which only one type of OOA has been observed (Allan et al., 2010; Lanz et al., 2010; Slovik et al., 2010) showing that the split between OOA factors depends not only on chemical
heterogene-15
ity but also on the degree of covariance between the factors, and thus on the conditions of the experiment. Increases in OOA are strongly correlated with photochemical activity (Volkamer et al., 2006) and other secondary species (Lanz et al., 2007) indicating that most atmospheric OOA is secondary, formed from either gas-to-particle conversion or oxidized primary OA.
20
The aim of this study was to investigate the chemistry of submicron particles in the Po Valley region in springtime 2008. Earlier publications from the Po Valley region have focused on e.g. water-soluble organic compounds (Decesari et al., 2001; Matta et al., 2003), nucleation (Hamed et al., 2007), aerosol composition measurements conducted on airplane (Crosier et al., 2007) and sources of carbonaceous aerosols using a
com-25
bined14C – macro tracer analysis (Gilardoni et al., 2011). In this study, the off-line filter
ACPD
12, 8269–8318, 2012Characterization of submicrometer aerosol in Po Valley
S. Saarikoski et al.
Title Page
Abstract Introduction
Conclusions References
Tables Figures
◭ ◮
◭ ◮
Back Close
Full Screen / Esc
Printer-friendly Version Interactive Discussion
Discussion
P
a
per
|
Dis
cussion
P
a
per
|
Discussion
P
a
per
|
Discussio
n
P
a
per
|
the Po Valley region as well as to characterize the detailed chemistry of the aerosol in various meteorological conditions. This was the first time when high resolution and source-related aerosol chemistry was examined in the Po Valley region with this extent.
2 Experimental methods
2.1 Measurement site
5
The measurements were conducted at the San Pietro Capofiume (SPC) measurement
station (44◦39′0′′N, 11◦37′0′′E; Decesari et al., 2001) from 30 March to 20 April 2008.
The station is located about 30 km northeast from the city of Bologna, area open to Adriatic Sea to the east side, but enclosed by densely populated areas on its southern, western and northern sides.
10
2.2 PM1filter measurements
2.2.1 Sampling
PM1particles were collected using a filter cassette system (Gelman Sciences) similar
to that described in Saarikoski et al. (2007). Briefly, four upper stages (8–11) of the Berner low-pressure impactor (BLPI; Berner and L ¨urzer, 1980) were used prior to the
15
filter cassette at a flow rate of 80 l min−1 in order to remove particles with an
aerody-namic diameter larger than 1 µm from the sample. The nominal cut-offdiameter (D50)
for the stage 8 is 2 µm with a flow rate of 24.5 l min−1. Filter cassette had two quartz
filters (Whatman) back-to-back in order to take into account the gas-phase artifacts.
The sampling duration for the PM1was 24,h with the filter change taking place at 09:00
20
at local time. The total number of the PM1 samples was 23. The samples were stored
ACPD
12, 8269–8318, 2012Characterization of submicrometer aerosol in Po Valley
S. Saarikoski et al.
Title Page
Abstract Introduction
Conclusions References
Tables Figures
◭ ◮
◭ ◮
Back Close
Full Screen / Esc
Printer-friendly Version Interactive Discussion
Discussion
P
a
per
|
Dis
cussion
P
a
per
|
Discussion
P
a
per
|
Discussio
n
P
a
per
|
2.2.2 OC, EC and WSOC analyses
PM1filter samples were analyzed for organic carbon (OC) and elemental carbon (EC)
by using a thermal-optical carbon analyzer of Sunset Laboratory Inc., Oregon. The temperature program was similar to the method developed by the National Institute for Occupational Safety and Health (NIOSH), except for the last temperature step in the
5
helium phase that was decreased from 850 to 800◦C (Saarikoski et al., 2007). For the
analysis, a 1 cm2 sample piece was punched from the quartz filters. For OC the ratio
of back-up filter to front filter ranged from 5.1 to 16 % being on average 8.1 % whereas for EC there were no detectable concentrations on the back-up filter.
Water-soluble organic carbon (WSOC) was analyzed from the PM1filters with a
To-10
tal Organic Carbon Analyzer equipped with a high sensitive catalyst (TOC-VCPH,
Shi-madzu). For the analysis a 1 cm2 sample piece was punched from the quartz
fil-ters. Prior to the WSOC analysis samples were extracted by shaking the filter piece with 15 ml of Milli-Q water for 15 min. TOC method is described in detail in Timonen et al. (2008). Briefly, the method used was the Non-Purgeable Organic Carbon (NPOC)
15
method in which the sample solution is first drawn to syringe where inorganic carbon (carbonates, hydrogen carbonates and dissolved carbon dioxide) is converted to car-bon dioxide, and subsequently evaporated from the sample, by adding HCl (1 %) to the sample and bubbling it with helium. After that, the sample is injected into an oven,
where it is catalytically oxidized to carbon dioxide at 680◦C and detected by a
non-20
dispersive infrared (NDIR) detector. For WSOC the ratio of front-to-back-up filter varied from 2 to 16 % with an average of 7.0 %.
2.2.3 IC-CD, IC-MS and HPAEC–MS analyses
Inorganic ions and organic acids were determined from the PM1filters by using an ion
chromatograph (IC) connected to a conductivity detector (CD) and a mass
spectrome-25
ter (MS). 1 cm2-piece was punched from the quartz fibre filter and extracted into 5.0 ml
ACPD
12, 8269–8318, 2012Characterization of submicrometer aerosol in Po Valley
S. Saarikoski et al.
Title Page
Abstract Introduction
Conclusions References
Tables Figures
◭ ◮
◭ ◮
Back Close
Full Screen / Esc
Printer-friendly Version Interactive Discussion
Discussion
P
a
per
|
Dis
cussion
P
a
per
|
Discussion
P
a
per
|
Discussio
n
P
a
per
|
The extract was filtered through an IC Acrodisc®syringe filter (13 mm, 0.45-µm Supor®
(PES) membrane, Pall Sciences) that was washed with deionised water freshly prior to the filtering.
Concentrations of major inorganic ions (chloride, nitrate, sulfate, sodium, ammonium, and potassium) were measured using a Dionex ICS-3000 ion chromatography system.
5
Anion analyses were made using a Dionex AG11 guard column (2 mm i.d.×50 mm
length) and a Dionex AS11 analytical column (2 mm i.d.×250 mm length), a 2-mm
ASRS-300 suppressor, a CR-ATC anion trap column and a potassium hydroxide (KOH)
eluent generator. The eluent flow rate was 0.3 ml min−1 and the total run time was
13 min. Gradient run was used for the anion analyses (2–25 mM). Cations were
ana-10
lyzed using a CG12A guard column and CS12A analytical column, a 2-mm CSRS-300 suppressor, a CR-CTC cation trap column and methane sulfonate eluent generator.
Isocratic run (23 mM) was used for the cation analyses with the flow rate of 0.3 ml min−1
and the total run time of 13 min. The sample loop size was 50 µL for both the anion and cation analyses and a conductivity detector was used for the detection of these ions.
15
For the inorganic ions the percentages of back-up to front filters were 4.6 (±3.8), 3.3
(±3.1), 0.070 (±0.081), 1.0 (±0.94) and 0.35 (±0.42) % (average (±SD)) for chloride,
nitrate, sulfate, ammonium and potassium, respectively. For sodium the ratio could not be determined due to its high blank values for the quartz filters.
In order to measure the concentrations of organic acids, the ICS-3000 system was
20
coupled with a quadrupole mass spectrometer (Dionex MSQ™). Ionization technique
used was electrospray ionization in which the operating parameters were chosen so that the minimum fragmentation and the best sensitivity were achieved. The probe
temperature was set to 500◦C, needle voltage to −3 kV, and cone voltage to −40 V.
The molecular ions were monitored using selected ion mode. There are two major
25
advantages of using the mass spectrometer as the detector of the ion chromatograph. First, the use of mass spectrometer as a second detector allows the determination of the concentrations of organic acids which co-elute from the analytical column but
ACPD
12, 8269–8318, 2012Characterization of submicrometer aerosol in Po Valley
S. Saarikoski et al.
Title Page
Abstract Introduction
Conclusions References
Tables Figures
◭ ◮
◭ ◮
Back Close
Full Screen / Esc
Printer-friendly Version Interactive Discussion
Discussion
P
a
per
|
Dis
cussion
P
a
per
|
Discussion
P
a
per
|
Discussio
n
P
a
per
|
are achieved for organic acids when they are detected by a mass spectrometer. The percentages of the back-up to front filters for the identified organic acids were 9.9
(±8.8), 0.33 (±1.1), 2.0 (±2.5), 2.3 (±1.6), 11.7 (±13.2), 11.3 (±9.4), 13.7 (±9.4),
0.62 (±1.3) and 5.3 (±11.4) % for formic, methane sulfonic, glyoxylic, oxalic, malonic,
maleic, succinic, malic and azelaic acids, respectively. For the rest of the organic acids
5
(acetic, adipic, pinonic and pinic acid) the back-up concentrations were close to their detection limits.
The concentrations of monosaccharide anhydrides (MAs; levoglucosan, mannosan and galactosan) were measured using a high-performance anion-exchange chro-matography coupled to electrospray ionization mass spectrometry (HPAEC–MS)
mod-10
ified from the IC-MS system that was used for the organic acids (Dionex ICS-3000 and
Dionex MSQ™). The method is described in more detail in Saarnio et al. (2010). The
preparation of the PM1samples for levoglucosan, mannosan and galactosan analyses
was similar to that of the ions. Levoglucosan, mannosan and galactosan were not an-alyzed from the back-up filters because in the previous studies levoglucosan has not
15
been found on the back-up filters (Yttri et al., 2005).
2.3 Berner low-pressure impactor
Size-segregated aerosol samples were collected using a Berner low-pressure impactor
(flow rate 4.84 m3h−1) in which particles were classified into five size fractions
accord-ing to the followaccord-ing equivalent aerodynamic cut-offdiameters at 50 % efficiency: 0.05,
20
0.14, 0.42, 1.2, 3.5 and 10 µm. Aluminum and Tedlar foils were used simultaneously as sampling substrates for the determination of total carbon (TC) and of water-soluble components, respectively (Matta et al., 2003). Daytime and night-time samples were collected separately between approximately 08:00 and 20:00 at local time.
Conse-quently, the sampling time of each PM1 filter (Sect. 2.2.1) overlapped approximately
25
with two consecutive BLPI samples.
ACPD
12, 8269–8318, 2012Characterization of submicrometer aerosol in Po Valley
S. Saarikoski et al.
Title Page
Abstract Introduction
Conclusions References
Tables Figures
◭ ◮
◭ ◮
Back Close
Full Screen / Esc
Printer-friendly Version Interactive Discussion
Discussion
P
a
per
|
Dis
cussion
P
a
per
|
Discussion
P
a
per
|
Discussio
n
P
a
per
|
extensively in a companion paper (Decesari et al., 2012), and are used in this study mainly as supporting data for the comparison and validation of the parallel
measure-ments with the PM1 filters and AMS. To this aim, the concentrations determined on
each BLPI sample were cumulated over the three finest size ranges (up to 1.2 µm of particle diameter).
5
2.4 High-resolution time-of-flight aerosol mass spectrometry
The particle chemical composition was measured by using a high-resolution time-of-flight aerosol mass spectrometer (Aerodyne Research Inc., USA; DeCarlo et al., 2006). The operation of the HR-ToF-AMS is given here only shortly. The AMS has three main sections: an aerosol inlet, particle sizing chamber and particle detection section. The
10
aerosol inlet samples submicron particles into the AMS through an aerodynamic lens forming a narrow particle beam. The beam is transmitted into the detection chamber in which non-refractory components of aerosol are flash vaporized upon impact on hot
surface (∼600◦C) under high vacuum (∼10−5Pa). After that the components are
ion-ized by electron impact ionization and the ions are detected by a mass spectrometer.
15
The transmission of the particle beam to the detector is modulated with a mechani-cal chopper. The chopper has three positions. An “open” position transmits the beam continuously, “closed” position blocks the beam completely, and “chopped” position modulates the beam transmission with a 1–4 % duty cycle which is determined by the width of the slit in chopper (Jayne et al., 2000).
20
AMS alternates between two modes of operation: mass spectrum (MS) and particle-Time-of-Flight (PToF) mode. In the MS mode the chopper is in open position to obtain an ensemble-average MS of the sampled air. Signal from the background gases is ac-counted for by subtracting the MS obtained with the chopper in closed position. The particle size is determined in the PToF mode. When the chopper is operating in the
25
ACPD
12, 8269–8318, 2012Characterization of submicrometer aerosol in Po Valley
S. Saarikoski et al.
Title Page
Abstract Introduction
Conclusions References
Tables Figures
◭ ◮
◭ ◮
Back Close
Full Screen / Esc
Printer-friendly Version Interactive Discussion
Discussion
P
a
per
|
Dis
cussion
P
a
per
|
Discussion
P
a
per
|
Discussio
n
P
a
per
|
W-mode the ions exiting the reflector are directed into a hard mirror that focuses them back into the reflector for a second time before travelling to a multichannel plate detec-tor. The mass resolving power of the ToF-MS increases as the flight path is lengthened but the lateral broadening of the ions increases over a longer flight path and reduces the total signal as fewer ions struck the detector. Therefore the V-mode is more
sensi-5
tive but the W-mode offers higher mass resolution. The resolutions for the V-mode and
W-mode are typically∼2000 and 4000, respectively (DeCarlo et al., 2006). In this study
the time-resolution for the AMS was set to 5 min as one single measurement consists of 2.5 min of V-mode and 2.5 min of W-mode measurements. PTof was measured only in the V-mode (2/3 of time).
10
2.4.1 Collection efficiency
In general a constant collection efficiency (CE) of 0.5 is applied to the AMS data (e.g.,
Allan et al., 2004; Sun et al., 2009; Canagaratna et al., 2007). However, CE can also
be a function of particle phase and chemical composition (Allan et al., 2004; Huffman
et al., 2005; Crosier et al., 2007; Matthew et al., 2008; Takegawa et al., 2009;
Middle-15
brook et al., 2011). Aerosol particles sampled from inlets with high relative humidity and particles with high ammonium nitrate or acid content, for example, have CE
val-ues approaching 1. In general, for nitrate fraction<0.25 a CE of 0.5 is used whereas
for fraction>0.25 CE increases linearly to 1. In this study the observed aerosol was
neutralized (Fig. S1) and the nitrate mass fraction ranged from 0.06 to 0.58 with an
20
average of 0.31.
A collection efficiency of 0.5 was applied for the whole data set as a first guess. With
a CE of 0.5, a comparison between the total mass from the AMS (sum of organics,
ni-trate, sulfate, ammonium and chloride), that from the PM1(sum of OC×1.77; the factor
will be calculated in Sect. 3.2.2, nitrate, sulfate, ammonium, chloride) and
correspond-25
ing size fraction of the BLPI measurements (sum of WSOC×1.8; Docherty et al., 2008,
nitrate, sulfate, ammonium, chloride) is shown in Fig. S2 together with the comparison
ACPD
12, 8269–8318, 2012Characterization of submicrometer aerosol in Po Valley
S. Saarikoski et al.
Title Page
Abstract Introduction
Conclusions References
Tables Figures
◭ ◮
◭ ◮
Back Close
Full Screen / Esc
Printer-friendly Version Interactive Discussion
Discussion
P
a
per
|
Dis
cussion
P
a
per
|
Discussion
P
a
per
|
Discussio
n
P
a
per
|
of AMS-to-BLPI was higher than that of AMS-to-PM1but both the ratios changed during
the campaign. AMS mass concentrations calculated with a CE=0.5 value reproduced
both the BLPI and PM1 during the latter portion of the campaign, but showed a
sys-tematic under-prediction for the aerosol mass concentrations measured by both the instruments during the first weeks of the campaign. Since both instrument
intercom-5
parisons showed this under-prediction, the AMS mass concentrations calculated with
a CE=0.5 from the beginning of the campaign until 9 April 11:33 (local time) were
increased by multiplying them by an additional factor of 1.67. However, the exact rea-son for this under-prediction is not clear. The under-prediction in absolute AMS mass concentrations does not clearly correlate with any changes in the aerosol composition
10
but concerning the meteorology relative humidity was slightly lower from the beginning of the campaign to midday on 9 April (average RH 64 %) than after that until the end of the campaign (average RH 76 %). It is also useful to note that the deviations between
the AMS and PM1 or BLPI for individual 12 h (BLPI) or 24 h (PM1) periods include
un-certainties in the estimated filter mass. For example, the conversion used to calculate
15
organic matter may be higher or lower than the used value of 1.77 (or 1.8 for WSOC). Table S1 shows a summary of the intercomparison between the AMS mass
concen-trations (calculated with a CE=0.5 and corrected for apparent systematic bias before
9 April 11:33) and the PM1and BLPI based mass concentrations. For nitrate the AMS
gave slightly higher concentrations than the BLPI (2 %) or the PM1(16 %) whereas for
20
ammonium the concentrations obtained from the AMS were higher than those from the
BLPI (3 %) but lower than from the PM1(8 %). Sulfate from the AMS was considerably
lower than that from the BLPI (64 %) or PM1 (51 %) but the reason for the low sulfate
concentrations measured by the AMS couldn’t be found. However, one explanation could be that the vaporizer temperature was actually slightly lower than indicated by
25
the thermo-couple temperature measurement (600◦C). This would have an e
ffect on
less-volatile sulfate but not affecting semi-volatiles like ammonium nitrate or most of
organics. Organics from the AMS were compared either with WSOC from the BLPI or
ACPD
12, 8269–8318, 2012Characterization of submicrometer aerosol in Po Valley
S. Saarikoski et al.
Title Page
Abstract Introduction
Conclusions References
Tables Figures
◭ ◮
◭ ◮
Back Close
Full Screen / Esc
Printer-friendly Version Interactive Discussion
Discussion
P
a
per
|
Dis
cussion
P
a
per
|
Discussion
P
a
per
|
Discussio
n
P
a
per
|
from the BLPI, which makes sense since AMS organics include also water-insoluble organic carbon as well as other atoms than carbon (hydrogen, oxygen, nitrogen,
sul-fur). The ratio of AMS organics to OC from the PM1 filters was 1.49 on average. The
ratio of organic matter to organic carbon at SPC will be discussed later in this paper.
The correlations between the AMS species and those from the PM1or BLPI were good
5
(R =0.83–0.94) except that for sulfate between the AMS and the BLPI (0.69).
2.4.2 Data analysis
All data was analyzed using a standard AMS data analysis software (SQUIRREL v1.49 and PIKA v.1.08B; Sueper 2008) within Igor Pro 6 (Wavemetrics, Lake Oswego, OR). Positive matrix factorization (PMF, Paatero and Tapper, 1994; Lanz et al., 2007; Ulbrich
10
et al., 2009) was conducted on high-resolution mass spectra of organics (W-mode) with
m/z below 100.
PMF was applied to the high-resolution mass spectra of OA by varying the number of
factors from three to ten. The plot ofQ/Qexpvs. number of factors (nF,n=3–10) shows
that when the number of factors was increased Q/Qexp decreased (Fig. S3). PMF
15
solutions from 5F to 7F (MS and time series) are shown in the Supplement (Fig. S4). Of those, 6F-solution seemed to be the most reasonable. In 6F-solution the organic aerosol components were identified as HOA, BBOA, three OOAs (OOA-a, OOA-b and OOA-c) and nitrogen-containing OA (N-OA). The factors were identified according to their MS signatures, diurnal cycles and the correlation of their time series with other
20
aerosol chemical components.
Compared to 6F-solution, in 4F-solution BBOA could not be separated from the other
factors asm/z 60.021 (C2H4O2+) and 73.029 (C3H5O+2), which are known to be tracers
for BBOA, were included in HOA. Starting from 5F-solution, there was a separate factor
for BBOA that had the biomass burning-relatedm/z’s (60.021 and 73.029), however, in
25
5F-solution BBOA did not correlate with levoglucosan (and mannosan and galactosan)
from the PM1filter samples (Fig. S5b). In 6F- and 7F-solutions the correlation between
ACPD
12, 8269–8318, 2012Characterization of submicrometer aerosol in Po Valley
S. Saarikoski et al.
Title Page
Abstract Introduction
Conclusions References
Tables Figures
◭ ◮
◭ ◮
Back Close
Full Screen / Esc
Printer-friendly Version Interactive Discussion
Discussion
P
a
per
|
Dis
cussion
P
a
per
|
Discussion
P
a
per
|
Discussio
n
P
a
per
|
BBOA and WSOC, EC, K and most of the organic acids, analyzed from the PM1filters,
increased going from 5F- to 6F-solution. These correlations were even slightly better in 7F-solution.
The other factors did not change as much as BBOA when the number of factors changed. The contributions of HOA and OOA-a to total OA decreased slightly going
5
from 4F-solution to 7F-solution as the new factors were added (Fig. S6a). The correla-tion between HOA and levoglucosan decreased when the number of factors increased
whereas the correlation of HOA with nitrogen oxides (NOx, NO2 and NO) increased
until 6F after which it collapsed (Fig. S5a). OOA-c had little higher contributions in 4F-and 7F- than in 5F- 4F-and solutions. N-OA lost some mass from going from 4F to
6F-10
solution but its contribution increased again in 7F-solution. Compared to 6F-solution, in 6F-solution there was an additional OOA-factor (OOA-b in Fig. S4b) that had MS resembling the two other OOAs (especially OOA-a) with a lot of oxygenated fragments that were shifted from both BBOA and N-OA. However, the time series and diurnal
trend of OOA-b were different from OOA-a and OOA-c. In 7F-solution the additional
15
factor (Factor 6 in Fig. S4c) had similar time series with N-OA and its MS had signal from various nitrogen-containing compounds (Figs. S4c and S6b; additional factor la-beled as N-OAx in Figs. S5, S6). That additional N-OAx factor had very low contribution to the total mass (3.5 % on average; Fig. S6a).
OOA-a and OOC-c were slightly more oxidized when the number of factors increased
20
whereas OOA-b had lower O:C ratio in 7F- than in 6F-solution (Fig. S6b). The ratio of H:C increased for HOA going from 4F- to 7F-solution. Even though the correlations
between PMF factors and PM1 filters were slightly better in 7F-solution compared to
that of 6F-solution, the difference was rather small. Also the seventh factor (N-OAx
in Fig.S5–S6) seemed to be quite unimportant since its contribution was low and the
25
resemblance to N-OA was large (especially in time series and diurnal trends). Thus, 6F-solution was selected for further analysis.
FPeak values were tested to explore the possibility of local minima in the Q space.
ACPD
12, 8269–8318, 2012Characterization of submicrometer aerosol in Po Valley
S. Saarikoski et al.
Title Page
Abstract Introduction
Conclusions References
Tables Figures
◭ ◮
◭ ◮
Back Close
Full Screen / Esc
Printer-friendly Version Interactive Discussion
Discussion
P
a
per
|
Dis
cussion
P
a
per
|
Discussion
P
a
per
|
Discussio
n
P
a
per
|
values for−0.4, −0.2 and 0.2 than for 0 but the difference was small. However, there
was a significant difference in the comparison of BBOA to levoglucosan for different
values offPeaks. For thefPeakvalue of 0 the correlation coefficient (R) was 0.813 (Table
S2) whereas forfPeak of−0.2 and 0.2 the coefficients were 0.412 and 0.336,
respec-tively. Bootstrapping was used to evaluate the statistical uncertainty of 6F-solution. The
5
results from the bootstrapping analysis for MS and time series are shown in Fig. S8. The minimum error value for the error matrix was calculated as the average noise value observed for ions during low signal time periods (Huang et al., 2010).
2.5 Auxiliary data
Micro-meteorological parameters were monitored with a WXT510 (Vaisala)
sta-10
tion. Gaseous ammonia concentrations were measured on-line using an automatic denuder-based system (AMANDA, ECN) while time-resolved concentrations of NO,
NOx and ozone were furnished by the Emilia-Romagna monitoring network for
atmo-spheric pollution. SO2was measured by using a Monitor Labs model 8850.
3 Results and discussion
15
3.1 General description of the measurement campaign
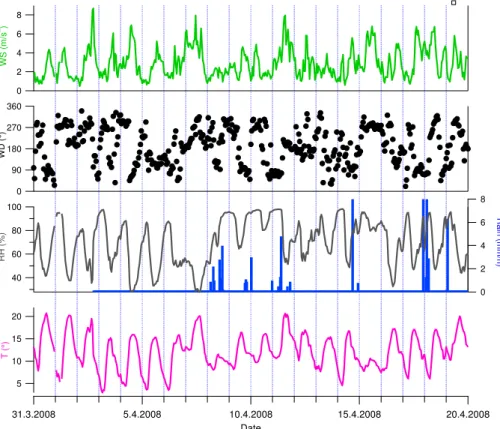
Meteorological conditions during the campaign are presented in Fig. 1. Temperature and wind speed had clear diurnal cycles with higher values observed during the day-time. Relative humidity had peak values in the night. During the campaign temperature
varied from 3 to 21◦C with the campaign-average of 12.2◦C. Relative humidity was
20
in the range of 28–98 % averaging at 70.1 %. There were some showers during the campaign, especially on the second half of the campaign. Wind speed varied from 0.5 to 8.7 m s−1
with an average of 2.9 m s−1
ACPD
12, 8269–8318, 2012Characterization of submicrometer aerosol in Po Valley
S. Saarikoski et al.
Title Page
Abstract Introduction
Conclusions References
Tables Figures
◭ ◮
◭ ◮
Back Close
Full Screen / Esc
Printer-friendly Version Interactive Discussion
Discussion
P
a
per
|
Dis
cussion
P
a
per
|
Discussion
P
a
per
|
Discussio
n
P
a
per
|
The concentrations of inorganic gases are shown in Fig. S9. At the beginning of
the campaign (until 5 April) the concentrations of NOx, NO and NO2were significantly
higher than during the rest of the campaign. For the other gases same kind of time
trend could not be observed even though for SO2there were several periods when the
concentrations increased considerably.
5
In general the measurement campaign can be divided into five distinct time periods. During the first period (Period I), from 30 March to 6 April, the pollutant levels were quite high and there were clear diurnal cycles in the aerosol concentration and com-position. According to the backward trajectories (HYSPLIT) air masses came to SPC mostly from the north-east or north. The second period (Period II), 7 April, was
char-10
acterized by low background conditions and a significant transport from outside of the Po Valley. Air masses arrived in SPC from south-west, from Mediterranean. The third period (Period III), from 8 April to noon on 11 April, had the highest concentrations lev-els observed during the campaign with only a little diurnal variation. According to the trajectories air masses came from south and south-west during Period III. The fourth
15
period (Period IV), from noon 11 to noon 12 April, was the second background period. Similar to the first background period the air masses came from the Mediterranean. The fifth period (Period V) was from noon 12 April to the end of the campaign, and it was characterized by the high variability in the concentrations and intermittent scavenging. During Period V the air masses arrived in SPC from south-west sector.
20
3.2 Chemical composition of fine particles
3.2.1 Non-refractory species from the HR-ToF-AMS
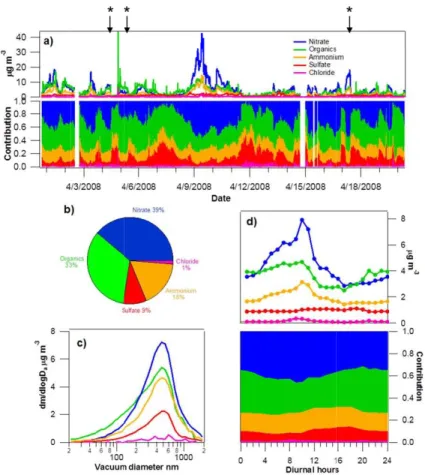
Fine particles at SPC were mostly composed of nitrate followed by organics (Fig. 2).
For nitrate the concentrations ranged from 0.03 µg m−3to 43.7 µg m−3whereas the
con-centrations of organics varied from 0.2 µg m−3to 42.8 µg m−3(15 min averages). Nitrate
25
ACPD
12, 8269–8318, 2012Characterization of submicrometer aerosol in Po Valley
S. Saarikoski et al.
Title Page
Abstract Introduction
Conclusions References
Tables Figures
◭ ◮
◭ ◮
Back Close
Full Screen / Esc
Printer-friendly Version Interactive Discussion
Discussion
P
a
per
|
Dis
cussion
P
a
per
|
Discussion
P
a
per
|
Discussio
n
P
a
per
|
concentrations (42.8 µg m−3) were measured in the late night on 4 April (Period I),
how-ever, none of the other species measured by the HR-ToF-AMS increased at the same time. The peak concentration of organics was most likely caused by a vehicle
bypass-ing the site indicated by a high signal atm/z 55 and 57 (Canagaratna et al., 2004). The
campaign-average concentrations for organics, nitrate, ammonium, sulfate and
chlo-5
ride were 3.8±2.7, 4.4±5.3, 1.9±1.8, 0.9±0.5, and 0.14±0.2 µg m−3, respectively.
The measured ammonium concentrations matched with ammonium required to fully
neutralize sulfate, nitrate and chloride with a linear correlation coefficient (R) of 0.99
and a slope of 0.88 (Fig. S1).
On average, 39 % of the particle mass was made of nitrate, 33 % of organics, 18 %
10
of ammonium, 9 % of sulfate and 1 % of chloride (Fig. 2b). The mass contributions of sulfate and nitrate varied during the campaign in contrast to the contributions of organics, ammonium and chloride that were more steady (Fig. 2a). In general, the contribution of sulfate was larger when the absolute concentrations were low whereas the large relative contributions of nitrate corresponded to large absolute concentrations
15
of nitrate.
The campaign-average diurnal trends for organics, nitrate, sulfate, ammonium and chloride are presented in Fig. 2d. Largest diurnal variation was observed for nitrate.
Ni-trate had clearly higher concentrations from early morning (∼04:00) to noon (∼12:00)
peaking at 10:00. After 10:00 the concentrations started to decrease due to the transfer
20
of ammonium nitrate from particles to gas-phase and the development of mixing layer. The early morning increase can be explained by the local sources of nitrate precursors
(traffic) and the poor mixing of pollutants in nighttime. The diurnal trend for ammonium
followed closely that of nitrate. The concentration of organics was quite stable in the
night and early morning but it decreased∼10:00 and stayed at a lower level until the
25
evening (∼20:00) reflecting the change in the boundary layer height and the mixing
ACPD
12, 8269–8318, 2012Characterization of submicrometer aerosol in Po Valley
S. Saarikoski et al.
Title Page
Abstract Introduction
Conclusions References
Tables Figures
◭ ◮
◭ ◮
Back Close
Full Screen / Esc
Printer-friendly Version Interactive Discussion
Discussion
P
a
per
|
Dis
cussion
P
a
per
|
Discussion
P
a
per
|
Discussio
n
P
a
per
|
2006), was not observed in the concentration of organics. However, regarding the ele-mental composition of organics (Sects. 3.2.2 and 3.4) the formation of SOA could be speculated. Regarding sulfate the diurnal trend was almost the opposite of organics. The concentration of sulfate increased slightly in the afternoon, which suggests that the origin of sulfate was mostly regional since its concentration increased when the
5
mixing layer was developed. Moreover, ammonium sulfate is a non-volatile component meaning that there is not significant evaporation from particles to gas-phase with higher
temperatures in the afternoon. For chloride there was a peak in the morning (∼06:00–
12:00) that coincided with the trend of ammonium suggesting that chloride might be in the form of ammonium chloride. Even though all the species had a diurnal trend,
10
their diurnal mass contributions were fairly steady throughout the day (Fig. 2d). For the nitrate mass contribution the diurnal pattern followed that of the concentration with slightly larger contributions from 04:00 to 14:00 whereas the contribution of organics had just the opposite trend. The mass contribution of sulfate was highest in the
after-noon. The effect of nocturnal surface layer break-up on particle chemical composition
15
will be discussed more detailed in Sect. 3.4.
The average mass size-distributions from 9 to 20 April are shown in Fig. 2c for or-ganics, nitrate, sulfate, ammonium and chloride. There was no size-distribution data before 9 April because of the incorrect chopper parameters of PToF. On average, or-ganics, nitrate, sulfate and ammonium had one accumulation mode peaking at the size
20
of 500 nm. For chloride the concentrations were too low for the proper size distribution measurements. The shape of the size-distributions was very similar for nitrate, sulfate and ammonium suggesting that they were internally mixed but organics had a wider distribution with more particulate mass at the size range of 30–350 nm compared to the peak of the mode. Obviously, the size distribution of organics is multi-modal and
25
ACPD
12, 8269–8318, 2012Characterization of submicrometer aerosol in Po Valley
S. Saarikoski et al.
Title Page
Abstract Introduction
Conclusions References
Tables Figures
◭ ◮
◭ ◮
Back Close
Full Screen / Esc
Printer-friendly Version Interactive Discussion
Discussion
P
a
per
|
Dis
cussion
P
a
per
|
Discussion
P
a
per
|
Discussio
n
P
a
per
|
not change much during the campaign (not shown), however, the concentration level
had a slight effect on the size-distribution. When the concentrations were very low
(Pe-riods II and IV), nitrate, ammonium and organics peaked at 550 nm but the peak shifted to 500 nm when the concentrations increased (especially in Period III). For sulfate the shift could not be seen as its concentration level was quite stable throughout the
cam-5
paign.
3.2.2 Elemental composition
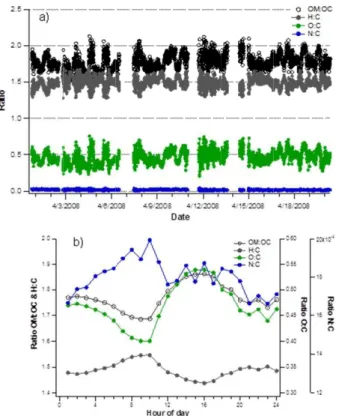
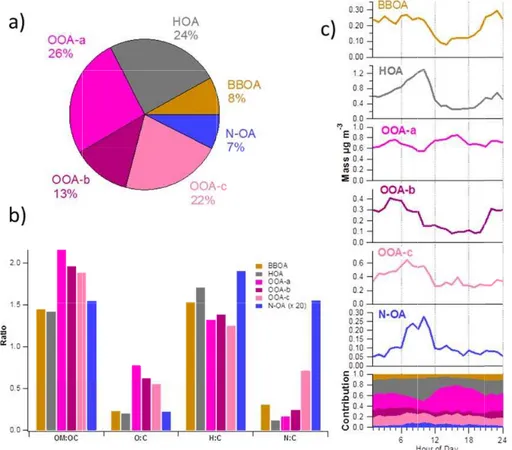
High resolution mass spectra obtained in this study enabled the investigation of the molecular ratios of O, C, H, N and S in organic aerosol. O:C ratio varied from 0.25 to 0.75 with an average of 0.47 (Fig. 3a). It had a clear diurnal variation with the smallest
10
ratio in the morning (08:00–10:00) and the largest ratio in the afternoon (13:00–17:00; Fig. 3b). Higher O:C ratios in the afternoon can be explained by several factors. In-creased contribution of oxygen in OA can result from the oxidation of OA (SOA forma-tion) in the afternoon but also from the mixing of nocturnal surface layer aerosol with the aerosol aloft, that is more oxidized, with the mixing layer development. That will be
15
discussed later with the PMF factors and in Sect. 3.4. The campaign-average H:C ratio was 1.49. For H:C ratio the diurnal trend was just the opposite of O:C ratios having the largest ratio in the morning (08:00–10:00) and smallest in the afternoon (14:00–17:00). Only few sulfur-containing organic compounds were detected at SPC (e.g. MSA, Sect. 3.3.) resulting in a very low campaign-average S:C ratio (0.0014). However, there
20
was a notable amount of nitrogen-containing organic compounds (CxHyN) and
there-fore a clear N:C ratio for OA. The highest N:C ratios observed were∼0.04. The diurnal
trend for the N:C ratio followed roughly the trend of H:C (Fig. 3b) and nitrate (Fig. 2d) with the morning maximum. That suggests the nitrogen-containing compounds to be
related to vehicle traffic but the morning peak can also originate from a continuous
ac-25
ACPD
12, 8269–8318, 2012Characterization of submicrometer aerosol in Po Valley
S. Saarikoski et al.
Title Page
Abstract Introduction
Conclusions References
Tables Figures
◭ ◮
◭ ◮
Back Close
Full Screen / Esc
Printer-friendly Version Interactive Discussion
Discussion
P
a
per
|
Dis
cussion
P
a
per
|
Discussion
P
a
per
|
Discussio
n
P
a
per
|
Compared to the H:C ratio, N:C ratio did not decrease steeply after the morning max-imum, it rather decreased slowly towards the night minimum. On average, the ratio of N:C was 0.018. Nitrogen-containing organic compounds will be discussed later in this paper.
The organic mass:organic carbon (OM:OC) ratio varied from 1.4 to 2.1 during the
5
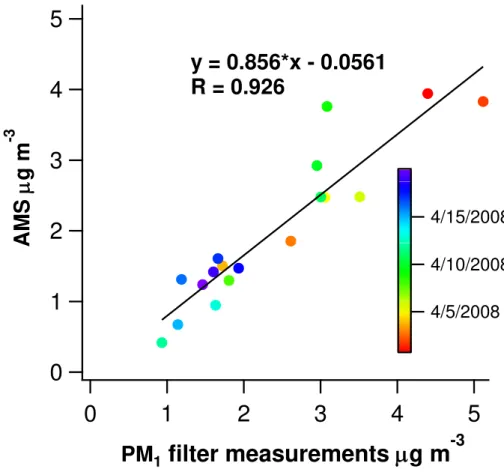
campaign with an average of 1.77 (Fig. 3a). It had a similar diurnal pattern to that of O:C in line with the previous results that showed the O:C ratio being the term that governs the OM:OC ratio (Pang et al., 2006). The concentration of organics was divided by the OM:OC ratio in order to get the concentration of OC from the ToF-AMS. That HR-ToF-AMS OC was compared to the OC concentrations obtained by analyzing the 24-h
10
PM1filters by thermal-optical method in the laboratory (Fig. 4). The two measurements
of OC correlated well (R =0.926) with the HR-ToF-AMS giving 14 % lower values. That
could be due to several things i.e. the gas-phase artifacts in the filter sampling or the
collection efficiency applied for the HR-ToF-AMS data.
3.2.3 Organic acids from the PM1samples
15
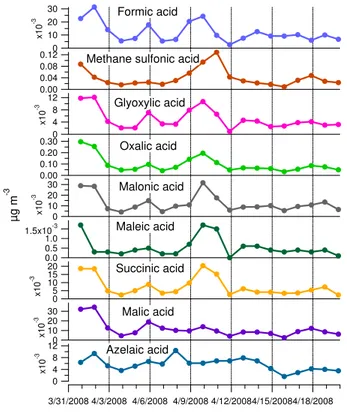
Organic acids were analyzed from the 24-h PM1 filter samples. The highest
concen-trations were measured for oxalic acid with an average of 97.4 ng m−3during the
cam-paign (Fig. 5). Oxalic acid comprised roughly half of the total amount of all organic acids determined. The concentrations of formic, malonic and malic acid were much lower than those of oxalic acid but on average they were higher than those of glyoxylic,
20
succinic and azelaic acids. Maleic acid concentrations were barely above the detection limit in many samples. Methane sulfonic acid had smaller concentrations than oxalic acid but larger concentrations than the other acids its campaign-average concentration
being equal to 38.7 ng m−3. Individually organic acids comprised from 0.0091 to 0.97 %
of OC and from 0.018 to 1.9 % of WSOC in terms of carbon atoms. In total, the nine
25
ACPD
12, 8269–8318, 2012Characterization of submicrometer aerosol in Po Valley
S. Saarikoski et al.
Title Page
Abstract Introduction
Conclusions References
Tables Figures
◭ ◮
◭ ◮
Back Close
Full Screen / Esc
Printer-friendly Version Interactive Discussion
Discussion
P
a
per
|
Dis
cussion
P
a
per
|
Discussion
P
a
per
|
Discussio
n
P
a
per
|
acid was much larger at SPC than at any of the seven European sites participating the CARBOSOL project (Legrand et al., 2007). Also the concentrations of formic and malic acids were much larger at SPC than those measured earlier in Zurich, however, in the same Zurich study the concentration of maleic acid was close to that measured at SPC (Fisseha et al., 2006).
5
The daily variation of formic, glyoxylic, oxalic, malonic and succinic acids was re-markably similar (Fig. 5). They all have the highest concentrations in the first two samples (31 March–1 April and 1–2 April) and in the second polluted period (Period
III). Their concentrations correlated strongly with each other (PearsonR=0.76–0.94),
which suggests that these acids were either primarily emitted (or fast secondarily
pro-10
duced) together or formation processes of these acids were somehow related. How-ever, since they also correlated with inorganic compounds, nitrate, sulfate, ammonium,
and potassium, as well as with OC analyzed from the PM1filters, it seems that more
than indicating similar sources/atmospheric processing the correlations displayed the
difference between polluted air masses coming from the urban areas in the Po Valley
15
and the cleaner air masses coming from the Mediterranean. Malic acid had somewhat similar time evolution with formic, glyoxylic, oxalic, malonic and succinic acids (Fig. 5). Its concentration was the highest for the first two samples, however, during the second polluted period malic acid did not increase noticeably.
Maleic acid had slightly different behavior from formic, glyoxylic, oxalic, malonic,
suc-20
cinic and malic acids. It also had the highest concentrations in the first sample (31
March–1 April) and Period III but it correlated weaker with other acids (R =0.18–0.77)
as well as inorganic components, OC and EC in the PM1filters. In addition to different
sources and/or formation processes low correlation could be due to the high uncer-tainty associated with its concentrations during the clean period. Also the time evolution
25
of azelaic acid was different from the other organic acids since its concentrations didn’t
ACPD
12, 8269–8318, 2012Characterization of submicrometer aerosol in Po Valley
S. Saarikoski et al.
Title Page
Abstract Introduction
Conclusions References
Tables Figures
◭ ◮
◭ ◮
Back Close
Full Screen / Esc
Printer-friendly Version Interactive Discussion
Discussion
P
a
per
|
Dis
cussion
P
a
per
|
Discussion
P
a
per
|
Discussio
n
P
a
per
|
acid is formed from unsaturated fatty acids, e.g. oleic acid, by oxidation. These unsat-urated acids are found in marine phytoplankton and terrestrial higher plant leaves but they are also emitted by anthropogenic sources such as meat cooking (Rogge et al., 1991) and wood burning processes (Rogge et al., 1998). Methane sulfonic acid
cor-related moderately with the other acids, however, it corcor-related strongly with PM1filter
5
chloride since it is most likely an oxidation product of dimethyl sulfide (DMS) which is produced by ocean phytoplankton (Seinfeld and Pandis, 1998).
Kawamura and Ikushima (1993) proposed that malonic acid is produced by photo-chemical oxidation of succinic acid in the atmosphere, and hence malonic-to-succinic acid ratio has been used as an indicator of enhanced photochemical production of
10
diacids (Kawamura et al., 1996; Bavuluri at al., 2010). At SPC the average ratio of malonic-to-succinic acid was 1.74 ranging from 0.83 (first sample) to 2.83 (last sam-ple). In general, the trend was that the ratio increased as the spring progressed.
3.2.4 Biomass burning tracers from the PM1samples
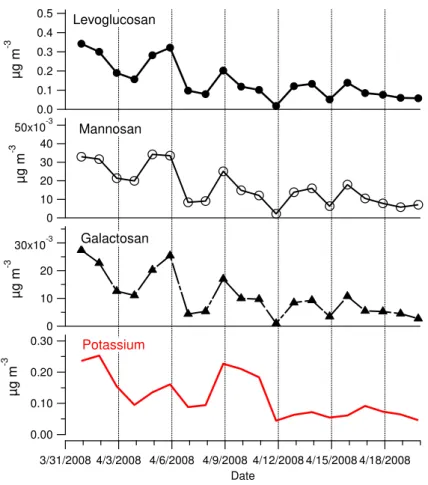
Three monosaccharide anhydrides, levoglucosan, mannosan and galactosan, were
an-15
alyzed from the PM1filter samples. They are all produced exclusively during the
pyrol-ysis of cellulose and hemicellulose, which makes them specific atmospheric tracers for biomass combustion emissions (Simoneit et al., 1999; Nolte et al., 2001).
The concentration of levoglucosan varied from 17.7 to 495 ng m−3 during the
cam-paign with the highest concentrations observed in the first sample (31 March–1 April)
20
and the sixth sample (5–6 April; Fig. 6). In general, the concentration decreased in the course of the campaign. That was most likely due to the reduced use of domestic heat-ing with wood due to slightly higher night temperatures, although the daily-averaged ambient temperature was rather stable during the campaign (Fig. 1). The lifetime of levoglucosan can be prone to hydroxyl radical exposure (Hennigan et al., 2010) but
25
ACPD
12, 8269–8318, 2012Characterization of submicrometer aerosol in Po Valley
S. Saarikoski et al.
Title Page
Abstract Introduction
Conclusions References
Tables Figures
◭ ◮
◭ ◮
Back Close
Full Screen / Esc
Printer-friendly Version Interactive Discussion
Discussion
P
a
per
|
Dis
cussion
P
a
per
|
Discussion
P
a
per
|
Discussio
n
P
a
per
|
The campaign-average concentration of levoglucosan was 176 ng m−3 that
corre-sponded to 2.7 % of OC and 4.1 % of WSOC in terms of carbon atoms. Those were in the range of values obtained earlier in Europe (Saarikoski et al., 2008). The concentra-tions of mannosan and galactosan were much smaller than that of levoglucosan having
the campaign-averages of 19.3 and 12.8 ng m−3, respectively. The concentrations of
5
the three biomass tracers followed each other closely (Fig. 6) with the proportions of
84.4 (±1.34), 9.56 (±0.92) and 6.0 (±0.90) % for levoglucosan, mannosan and
galac-tosan, respectively (average±std). These proportions were close to those measured
in Helsinki, Finland (Saarnio et al., 2010) but somewhat different from those detected
in Norway (Yttri et al., 2005). In Norway the proportions of levoglucosan and
galac-10
tosan were lower whereas that of mannosan was more than twice that measured at
SPC. The correlations between the three tracers were strong (R =0.98–0.99) but they
also correlated with OC (R=0.82–0.87) and EC (R =0.76–0.79) analyzed from the
PM1filters. There were moderate correlations of biomass burning tracers with WSOC,
water-soluble potassium (R =0.55–0.65; Fig. 6) and gaseous NOx, NO, NO2.
15
Levoglucosan, mannosan and galactosan correlated weakly with the organic acids. That finding is in line with the results of Legrand et al. (2007) who found that regional emissions from vehicles and wood burning are the major sources of carboxylic acids in winter in Europe. In summer, the contribution of the anthropogenic processes to acid concentrations is weaker whereas the contribution of biogenic emissions becomes
20
more important.
3.3 AMS-PMF factors
PMF was applied to the high-resolution mass spectra of OA by varying the number of factors from three to ten. 6F-solution seemed to be the most representative based on Fig. S3–S8 and the discussion given in Sect. 2.4.2. PMF factors were denoted
25
ACPD
12, 8269–8318, 2012Characterization of submicrometer aerosol in Po Valley
S. Saarikoski et al.
Title Page
Abstract Introduction
Conclusions References
Tables Figures
◭ ◮
◭ ◮
Back Close
Full Screen / Esc
Printer-friendly Version Interactive Discussion
Discussion
P
a
per
|
Dis
cussion
P
a
per
|
Discussion
P
a
per
|
Discussio
n
P
a
per
|
based on the unit mass resolution (UMR) tracer m/z’s that can provide a first-order
approximation of the PMF components (Aiken et al., 2009; Ng et al., 2011). The com-parison of PMF factors to the rapid estimation of AMS-PMF components from UMR
tracerm/z for the SPC data is shown in Fig. S10.
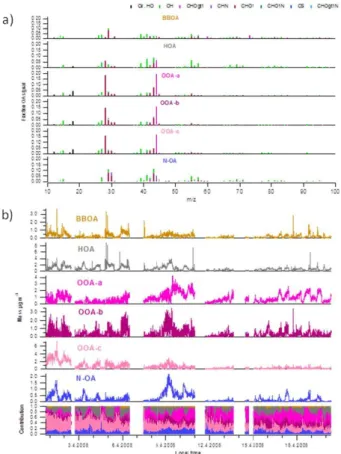
MS profiles and time series of the PMF factors are shown in Fig. 7. Largest
con-5
centrations were detected for OOA-a (26 %), HOA (24 %), and OOA-c (22 %; Fig. 8a). OOA-b constituted 13 % of OA whereas BBOA and N-OA composed 8 and 7 % of OA, respectively. HOA spectra was somewhat similar to that measured in Pittsburgh, Zurich and Mexico city (Zhang et al., 2005; Lanz et al., 2007; Aiken et al., 2009) with
the MS dominated by the ion series of CnH+2n−1 and CnH+2n+1, characteristics of OA
10
mass spectra from primary emission sources (Canagaratna et al., 2004; Mohr et al., 2009). Compared with a standard UMR mass spectra profile for HOA obtained from 15
urban data sets (Ng et al., 2011), HOA was more oxidized in this study (higherm/z 44
in Fig. S11).
HOA had a high H:C ratio and low O:C and OM:OC ratios being the least oxygenated
15
PMF factor (Fig. 8b). HOA had a clear diurnal trend with the highest concentration de-tected at 10:00 (Fig. 8c). After that the concentration decreased sharply likely caused by the break-up of the nocturnal inversion layer. The concentrations started to build up
again∼19:00. HOA didn’t have significant correlation with any of the AMS species but
it correlated strongly with EC analyzed from the PM1filters (Table S2). It also correlated
20
with WSOC and potassium (BLPI and PM1filters) as well as biomass burning tracers,
levoglucosan mannosan and galactosan (PM1 filters), suggesting that HOA probably
had some connection to BBOA. Of all the PMF factors, HOA had the strongest
correla-tions with gaseous NOx, NO and NO2. The correlation coefficients between HOA and
NOx/NO/NO2 were quite small but as almost all the details of the time trends of HOA
25
were captured by the variability of NOx, NO and NO2 (not shown), it seems that HOA
mostly originated from the fossil fuel combustion.
All three OOAs had quite similar mass spectra but as their time series and diurnal
ACPD
12, 8269–8318, 2012Characterization of submicrometer aerosol in Po Valley
S. Saarikoski et al.
Title Page
Abstract Introduction
Conclusions References
Tables Figures
◭ ◮
◭ ◮
Back Close
Full Screen / Esc
Printer-friendly Version Interactive Discussion
Discussion
P
a
per
|
Dis
cussion
P
a
per
|
Discussion
P
a
per
|
Discussio
n
P
a
per
|
combining them all to one OOA. In terms of MS all OOAs had the strongest signal
atm/z 27.995 (CO+) and 43.99 (CO+2) but the fraction of CO+2 was highest for
OOA-a OOA-and lowest for OOA-b. OOA-OOA-a hOOA-ad OOA-also more signOOA-al OOA-at 43.018 (C2H3O+) being overall
more oxidized factor than OOA-b and OOA-c (higher O:C and OM:OC ratios, Fig. 8b). Compared with the standard UMR mass spectra profiles from urban sites (Ng et al.,
5
2011) all OOAs had MS similar to LV-OOA (Fig. S11).
OOA-a was a clear regional component. It had only a small diurnal variation with slightly higher concentrations and mass contributions in the afternoon than in the morn-ing and in the evenmorn-ing (Fig. 8c). The concentrations of OOA-a were low in Period I be-cause in those days background air was very clean. Concentrations were high in Period
10
III when local sources (traffic, biomass burning) and a regional component coexisted.
OOA-a had high background concentrations in Period V and also enhancements dur-ing the mixdur-ing layer formation (Sect. 3.4). OOA-b had a lot of short-term variation but
on average, the concentrations of OOA-b were quite even at different periods. OOA-c
concentration clearly decreased over the course of the campaign. The highest
con-15
centrations for OOA-c were observed in the first two days of the campaign but after that the concentrations declined gradually. The diurnal trends for OOA-b and OOA-c indicated them to be mostly from local sources. OOA-b had the highest concentrations in the morning and during the night with a clear dip during the day. Similar to OOA-b,
OOA-c also had the largest concentration in the morning, but differently from OOA-b,
20
the concentration did not increase after sunset. Instead it started to rise after midnight. In terms of diurnal contributions, the contribution of OOA-c to OA was stable through-out the day whereas the contribution of OOA-b was lower in the afternoon than in the other times of the day.
As expected for a regional component, OOA-a correlated stronger with sulfate than
25
other OOAs (Table S2). OOA-a also correlated with MSA and chloride suggesting it to originate from sources in the Mediterranean basin rather than in continental Europe. Of all OOAs, OOA-a had clearly lowest correlation with the carbonaceous species WSOC,
ACPD
12, 8269–8318, 2012Characterization of submicrometer aerosol in Po Valley
S. Saarikoski et al.
Title Page
Abstract Introduction
Conclusions References
Tables Figures
◭ ◮
◭ ◮
Back Close
Full Screen / Esc
Printer-friendly Version Interactive Discussion
Discussion
P
a
per
|
Dis
cussion
P
a
per
|
Discussion
P
a
per
|
Discussio
n
P
a
per
|
acid that had different time trends from the other acids (Sect. 3.2.2). OOA-b correlated
strongest with the semivolatile inorganic compounds, nitrate and ammonium. OOA-c
had the highest correlation coefficients with WSOC, EC, OC, organic acids, except
maleic acid, and biomass burning components, levoglucosan, mannosan and galac-tosan and potassium.
5
BBOA had the strongest signals atm/z 29.003 (CHO+) 39.023 (C3H+3) and 41.039
(C3H+5; Fig. 7a). There was also a high signal at m/z 60.021 (C2H4O+2) and 73.029
(C3H5O+2) that are characteristic m/z’s for biomass combustion (Alfarra et al., 2007).
Compared to the UMR profile of BBOA from Ng et al. (2011), BBOA had lower signal
atm/z 43 and 44 (Fig. S11). Regarding biomass burning-relatedm/z’s, the fraction of
10
m/z60 was similar to that of Ng et al. (2011) whereasm/z 73 was higher at SPC. BBOA
had quite low OM:OC and O:C ratios (1.45 and 0.23, respectively) but slightly larger H:C ratio than OOAs (1.53; Fig. 8b). Compared to BBOA factor observed in Mexico (Allison et al., 2009), BBOA at SPC was slightly less oxygenated than in Mexico City (OM:OC and O:C ratios of 1.55 and 0.30 in Mexico City, respectively). Similarly to HOA
15
and OOA-b, the lowest BBOA concentrations were observed in the afternoon whereas
the highest concentrations were obtained during the late evening (∼23:00).
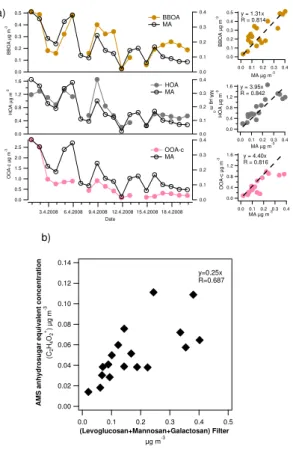
BBOA correlated with OC, WSOC and most of the organic acids, except maleic and azelaic acid. It also had a strong correlation with the biomass burning tracers, MAs (levoglucosan, mannosan and galactosan) and potassium. The relationship between
20
BBOA and the sum of MAs is shown in Fig. 9a. On average, levoglucosan was present
at ∼61 % of BBOA which was a much higher percentage than obtained previously
for ambient aerosol (e.g. 6.1 % in Mexico city; Aiken et al., 2009) or typically found in biomass burning emissions (Schmidl et al., 2008). As already mentioned, levoglucosan
also correlated with HOA (R =0.837) and OOA-c (R =0.820). OOA-c was likely to
25
ACPD
12, 8269–8318, 2012Characterization of submicrometer aerosol in Po Valley
S. Saarikoski et al.
Title Page
Abstract Introduction
Conclusions References
Tables Figures
◭ ◮
◭ ◮
Back Close
Full Screen / Esc
Printer-friendly Version Interactive Discussion
Discussion
P
a
per
|
Dis
cussion
P
a
per
|
Discussion
P
a
per
|
Discussio
n
P
a
per
|
boundary layer and therefore alike diurnal trends. Regarding the correlations between levoglucosan and PMF factors, it should be noted here that the sampling time for the
PM1 filters was 24 h meaning that all the details of the levoglucosan concentrations
were lost in the filter sampling. Besides similar sources or atmospheric processing,
correlations between levoglucosan and PMF factors may also indicate the difference
5
between the air masses or meteorological conditions.
The concentration of anhydrosugars (sum of levoglucosan, mannosan and
galac-tosan) was constructed from the AMS data by using only C2H4O+2 (m/z 60.021; Lee
et al., 2010). It was assumed that C2H4O+2 was present at 0.3 % of OA without biomass
burning influence (Aiken et al., 2009), and therefore that fraction was subtracted from
10
the concentration of C2H4O+2. In the study of Aiken et al. (2009) they measured that
C2H4O+2 comprised 14.1, 13.8 and 12.1 % of the total ion fragment pattern for
lev-oglucosan, mannosan and galactosan, respectively. These ratios were used together
with the ratios of levoglucosan, mannosan and galactosan obtained from the PM1filter
samples to reconstruct anhydrosugar concentration from the AMS data. On average
15
AMS anhydrosugars contributed 25 % of the anhydrosugars determined from the filter samples (Fig. 9b). They had somewhat correlation, but especially for the large concen-trations, the deviation between two measurements was notable. Lower AMS anhydro-sugars than anhydroanhydro-sugars analyzed from the filters was in contrast to the study of Lee
et al. (2010) in which they found that C2H4O+2 signal was clearly higher than can be
ex-20
plained by the three anhydrosugars in the laboratory studies indicating that there were other structurally similar molecules that produce C2H4O+2. It’s very difficult to try to
ex-plain the lack of C2H4O+2 in our study since standard anhydrosugar compounds haven’t
been analyzed with the instrument. However, this discrepancy raises a question about the similarity of AMS instruments and the need of instrument intercomparisons.
25
The sixth factor was identified as nitrogen-containing OA based on its mass spectra.
In N-OA MS the highest signal was atm/z 29.003 (CHO+), 41.039 (C3H+5) and 43.018
(C2H3O+) but the highest nitrogen-containing fragments were at m/z 27.011 (CHN+),