73
Assessment of aquifer intrinsic vulnerability using GIS based Drastic model
in Sialkot area, Pakistan
Muhammad Saqib Khan1, Anwar Qadir2, Asif Javed1*, Khalid Mahmood3, Muhammad Raiees
Amjad1, Salim Shehzad1
1Department of Earth and Environmental Sciences, Bahria University, Sector E-8, Shangrilla Road, Islamabad, Pakistan.
2Department of Geology, University of Haripur, Khyber Pakhtunkwa, Pakistan. 3Demartment of Space Sciences, University of Punjab, Lahore, Punjab, Pakistan
.
*Email: [email protected]
Received:19 February, 2016 Revised: 19 May, 2016
Abstract: The intrinsic vulnerability of a shallow aquifer of Sialkot is assessed using DRASTIC index method. The information required as input for all seven parameters, i.e. depth to water table, net recharge, aquifer media, soil media, topography, the impact of vadose zone and hydraulic conductivity data were collected from literature surveys and on field surveys. A cumulative vulnerability map was developed using the indices obtained as a result of DRASTIC methodology. The values obtained from DRASTIC model for the study area were between 112 and 151. The area was dominated by medium and moderate vulnerable zones covering an area of 446 km2 and 442 km2 respectively. An area of 79 km2 was covered by the low vulnerable zone while the high vulnerable zone encompassed a total area of 38 km2. Least covered area i-e., 09 km2 was found in the vicinity of the very high vulnerable zone. The validation of the DRASTIC model using the nitrate distribution revealed that very high and high indices have the lower percentage of reliability than of the low to moderate zones as compared with the nitrate distribution in the groundwater.
Keywords: Groundwater, vulnerability assessment; DRASTIC model, GIS.
Introduction
In Pakistan, groundwater is regarded as a reliable source which is not only used for agricultural activities and drinking purpose but the industrial sector is also believed to be a major groundwater consumer (Bhutta and Alam, 2005).The groundwater of industrial cities like Lahore, Gujranwala and Sialkot, is under threat of contamination because of large amount of polluted untreated effluent discharge from a wide variety of industrial units like tanneries, sports and leather, pharmaceutical, garments, paper, chemicals, textile and agricultural activities etc. These cities are totally dependent on groundwater for drinking (Mahmood et al., 2011).
Though groundwater is not easily contaminated yet once this occurs, it is difficult to remediate. The replacement cost of a failing local aquifer is generally high and its loss may stress other water resources. Further, in the developing world, such remediation may prove practically impossible, thus it is important to identify which aquifer system and settings are most vulnerable to degradation (Kaur and Rosi, 2007). Moreover, the reversible and imperceptible nature of ground water contamination, its costly and time consuming remediation techniques and difficulty with accessibility to the contaminated subsurface water resources may limit efforts to improve the ground water condition (Causapé et al., 2006). Hence, the only possible option is the identification of the most
susceptible areas that are vulnerable to groundwater pollution and to take some initiatives to conserve the groundwater resource and this can be achieved through several aquifer vulnerability assessment models and methods. The term “Vulnerability” was introduced in late 1960’s France by Margat, (1968) and Chilton (2006).
Many approaches have been developed to evaluate aquifer vulnerability, including, process based methods, statistical methods and overlays and index methods. Overlay-Index methods are the third and most commonly exercising methods in groundwater vulnerability assessment (Dixon, 2004). Overlay methods use a range of key contributing attribute and map of each attribute is developed individually. These maps are then superposed on one another to give a final map as a key product, presenting areas with varying vulnerabilities. However, in index methods, the most relevant factors affecting the groundwater vulnerability are selected, and are given a particular score or rank to the different ranges lying within the particular factor along with a weight, assigned to relevant factor according to its importance, in order to produce an index, known as “Vulnerability Index”. Various methods have been put forward by different organizations, scientists and public and private sectors. These include DRASTIC (Aller et al., 1987), GOD (Foster, 1987), EPIK (Doerfliger et al., 1999) and SINTACS (Civita 1993).
ISSN: 2223-957X www.econ-environ-geol.org
Drastic has been applied in various parts of the world for a variety of assessments ranging from a vulnerability assessment of a city to a complete basin. Samake et al. (2011) used DRASTIC model for the assessment of groundwater intrinsic vulnerability of shallow aquifer in Linfen basin. In central Japan, the groundwater aquifer of Kakamigahara heights was assessed for its vulnerability using DRASTIC model along with GIS as a tool (Babiker et al., 2005). DRASTIC Index was calculated by combining several thematic layers.
The presence of nitrate in the groundwater is the result of various anthropogenic activities (Javadi et al., 2010; 2011). Various researchers integrated the nitrate concentrations with DRASTIC (Carvalho, 2009; Panagopoulos et al., 2006; Javadi et al., 2010; Javadi et al., 2011; Pacheco and Sanches Fernandes, 2012). In the current study, the rate of DRASTIC parameters was validated for the study area by measuring the nitrate concentration of groundwater and then measuring the difference of the covered area of both.
This study focuses on the groundwater vulnerability in an industrialized town of Sialkot and its surroundings. A model has been developed that will serve the purpose for the assessment of various causes of the vulnerability in the shallow aquifer of the Sialkot area. The model thus prepared has been validated with the help of the nitrate concentration distribution. In fact the groundwater vulnerability assessment with DRASTIC will be the first of its kind to be implemented in Pakistan. Similar technique can be implemented in various other industrialized towns of Pakistan to take measures against the deteriorating quality of groundwater.
Material and Methods
Study area description
Due to vulnerable nature of the groundwater aquifer system of Sialkot i.e. Shallow aquifers and keeping in consideration, the increasing trend of industrial and agricultural activities, Sialkot area has been selected as the study area (Fig. 1). Lying in the upper Rechna Doab, Sialkot has a good shallow groundwater aquifer, which is recharged by the river Chenab in the northeast and River Tawi tributaries running through the city. Sialkot is a subdivision (Tehsil) of Sialkot District, located at the foot of Kashmir hills, near Chenab River, in the northeast of Punjab province. Sialkot area is bounded on the northeast by the Jammu and Kashmir state, on the north-west by rivers of Ravi and Chenab, which separate it from the Gujrat District, on the west and southeast by Gujranwala and Narowal District respectively. The study area of Sialkot lies between latitude 32°22' 30'' and 32°52' 30'' and longitude 74°15' 00'' and 74°41' 15'' with an elevation of about 840 feet above the mean sea level. Sialkot lies in an area with quite significant seasonal variations in temperature as well as precipitation. The average monthly temperature varies from 11.6°C in January to 32.2°C in the month of June. The average temperature over the coldest three months of the year is of about 12.7 °C lower than Lahore (Urban Unit 11). Monsoon season is the source of precipitation in the area except the occasional rainfall. Mean annual rainfall is 957mm, over half of which falls in the summer monsoon months of July and August which often results in flooding.
The area lies in Punjab plain which constitutes the most prominent and extensive physiographic divisions
75
of the Indian subcontinent. The study area is underlain by Pleistocene deposits to a depth of several thousand meters. The first 200 meters of these deposits consists of approximately 70% silty sand interspersed with limited clay layers (Rehman, 1997). The area under consideration is the upper part of Rechna doab that covers an area of approximately 2.97 million hectare (Ahmed et al, 2005). This area is characterized by the existence of heterogeneous alluvial complex that has been raised as a result of a variety of erosional and depositional processes, associated with constantly shifting courses of rivers. This alluvial complex is responsible for the formation of groundwater reservoirs in the area. The alluvial complex predominantly consists of fine to medium-grained sand, silt and clay. In some areas, kankar, impure calcium carbonate concretions of secondary origin, are found in association with fine-grained sediments. A major river, Chenab flows to the northwest of Sialkot area and the Marala-Ravi link canals flow to the west. There are also numbers of seasonal streams flowing in this region. Sialkot is famous for its industrial activities and is known as one of the Industrial hubs in Pakistan. The nature of industrial activities ranges from homemade small industries to large, mega industrial units. According to the Punjab development statistics (2008), the estimated population of Sialkot district was 3,303 thousand people (Ali, 2008).Keeping in consideration the problem of the study area, i-e., groundwater pollution, DRASTIC method is adopted for the assessment of groundwater vulnerability developed by the National Water Well Association (NWWA) and United State Environmental Protection Society (EPA) in 1987 (Aller et al., 1987). The name DRASTIC defines the seven parameters used in this method including Depth to water table (D), Net recharge (R), Aquifer media (A), Soil media (S), Topography (T), Impact of Vadose zone (I) and Hydraulic conductivity (C). A particular weight has been assigned to each parameter according to its importance and relative significance and role in contaminant transportation to subsurface water resource (Babiker et al., 2005). These weights were
developed using Delphi (Consensus) technique, in which comments and thoughts from various experts and professionals were taken on the bases of their experience and expertise (Aller et al., 1987). Every parameter or hydrogeological factor is categorized into different media classes or type known as Ranges. These ranges are defined to facilitate the vulnerability assessment process for areas with varying lithology and hydrogeological characteristics. Ratings are assigned varying from 1 to 10. Using the weights, ranges and ratings assigned to the parameters and their media types, the DRASTIC Index (DI) can be calculated by the following simple linear equation.
Drastic Index (DI) = Dr.Dw + Rr.Rw + Ar.Aw + Sr.Sw + Tr.Tw + Ir.Iw + Cr.Cw(1)
Where ‘r’ and ‘w’ represents the ratings and weights assigned to each parameter respectively. The calculated DRASTIC index will represent relative vulnerability of the groundwater towards any contamination. Higher the vulnerability index, the greater will be the susceptibility likelihood of the aquifer toward pollution while the index with low numbers will be a representation of comparatively low vulnerability. It should be noted that, if the vulnerability index of some area is less, it does not mean that there is no any probability of groundwater pollution and the area can’t be considered as vulnerability free zone. But the low index is a representation of the fact that the area is in the zone having comparatively low vulnerability towards the contamination (Almasri, 2008).
Different types of data, for various parameters were collected from different government, semi government and private organizations. Detailed field surveys were carried to collect some data and also to verify some data collected from secondary sources, i.e. depth to water table and the coordinates of wells. The nature of data for specific types of hydrogeological parameter along with the data source is given in the Table 1. GIS was used as a tool to visualize the spatial distribution of vulnerability index. Microsoft Excel was used to arrange all the collected data in a tabulated Table 1. Type and Nature of Data collected from various organizations
Number Layer Data form Source/Organization
1 Depth to water table Field data, MS Excel file, Documents (PDF)
Field data IWASRI
PHED WASA
2 Recharge Document (PDF)
Land use pattern (shape file) Literature
3 Aquifer media Well log WASA
PHED Cantonment Board
4 Soil media Map Soil survey of Pakistan
5 Topography DEM MODIS
6 Vadose zone Well log WASA
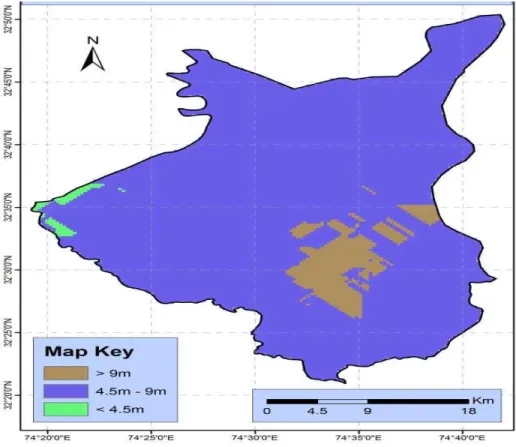
form. Various interpolation techniques were used to get the spatially distributed information about each parameter. Ranges were defined for the various depths and were ranked accordingly (Table 2). The final thematic map (Fig. 2) was prepared using Ordinary kriging because of its least root mean square error values. In interpolation of Depth to water table (D)
data, Log transformation was used for the uniform distribution of numeric values.
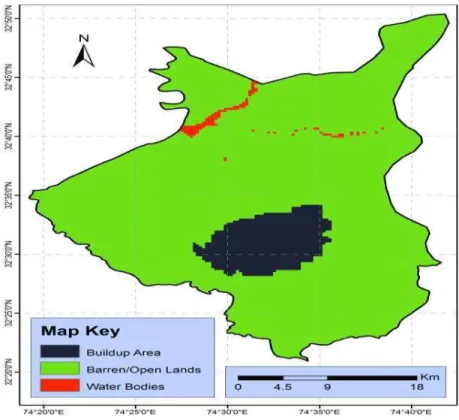
Net recharge represents the total amount of water coming from precipitation source or some artificial source in the area and infiltrating to the subsurface water resources. Land use classification method (Table Fig. 2 Spatial distribution of the groundwater table depth in the study area.
Table 2 Ranges/Ratings for DRASTIC Model.
Depth to Water table
(m) Net Recharge Aquifer media Soil media Topography (slope)
Impact of
Vadose zone conductivity Hydraulic
Ran ges R ati ng s Lan d use cl as se s Ran ge s ( in ) R ati ng s Aqu ifer
media Rati
ng s So il media R ati ng s Rang es (%) R ati ng s Ran ge s R ati ng s Rang e (GPD/m 2) R ati ng s
<4.5 9 Build-up <3 1 Fine to medium
sand
5 Clay
loam 3 <2 10 Hard clay 5 215-430 4
4.5-9 7 Barren lands/ope
n plots with vegetation
3-4 3 Sand and kankar 5 loamSilt 4 2-6 9 kankarClay- 6 431-645 6
9> 5 Water bodies/we
t lands
>4 8 Coarse
sand 8 Loam 5 6-12 5 Fine sand 6 646-861 8
12-18 3 Surface clay 8
18+ 1 Medium
77
2) was used for the estimating the net recharge of the area. The land use pattern was obtained from the World Wide Fund for nature (WWF). The average net recharge values for different classes were taken fromRahman (2008) work on vulnerability assessment of Aligarh in which for diverse classes, net recharge was calculated by using the following equation.
Fig. 3 Spatial distribution of the recharge assessment on the basis of the land use.
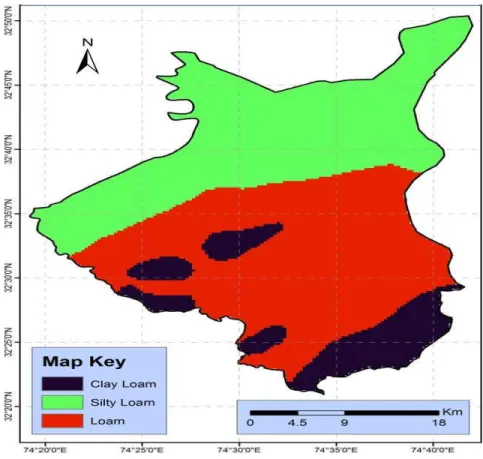
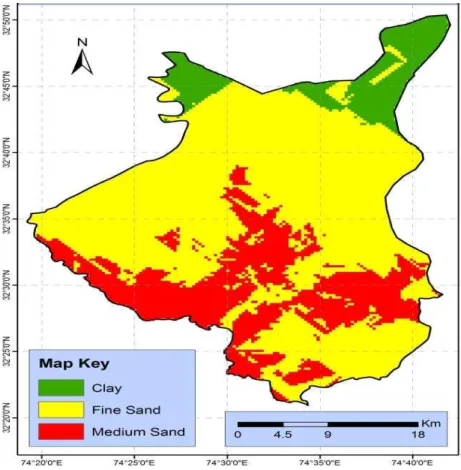
Fig. 5 Various types of soils found in the Sialkot area.
79
Net recharge = (Rainfall-Evaporation) × Recharge rate (2)The final map for net recharge (Fig. 3) was developed using net recharge values, calculated on the basis of land use pattern.
Well log data was obtained from Water and Sanitation Authority (WASA), Public Health and Engineering Department (PHED) and Cantonment board, Sialkot. Field surveys were done using the GPS to identify the exact location of the well. Using the well log data along with the depth to water table, it was easy to locate the exact aquifer media of the respective well. Ranges and ratings were defined (Table 2) using the available data and map showing spatially distributed aquifer media type was developed using ordinary kriging (Figs. 4 , 7).
In preparing the soil media layer the soil map of Punjab province, of scale 1:1,000,000, was obtained from Soil Survey of Pakistan, Lahore. With the help of legends given on the map, different classes of soil media were identified and rankings were assigned to each defined class (Table 2). On the basis of classes, final map for soil media was originated (Fig. 5).
To find out the slope of the area, digital elevation model (DEM) with a resolution of 30 meters was used. The DEM was obtained from Moderate Resolution Imaging Spectro-radiometer (MODIS) website.
Classes of various ranges were developed followed by assigning ratings to those classes (Table 2). Final thematic map of parameter was developed using GIS tool (Fig. 6).
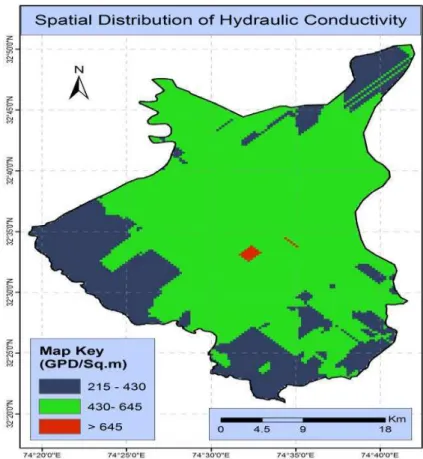
Hydraulic conductivity of different wells was attained from Annual reports, well log statistics and official records of Public Health Engineering Department (PHED). The data were converted into a uniform unit after a range of conversions and was then arranged in the form of MS Excel files. Spatially distributed ranges were identified and were ranked according to their significance (Table 2).
After assignment of weights and rankings (Table 2) to the layers and their attributes, according to their significance, the layers were overlaid in a GIS environment. The weights of each layer were multiplied with ranks assigned to various ranges to calculate the factor ‘Pw.Pr’ where ‘Pw’ is the weight assigned to a particular parameter while ‘Pr’ is the rating of attribute. This weight/range factor was calculated for each layer and then was added to give an index known as DRASTIC Index. The index was derived on the basis of equation 1. The final DRASTIC Index map is shown in Fig.9.
Following this the model has been validated using the PHED data of the nitrate distribution in the groundwater for 2010 (Fig.10, Table 4).
Fig. 8 Spatial distribution of aquifer materials in the Sialkot area.
81
Fig. 10 Nitrate concentration in the shallow groundwater of the Sialkot area.
Table 3: DRASTIC Index ranges, classes, area occupied and colors assigned
DRASTIC Ranges and Zoning
Zone Range Area covered
(Km2) Color code
Low 112-119 79 Dark green
Medium 120-127 446 Light green
Moderate 128-135 442 Yellow
High 136-143 38 Orange
Very High 144-151 09 Red
Table 4 Validation of DRASTIC Indices covered areas using nitrate concentrations covered areas
Zones Nitrate coverage km2
DRASTIC vulnerability Coverage
km2
Difference in coverage
km2
Difference percentage
Very High 76.6 9 67.6 89
High 62.1 38 24.1 49
Moderate 561.8 442 122.8 22
Results and Discussion
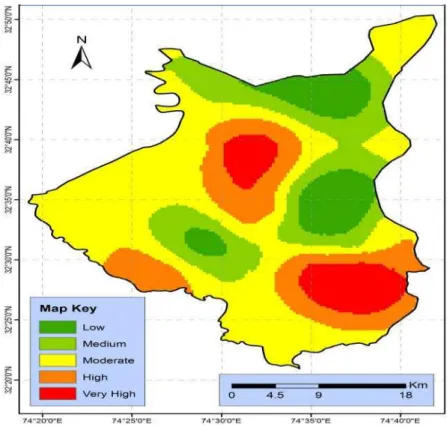
The values obtained from DRASTIC model for the study area were between 112 and 151 (Table 3). The DRASTIC indices represent a degree of vulnerability. The higher the index, higher would be the susceptibility of aquifer towards contamination and lower index, lower would be the likelihood of contamination. In order to delineate different areas for their varying vulnerability, the DRASTIC scores were further classified into 5 categories, i.e. Low, Medium, Moderate, High, Very high. Hence the area under consideration was divided into five zones (Fig.9, Table 3).
Because of the diverse nature of activities in the study area, i.e. industrial, agricultural, domestic etc, the area was categorized into five zones. The reason behind the area of classification in five zones was to facilitate different sectors, government and private organizations in the decision making process regarding land use activities.
It is clear from the Fig.8 that a large area is dominated by Medium and Moderate vulnerable zones followed by Low, High and Very high respectively. The Low vulnerability zone that covers an area of about 79 km2 is distributed in two main parts. A portion of region with least groundwater vulnerability lies in the heart of the city. Several factors are involved in the lower susceptibility of groundwater in this area. The major factor is the deeper water table in this zone that is more than 9 m and ranked least in the DRASTIC index calculation. Comparatively deeper aquifer in this area has made the zone less vulnerable towards surface contamination. The second main reason that has made this zone less vulnerable is ‘zone of no recharge’ or ‘zone of less recharge’ since this area is totally built up region and there is less probability of downward percolation of contaminants because of infiltration. Further, the presence of loam as a top soil material has made the zone least vulnerable as the loam has a lower ranking because of its good contaminants attenuation capability. The presence of fine sand in vadose zone has also played a key role in decreasing vulnerability of this area. The second least vulnerable zone covers the extreme northern part of Sialkot that lies with the boundary of Occupied Jammu and Kashmir. The main factor in this area is the hydraulic conductivity of this section lies in the lowest range i.e. 213-415GPD/m2. The second main aspect is the presence of hard clay along with some kankar in this area. Hard clay has least ranking of 5 in the DRASTIC index. The existence of silty loam is also a major feature for delineating the area as low vulnerable zone (Aller et al, 1987).
The Medium Vulnerable zone, covering the largest area of 446 km2, is scattered throughout the study area. A large portion of this zone is in the north of the city and some parts of this vulnerable zone lies in the west, southwest and south of city Sialkot. Some part of this
zone covers the area of Sialkot city and its surroundings. In the north, the zone covers the area of two main water bodies, i.e. Tawi River and river Chenab flows. The important thing is the existence of reserved forest. Along with the higher net recharge, shallow water table and sand and kankar as the aquifer media have made this zone more vulnerable. However the conditions like presence of clay and fine sand in the vadose zone, silty loam as soil media and moderately higher slope (2%-6%) has made a mark on vulnerability values. The other portion of this zone lies in the west of this zone. The major part of this region is barren or open land with vegetation due to which a higher net recharge is found here that has made this zone vulnerable. The topography of this area is very plain and slope is less than 2%. Moreover the shallow water table has also played a key role in considering this area as a medium vulnerable zone. However, other conditions like lower hydraulic conductivity values, silty loam as soil media and fine sand as vadose zone has resulted in the formation of some natural barriers against the contaminants and pollutants (Kaur and Rosin, 2007). The area lying near the Sialkot-Pasrur boundary is also covered by the same zone. The two main factors involved in categorizing this area as medium vulnerable zone are medium sand as vadose zone and loam as soil material. Medium sand and loamy soils, through a combined effect, have made this zone vulnerable because of their less potential to attenuate and capture pollutants. The shallower water table is also an important factor in this aspect. However, the very low net recharge, because of less net recharge (built up area), moderate hydraulic conductivity and lower slope (less than 2%) is the area has still some natural barriers for contamination (Smake et al, 2011).
83
purification process. However the shallow groundwater table and moderate hydraulic conductivity are factors in this zone striving to form some degree of natural barriers for groundwater protection (Aller et al, 1987).High vulnerable zone is of critical importance because of its high vulnerability index lying in the range, i.e. 136-143 and covers a total area of 38 km2. The extraordinary aspect that has made these areas vulnerable enough to consider them in the High vulnerable zone is the existence of coarse sand as aquifer media. Coarse sand has a high ranking of ‘8’ while the weight assigned to aquifer media is also ‘3’. The conditions have been made worst by loamy soil, surface clay and medium sand as vadose zone media, moderate recharge, shallow water table and low slope (Aller et al, 1987).
The very high vulnerable zone is encompassing least area of 09km2 and includes the region of water bodies. The very obvious reason for the high vulnerability of this zone is higher net recharge. Other factors include in triggering the vulnerability are silty loam (soil media), fine sand (vadose zone media), low slope, shallow water table and shallow water table (Aller et al, 1987).
To validate the model the vulnerability map has been compared with the nitrate distribution in the shallow groundwater (Fig.10 and Table 4). Nitrate concentration has been used in many of the previous studies such as Rahman (2008) and Neshat et al. (2013). The nitrate concentration in this area is less than that of 50 mg/l threshold of World Health Organization (WHO) for drinking water. The values of nitrate range between 0.1 to 10 mg/l. The whole range has been classified into five classes. It has been found that approximately 70 percent of the DRASTIC method has clearly depicted the shallow groundwater situation in the area. The most problematic areas of vulnerability that DRASTIC has not covered include that of the very high and high zones. The low to moderate zone correspond very good that is around 60 to 78 percent in covered areas. So in this study it can be confirmed that the low to moderate zones of vulnerability can be easily determined by this method. The very high and high zones are not so coherent for the reason of the groundwater vagile nature. The comparison revealed the coherence of areal coverage of various zones in both the maps. This confirms that DRASTIC is a very useful method for the delineation of groundwater vulnerable zones for the environmental management and planning but after the validation in the respective areas (Neshat et al, 2014).
Conclusions
On the basis of DRASTIC method, applied to assess to the vulnerability of the area using Overlay and index system, vulnerability map was developed. The DRASTIC index, ranging from 112 to 151, was
divided into five classes. It was found that the Low vulnerable zone (DI 112-119) covered an area of about 70 km2. Highest area was covered by medium vulnerable zone (DI 120-127) with the total occupied area of 446 km2 followed by moderate vulnerable (DI 128-135) zone encompassing a total area of 442 km2.An area with high vulnerability (DI 136-143) was comparatively smaller and a total of 38km2was covered by this zone. This zone was found critically important because of presence of weak natural barriers against contamination. The validation of the model using the nitrate distribution revealed the fact that there are large percentages of invalidity in the very high to high zones of DI. However, the DI validation at the low to moderate levels resulted in a good coherence. A cautious usage is suggested after a proper verification and validation in other areas of usage. A very valuable decision making tool has been produced by this study that can help all those authorities, organizations and persons involved in the decision making process regarding environmental management, water resource conservation and environmental monitoring.
Acknowledgements
The authors acknowledge the Public Health Engineering Department (PHED), Water and Sanitation Authority (WASA) and Soil Survey Department of Pakistan for the provision of guidelines in the form of various reports.
References
Aller, L.; Bennet, T.; Lehr, J. H.; Petty, R. J; Hackett, G. (1987) .DRASTIC: A standardized system for evaluating ground water pollution potential using hydrogeologic settings. National Water Well Association, Dublin, Ohio and Environmental Protection Agency, Ada, OK. EPA-600/2-87-035.
Almasri, Md. N. (2008). Assessment of intrinsic vulnerability to contamination for Ghaza coastal aquifer, Palestine. J. of Environmental Management
88, 577-593.
Babiker, I.S.; Himaya,T.; Kato, K.; Mohamed, A.A. (2005). A GIS-based DRASTIC model for assessing aquifer vulnerability in Kakamigahara Heights, Gifu Prefecture, central Japan. Science of Total Environment345, 127-140.
Bhutta, M.N.; Alam, M.M. (2005). Prospective and limit of groundwater use in Pakistan. International Water logging and Salinity Research institute, Lahore, Pakistan.
Causape, J.; Quilez, D.; Aragues, R. (2006) .Groundwater quality in CR-V irrigation district (Bardenas I, Spain): alternative scenarios to reduce off-site salt nitrate contamination. Agriculture water management.
Chilton, J. (2006). Assessment of aquifer pollution vulnerability and susceptibility to the impacts of abstraction. In Schmoll, O., Howard, G., Chilton, J., and Chorus, I. (eds), World Health Organization.
Protecting Groundwater for Health: Managing the Quality of Drinking-water Sources. IWA Publishing, London, UK.
Civita, M. (1993).Groundwater vulnerability maps, a review. Proc. of the IX symposium on pesticide chemistry “mobility and degradation of xenobiotics.
Piacenza, 587-631.
Dixon, B. (2004). Prediction of groundwater vulnerability using integrated GIS-based neuro-fuzzy techniques. J. Hydrol.4, 17–38
Doerfliger, N.; Jeanin, P.Y.; Wahlen, F.Z. (1999).Water vulnerability assessment in karst environments: A new method for structurally-controlled aquifer. J. of Hydrogeology, 13, 165-176.
Foster, S. S. D. (1987). Fundamental concepts in aquifer vulnerability pollution risk and protection strategy. In Vulnerability of soil and groundwater to pollutants: Proceedings and information. W.van Duijvenbooden and H.G. van Waegeningh (eds).
TNO Committee on Hydrological Research, The Hague. 69–86.
Javadi, S.; Kavehkar, N.; Mohammadi, K.; Khodadi, A.; Kahawita, K. (2011b). Calibration DRASTIC using field measurements, sensitivity analysis and statistical method to assess groundwater vulnerability. Water International;36, 719–732
Javadi, S.; Kavehkar, N.; Mousavizadeh, M. H.; Mohammadi, K. (2011a). Modification of DRASTIC model to map groundwater vulnerability to pollution using nitrate measurements in agricultural areas. J. Agr. Sci. Tech.;13, 239–249
Kaur, R.; Rosin, K.G. (2007).Groundwater vulnerability assessment-Challenges and opportunities. Division of Environmental Sciences, Indian Agricultural Research Institute, New Dehli, India.
Mahmood, A.; Muqbool, W.; Mumtaz, W.M.; Ahmad, F. (2011).Application of Multivariate Statistical Techniques for the Characterization of Groundwater Quality of Lahore, Gujranwala and Sialkot (Pakistan). Pakistan Journal of Analytical Environmental Chemistry, 12, 102-112.
Margat, J. (1968).Vulnerabilite des mappes d’eau souterraine a la pollution, Orleans: BRGM Publications.
Neshat AR.; Pradhan B.; Pirasteh S.; Shafri HZM. (2013). Estimating groundwater vulnerability to pollution using a modified DRASTIC model in the Kerman agricultural area, Iran, 6, 1–13
Neshat A. R.; Pradhan B.; Dadras M. (2014). Groundwater vulnerability assessment using an improved DRASTIC method in GIS. Resources,
Conservation and Recycling; 86, 74–86
Pacheco, F. A. L.; Sanches Fernandes, L. F. (2012). The multivariate structure of DRASTIC model. J of Hydrology; 476, 442–459.
Panagopoulos, G. P.; Antonakos, A. K.; Lambrakis, N. J. (2006). Optimization of the DRASTIC method for groundwater vulnerability assessment via the use of simple statistical methods and GIS, ,14, 894– 911
Ali, S. (2008). Punjab Development statistics report. Bureau of Statistics, Government of Punjab, Pakistan, pp 276.
Rahman, A. (2008). A GIS based DRASTIC model for assessing groundwater vulnerability in shallow aquifer in Aligarh, India. Applied Geography; 28, 32-53.
Rehman, A. (1997). Salinity management alternatives in the Rechna Doab, Punjab, Pakistan. Research Report No. 21.8. Lahore, Pakistan: International Water Management Institute.