Revista Brasileira de
Engenharia Agrícola e Ambiental
Campina Grande, PB, UAEA/UFCG – http://www.agriambi.com.br
v.22, n.2, p.77-82, 2018
Surface drainage in leveled land: Implication of slope
Antoniony S. Winkler
1, Jaqueline T. da Silva
1, José M. B. Parfitt
2,
Claudia F. A. Teixeira-Gandra
3, Germani Conceço
2& Luis C. Timm
3 DOI: http://dx.doi.org/10.1590/1807-1929/agriambi.v22n2p77-82A B S T R A C T
In the lowlands of Rio Grande do Sul, land leveling is mostly carried out with no slope for the purpose of rice production. In this environment, soils with a low hydraulic conductivity are predominant owing to the presence of a practically impermeable B-horizon near the surface. Land leveling leads to soil accommodation resulting in the formation of depressions where water accumulates after heavy rainfalls, subsequently leading to problems with crops implanted in succession to rice, such as soybeans. The objective of this research was to quantify the areas and volumes of water accumulation in soil as a function of the slope of land leveling. Five typical leveled lowland areas were studied as a part of this research. The original areas presented slopes of 0, 0.20, 0.25, 0.28 and 0.40%, which were used to generate new digital elevation models with slopes between 0 and 0.5%. These newly generated digital models were used to map the depressions with surface water storage. In conclusion, land leveling with slopes higher than 0.1% is recommended to minimize problems with superficial water storage in rice fields.
Drenagem superficial em área sistematizada:
Implicação da declividade
R E S U M O
Nas terras baixas do Rio Grande do Sul, a sistematização é realizada, na maioria das vezes, sem declividade com o objetivo de cultivar arroz. Neste ambiente, são predominantes solos com baixa condutividade hidráulica devido à presença de um horizonte B, praticamente impermeável, perto da superfície. Depois da sistematização, por causa da acomodação do solo são formadas depressões onde se acumula água após a ocorrência de fortes chuvas, causando problemas nas culturas implantadas em sucessão ao arroz, como é o caso da soja. Objetivou-se neste trabalho quantificar áreas e volumes de acumulação de água, em função da declividade da sistematização. Foram estudadas cinco áreas sistematizadas típicas de terras baixas. As áreas originais apresentaram declividades de 0, 0,20, 0,25, 0,28 e 0,40%, sendo que a partir delas foram gerados os novos modelos digitais de elevação com declividades entre 0 e 0,5%. Através dos novos modelos gerados foram mapeadas as depressões com armazenamento superficial de água. A sistematização com declividades maiores que 0,1% são recomendadas para minimizar problemas com armazenamento superficial de água em áreas cultivadas com arroz.
Key words: lowlands surface drainage water accumulation digital elevation models
Palavras-chave: terras baixas drenagem superficial acumulação de água modelo digital de elevação
1 Universidade Federal de Pelotas/Programa de Pós-Graduação em Manejo e Conservação do Solo e da Água. Pelotas, RS. E-mail: [email protected];
[email protected] (Correponding author)
2 Embrapa Clima Temperado/Estação Experimental Terras Baixas. Pelotas, RS. E-mail: [email protected]; [email protected] 3 Universidade Federal de Pelotas/Departamento de Engenharia Rural. Pelotas, RS. E-mail: [email protected]; [email protected]
Introduction
The ecosystem of lowland in the Brazilian state of Rio Grande do Sul occupies an area of approximately 5.4 million hectares (Pinto et al., 2004). Although in recent years there has been an increase in the plantation area of soybeans and corn in this region (IRGA, 2014); the predominant production system consists of rice monocropping associated to extensive livestock when rice is absent. The main vulnerability for a good performance of these crops in the lowlands, in rotation with rice, is the poor natural drainage of these soils (Pinto et al., 2004) owing to the use of horizontal drainage systems. As vertical drainage systems are usually more expensive (Valipour, 2012, 2013), anisotropic drainage systems seem to be the key for sustainable drainage systems in the agricultural areas (Viero & Valipour, 2017), as explored in the present study of the lowlands.
The usage of agricultural techniques that improve surface drainage, such as land leveling, would allow the implementation of a more intensive production system than the one currently utilized (Amer, 2011; Aquino et al., 2015). Land leveling is the process of adaptation of the natural surface of the ground in order to transform it into a plane or a surface-smoothed curve.
Currently, the leveled areas for paddy rice grown by continuous flooding are built mostly with no slope. However, to provide crop rotation and diversification, land leveling that provides suitable grades for both rice and furrow irrigation is highly desirable (González et al., 2011).
Although, several studies (Hansen et al., 1999; Kamphorst et al., 2000; Borselli & Torri, 2010) have successfully established a relationship between the roughness of the soil surface, the land slope, and the water storage in localized depressions in the area; these studies were conducted at very small scales and were not in an agricultural context. This research constitutes as the first paper that focuses on how slopes influence the drainage of rice fields in South America.
The study aims to determine the effect of the land slope on soil surface drainage for soils with low water infiltration rates, quantified by the percentage of the area with storage (micro-depressions) and the volume of surface water in land leveled areas.
Material and Methods
To achieve the proposed objective, five land leveled areas of approximately 2 ha each located at the “Terras Baixas” Experimental Station of Embrapa Clima Temperado, in Capão do Leão, Rio Grande do Sul state (RS), Brazil, whose geographic coordinates are 31º 48' 49'' S; 52° 28' 02'' W, with an altitude of 16 m a.s.l. were utilized. The soils of the experimental areas are classified as Planossolos and Gleissolos in the Brazilian official soil classification system (EMBRAPA, 2006), corresponding to Typic Albaqualf and Umbric Epiaqualf in the North American Classification (Soil Survey Staff - USA, 1999), and both the soils are further classified as loamy texture. The lower parts of the Gleissolos and the higher parts of the Planossolos were used for this experiment. The two soils are characterized by presenting the thickness of the horizons A + E of approximately 40 cm, seated on a practically impermeable B-horizon, which
corresponds to the problems of surface water storage in localized spots in the field after the rains. The areas were leveled in January 2013 by the use of a scraper equipped with laser beam level control. In January 2014 a survey was conducted to describe terrain irregularities in all areas using a precision level (NI 050 Zeiss) with a regular grid of 4 x 4 m.
The GIS data were processed in two steps. In the first step, a geostatistical analysis was performed using the GS+ software version 9.0. The software calculated the experimental and theoretical (mathematical model) semivariograms, as well as the respective adjustment parameters such as nugget, sill, range, the coefficient of determination, and the sum of squared residuals. The DEMs for each of the five areas was obtained after the models were tested for goodness-of-fit by cross-validation (Parfitt et al., 2009).
In order to increase the number of areas for the study, 45 areas were artificially created from the five original areas (0, 0.2, 0.25, 0.28 and 0.40%). These areas presented slopes between 0 and 0.5% with steps of 0.025% between 0 and 0.1%, and steps of 0.1% between 0.1 and 0.5% (0, 0.025, 0.05, 0.075, 0.1, 0.2, 0.3, 0.4 and 0.5%) by the use of rotation process (folding down).
A plane surface was created with the slope opposite to that of the experimental area by using the Global Mapper 15.0 software. The sum of the two surfaces generated a new surface with a zero slope (perfectly horizontal) while keeping the irregularities of the original areas. Therefore, five theoretical areas with no slope were obtained. Similarly, the no slope DEMs for the 45 areas previously cited (5 areas x 9 slopes per area) were created. Figure 1A schematically shows the situation of one of the experimental areas and its different slopes (the slopes greater than zero and lesser than 0.1% were omitted from the example).
After the generation of the digital elevation models (DEM) areas in different slopes, the second step of the GIS analysis was conducted. The contour lines were generated to identify areas with surface water storage ability through the analysis of surface depressions. The level of variation between contour lines was 5 mm. Thus, the field locations where contours with lower elevations were surrounded by contours of higher elevations were considered as surface water storage areas (depressions). First, a set of polygons for each area was obtained through this method, and then the total surface storage area (Figure 1B) was obtained with the sum of these areas.
To calculate the stored water volume, the sum of the areas of the polygons was multiplied by the depth of each corresponding polygon (Eq. 1).
V Ai Ai Z
i n =
(
+ +)
⋅ =∑
2 11
where:
V - stored water volume, m³; A - storage polygon area, m²;
Z - level difference between contour lines, 0.005 m; and, i - number of storage areas.
data distortion that is present as the water storage areas in nature is not perfectly replicated in the theoretical geometric shapes with defined standards. However, this fact was ignored as the relationship between the area of the polygon and its very small respective depth would eventually minimize this error.
The effect of the slope of the land leveling on the indicator qualitative variables of surface drainage, the area percentage
with surface storage, and the volume of water stored on the soil surface were evaluated by regression analysis.
Results and Discussion
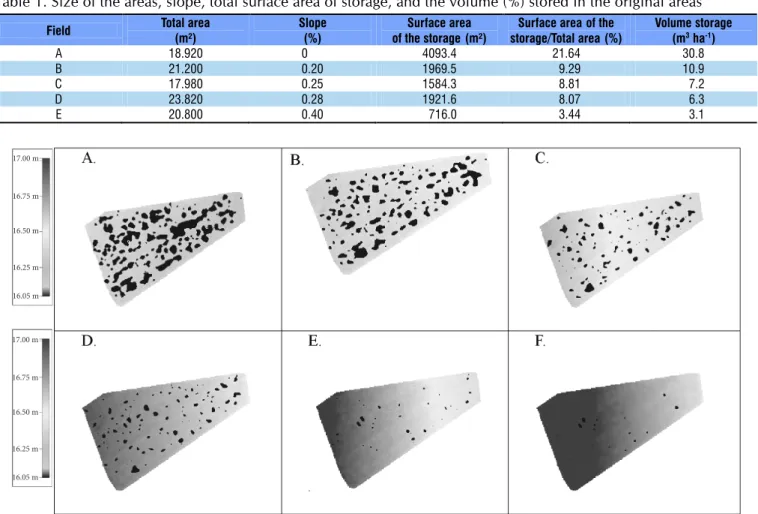
Figure 2 shows the original DEM areas A, B, C, D and E, with slopes of 0, 0.2, 0.25, 0.28 and 0.40% respectively, where
A. B.
I: Upper view; II: Cut; A: Area; Z: Depth
Figure 1. (A) Folding of digital elevation models (DEMs) for slopes proposals and (B), storage areas generated from contour lines I: Upper view; II: Cut; A: Area; Z: Depth
the locally occurring surface water storage areas can be seen. This paper presents evidence that DEM is an effective tool for studies of this nature. In the leveled areas, regardless of the slope, the presence of depressions is explained by the natural accommodation of the soil after leveling. This phenomenon is especially observed in “fill” areas, which are the lower locations that have received soil from higher locations (“cut” areas) of the field (Liu & Singh, 2004) or by the tillage and field operations.
In Table 1 the size of the areas, the slope, the total surface area of storage, and the volume (%) stored in the original areas are represented. A clear trend of decreasing storage areas is observed as sameone moves from area A with no slope (21.64%) to E with a greater slope (3.44%).
In Figure 3, area B is depicted as an example of what occurs due the folding process in the same area as the slope goes from 0 to 0.5%. It shows a visually clear tendency of decreasing the surface storage values as the slope of the field is increased.
The regression analysis of the surface water storage in the field as a function of the slope is shown in Figure 4A while Figure 4B represents the volume of water stored. Two regressions were obtained for each variable, for better comprehension, the first regression was between the interval 0-0.5% and the second regression in the inset was adjusted to the specific interval 0-0.1% (Figures 4A and B respectively). The first regression for the surface water storage (Figure 4) presented a value of R2 as 0.74 with 1% significance and in the interval 0-0.1% the R2 was valued at 0.88 with 5% significance.
In the regression for the volume of water stored (Figure 4B), the quadratic regression the value presented for R2 was 0.77 with 1% significance, while for the interval 0-0.1% the significance was 1% and the value of R2 was 0.84.
Areas whose land leveling is accomplished with no slope presented an extremely high average surface storage area of 16.5%. In the event of significant rainfall during the period of rice plantation, the operations would be compromised and severely delayed as mechanized planting would face difficulties due to the poor drainage resulting in a decrease in the crop productive potential (Slaton et al., 2003; Lack et al., 2012). For upland crops such as soybeans and corn, Thomas et al. (2005) emphasized a yield loss and morphophysiological changes when they are subjected to flooding periods. The soybean crop, depending on the cultivar, may also exhibit nodulation problems that may prevent nitrogen fixation.
The areas with no slope presented the highest stored water volume (47 m³ ha-1), followed sequentially by the slopes 0.1, 0.2, 0.3, 0.4 and 0.5% that presented 29.36, 16.04, 7.04, 2.36 and 2.0 m3 ha-1 of water stored on soil surface respectively.
The data in Figure 4 depict that for the areas in the range of 0-0.1% slope, the drainage is less affected by the slope in comparison to areas where the slope is greater than 0.1% particularly observed in the areas with 0.1-0.3% slope. This observation is due to the presence of very small slopes, where the water streams concomitantly in opposite directions or parallel to the predominant declivity in the land leveling.
Figure 3. An example of the digital elevation model (DEM) of the area B with the slopes of: 0 (A); 0.1 (B); 0.2 (C); 0.3
(D); 0.4 (E) and 0.5% (F) with the respective water storage areas on the surface of the field (black spots)
Field Total area
(m²)
Slope (%)
Surface area of the storage (m²)
Surface area of the storage/Total area (%)
Volume storage (m3ha-1)
A 18.920 0 4093.4 21.64 30.8
B 21.200 0.20 1969.5 9.29 10.9
C 17.980 0.25 1584.3 8.81 7.2
D 23.820 0.28 1921.6 8.07 6.3
E 20.800 0.40 716.0 3.44 3.1
Table 1. Size of the areas, slope, total surface area of storage, and the volume (%) stored in the original areas
17.00 m
16.75 m
16.50 m
16.25 m
16.05 m 17.00 m
16.75 m
16.50 m
16.25 m
The regressions obtained from the relationships between the magnitude of the slope with both the storage surface area and the volume of water stored show some improvement in the drainage from the slope of 0.3% onwards, but at a very slow rate (Figures 4A and B). There is a decrease of about 65% in surface water storage (Figure 4B) when the slope of 0% (16.5% water storage) when compared to the slope of 0.3% (2.67% water storage); which is highly important in practical terms as it can guide land-leveling projects focused on drainage. The slope levels between 0 and 0.3% are perfectly applied to rice irrigation with no limitation to water management by flooding or paddy sizing/dimensions.
The aforementioned results are in accordance with the ones from Jat et al. (2006), which found that areas leveled with slopes of about 0.2% provide efficient drainage, generating better machine traffic conditions at harvesting. On the other hand, Gayle & Skaggs (1978), when evaluating the surface storage areas leveled with slope of 0.2% compared to non-leveled control fields, found that the maximum amount stored in the leveled fields was 4.0 mm and the minimum 1.0 mm, while in the non-leveled control fields, the maximum storage was 33.0 mm and the minimum recorded was 13.0 mm.
The results obtained in this study are in agreement with those of Álvarez-Mozos et al. (2011), who evaluated the surface storage areas as a function of soil management, including disking and sub-soiling not necessarily followed by compressing roller application, which imposed new slopes for the elevation models generated. The authors found that as the slope of the field is increased the storage surface decreases.
Conclusions
1. The surface drainage increases with the slope in the lowlands in that state of Rio Grande do Sul, Brazil.
2. The most significant improvements on surface drainage occur between 0.1 and 0.3% of the slope, and the slopes between 0 and 0.1% demonstrate little to no effect.
3. Land leveling with slopes higher than 0.1% is recommended to minimize problems with superficial water storage in arable fields.
Acknowledgements
To the Coordenação de Aperfeiçoamento de Pessoal de Nível Superior (CAPES) for the scholarship granted to the first author. To Embrapa Clima Temperado for the availability of the area of experiment and other necessary resources for this study.
Literature Cited
Álvarez-Mozos, J.; Campo, M. A.; Giménez, R.; Casalí, J.; Leibar, C. Implications of scale, slope, tillage operation and direction in the estimation of surface depression storage. Soil & Tillage Research, v.111, p.142-153, 2011. https://doi.org/10.1016/j.still.2010.09.004 Amer, A. M. Effects of water infiltration and storage in cultivated soil on surface irrigation. Agricultural Water Management, v.98, p.815-822, 2011. https://doi.org/10.1016/j.agwat.2010.12.006 Aquino, L. S.; Timm, L. C.; Reichardt, K.; Barbosa, E. P.; Parfitt, J.
M. B.; Nebel, A. L. C.; Penning, L. H. State-space approach to evaluate effects of land levelling on the spatial relationships of soil properties of a lowland area. Soil & Tilage Research, v.145, p.135-147, 2015. https://doi.org/10.1016/j.still.2014.09.007 Borselli, L.; Torri, D. Soil roughness, slope and surface storage
relationship for impervious areas. Journal of Hydrology, v.393, p.389-400, 2010. https://doi.org/10.1016/j.jhydrol.2010.09.002 EMBRAPA - Empresa Brasileira de Pesquisa Agropecuária. Centro
Nacional de Pesquisa de Solo. Sistema brasileiro de classificação de solos. Brasília: Embrapa, 2006. 306p.
Gayle, G. A.; Skaggs, R. W. Surface storage on bedded cultived lands. Transactions of de ASAE, v.21, p.101-109, 1978. https://doi. org/10.13031/2013.35258
González, C.; Cervera, L.; Moret-Fernández, D. Basin irrigation design with longitudinal slope. Agricultural Water Management, v.98, p.1516-1522, 2011. https://doi.org/10.1016/j.agwat.2011.05.007 Hansen, B.; Schjønning, P.; Sibbesen, E. Roughness indices for
estimation of depression storage capacity of tilled soil surfaces. Soil & Tillage Research, v.52, p.103-111, 1999. https://doi. org/10.1016/S0167-1987(99)00061-6
IRGA - Instituto Riograndense do Arroz. Safra 2014/2015. Revista Lavoura Arrozeira, v.62, p.8-9, 2014.
Jat, M. L.; Chandana, P.; Sharma, S. K.; Gill, M. A.; Gupta, R. K. Laser land leveling: A precursor technology for resource conservation. rice-wheat consortium technical Bulletin Series 7. Rice Wheat Consortium for the Indo-Gangetic Plains. New Delhi- India, 2006. 48p.
Kamphorst, E. C.; Jetten, V.; Guérif, J.; Pitkänen, J.; Iversen, B. V.; Douglas, J. T.; Paz, A. Predicting depressional storage from soil surface roughness. Soil Science Society of America Journal, v.64, p.1749-1758, 2000. https://doi.org/10.2136/sssaj2000.6451749x
Figure 4. Regression analysis of (A) surface water storage
area and (B) water stored on soil surface in the field as
function of the slope of land leveling
A.
B.
Surface water storage (%)
V
olume of water stored (%)
Slope (%)
Lack, S.; Marani, N. M.; Mombeni, M. The effects of planting date on grain yield and yield components of rice cultivars. Advances in Environmental Biology, v.6, p.406-413, 2012.
Liu, Q.; Singh, V. P. Effect of microtopography, slope length and gradient, and vegetative cover on overland flow through simulation. Journal of Hydrologic Engineering, v.9, p.375-382, 2004. https://doi.org/10.1061/(ASCE)1084-0699(2004)9:5(375) Parfitt, J. M. B.; Timm, L. C.; Pauletto, E. A.; Sousa, R. O. de;
Castilhos, D. D.; Ávila, C. L.; Reckziegel, N. L. Spatial variability of the chemical, physical and biological properties in lowland cultivated with irrigated rice. Revista Brasileira de Ciência do Solo, v.33, p.819-830, 2009. https://doi.org/10.1590/S0100-06832009000400007
Pinto, L. F. S.; Laus Neto, J. A.; Pauletto, E. A. Solos de várzea do Sul do Brasil cultivados com arroz irrigado. In: Gomes, A. da S.; Magalhães Júnior, A. M. de. Arroz irrigado no Sul do Brasil. Brasília: Embrapa Informação Tecnológica, 2004. Cap.2, p.45-95. Slaton, N. A.; Linscombe, S. D.; Norman R. J.; Gbur, E. E. Seeding
date effect on rice grain yields in Arkansas and Louisiana. Agronomy Journal, v.95, p.218-223, 2003. https://doi.org/10.2134/ agronj2003.0218
Soil Survey Staff USA. Soil Taxonomy: A basic system of soil classification for making and interpreting soil surveys. National Soil Survey Center, Soil Conservation Service, U.S. 2.ed. Lincoln: Department of Agriculture, Government Printing Office. 1999. 754p.
Thomas, A. L.; Guerreiro, S. M. C.; Sodek, L. Aerenchyma formation and recovery from hypoxia of the flooded root system of nodulated soybeam. Annals of Botany, v.96, p.1191-1198, 2005. https://doi. org/10.1093/aob/mci272
Valipour, M. A Comparison between horizontal and vertical drainage systems (include pipe drainage, open ditch drainage, and pumped wells) in Anisotropic Soils. IOSR Journal of Mechanical and Civil Engineering, v.4, p.7-12, 2012. https://doi.org/10.9790/1684-0410712
Valipour, M. Use of surface water supply index to assessing of water resources management in Colorado and Oregon, US. Advances in Agriculture, Sciences and Engineering Research, v.3, p.631-640, 2013.