*e-mail: [email protected]
1. Introduction
Aluminum alloys are used for diverse applications, including in the automobile and aerospace industries. Thus, the selection of their composition is dictated by their welding behavior as well as applicable welding processes. Among the aluminum alloys, the AA6xxx wrought alloys have become signiicant due to their versatile application for armor structures, rockets, missile casings, lightweight defense vehicles, cars and marine structures because of their high strength to weight ratio, plasticity, formability and fairly good corrosion resistance. The AA6xxx alloy properties change based on the chemical composition and processing conditions, such as hot working, cold working, annealing, and the aging process1. The primary alloying elements, including Mg, Si, Cu, Fe and Mn, play an important role in AA6xxx alloy properties. For instance, the elements Mn and Cr increase the alloy strength (10-15%). Additionally, due to the good corrosion resistance of AA6xxx, these alloys become susceptible to intergranular corrosion and stress corrosion cracking when the content of Cu and Si are increased. Indeed, the addition of Fe without a Fe corrector increases the pitting corrosion tendency1.
The friction stir welding (FSW) process is an emerging “green” solid-state joining method where, in contrast to fusion welding, the material to be welded does not reach its melting point2,3. Accordingly, the joining of the metal plates is based on a thermo-mechanical action by a non-consumable welding tool onto the metal plates2. In this
regard, the FSW process parameters, aluminum alloy chemical composition, and the post weld heat treatment affect the mechanical properties, fracture locations and corrosion behavior for the different types of FSW aluminum alloys3-5. FSW has increasingly been utilized, particularly in
situations where solidiication cracking, liquation cracking and micro porosity formation need to be avoided6. FSW can be especially advantageous for Al alloys, as the process imparts a low heat input and can lexibly join cast, extruded, and rolled materials without requiring a complicated surface preparation or shielding gas protection7. According to Mishra and Ma8, it is clear that several microstructural zones, e.g., the weld nugget zone (WNZ), the thermo-mechanical affected zone (TMAZ), and the heat affected zone (HAZ), are generated during the FSW process; each of these zones exhibits different microstructural characteristics, including grain size, dislocation density, and residual stress as well as precipitate size and distribution. They also reported that the different microstructural zones will have different corrosion susceptibilities.
For practical applications, it is very important to identify the corrosion behavior of the FSW welds and explain the dominant corrosion mechanisms in the different FSW alloys and various microstructural zones. It should be emphasized that the alloy chemistry, residual microstructures in the FSW welds, and the corrosion media are important factors that can affect FSW aluminum alloy corrosion behavior. In this regard, Astarita et al.5 evaluated the stress corrosion cracking (SCC) behavior of different aluminum alloys,
Investigation of the Nugget Zone Corrosion Behavior in Friction Stir Welded
Lap Joints of 6061-T6 Aluminum Alloy
Farhad Gharavia, Khamirul Amin Matoria,b*, Robiah Yunusa, Norinsan Kamil Othmanc
aMaterials Synthesis and Characterization Laboratory, Institute of Advanced Technology, Universiti Putra Malaysia, 43400 UPM Serdang, Selangor, Malaysia
bDepartment of Physics, Faculty of Science, Universiti Putra Malaysia, 43400 UPM Serdang, Selangor, Malaysia
cSchools of Applied Physics, Faculty of Science and Technology, Universiti Kebangsaan Malaysia, 43600 UKM Bangi, Selangor, Malaysia
Received: February 28, 2014; Revised: August 8, 2014
The corrosion behavior at different positions (top and bottom) of the weld nugget zone along the thickness plates in AA6061-T6 aluminum alloys welded by friction stir lap welding, under the conditions of 1000 rpm-60 mm/min and 900 rpm-40 mm/min in a 3.5 wt% NaCl solution, was investigated by Tafel polarization at ambient temperature. The morphology of the nugget zone corroded surfaces was analyzed by scanning electron microscopy together with energy dispersive spectroscopy (SEM-EDS) as well as atomic force microscopy (AFM). It was found that the top half of the nugget zone has a better corrosion resistance than that of the bottom half for both welding conditions. A localized pit dissolution with combined intergranular corrosion are the dominant corrosion types across different positions of the nugget zone for various welding conditions and in the parent alloy.
revealing that the weld zone of all tested joints was susceptible to intergranular corrosion and pitting. The joints tested by SCC showed a greater state of degradation than those tested by simple OC (i.e., unloaded), and in some cases, considerable cross section reductions were evident. Additionally, Proton et al.9 demonstrated that among the weld zones, the nugget zone was the most interesting area in the FSW welded joint because its corrosion behavior is closely connected to its particular microstructure, created through the combination of high strain rate and temperature. Moreover, Mishra and Ma8 also reported that as the nugget zone exhibits the highest degree of deformation during the welding process, it is a dynamically recrystallized zone with ine equiaxed grains. It has been reported that the small-recrystallized grains in the nugget zone contain a high density of boundaries, sub-grains, and dislocations. Indeed, with an increase in the rotation speed or the rotation speed/welding speed ratio; the recrystallized grains in the FSW aluminum alloys will generally be increased. It is also evident that when increasing the temperature difference between the top and bottom of the WNZ by increasing the plate thickness, the difference in the nugget zone’s grain size will be increased. This evolution could be related to the thermal gradient from the top to the bottom, caused by the presence of the shoulder10. It has been demonstrated that during the FSW process, the temperature within the nugget zone increases to 400-550 °C due to the friction between the tool and parent alloy and the plastic deformation around the rotating pin. In this case, all of the intermetallic precipitates formed by high temperature in aluminum alloys can become coarse or dissolve into the aluminum matrix depending on the alloy type and the maximum temperature8.
Both Nandan et al.10 and Paglia and Buchheit11 reported that intermetallic precipitates with a homogenous distribution tend to be smaller in the parent alloy than in the nugget zone. However, the number of large precipitates in the nugget zone was considerably less than in the parent alloy. This can be attributed to the dissolution and coarsening of the intermetallic precipitates during the FSW process. They also emphasized that because of the dissolution of the intermetallic particles or the matrix, micro galvanic coupling phenomena may appear on the welded sample surface in a corrosive solution. It should be emphasized that few studies have focused on the corrosion behavior of the weld nugget zone in welded joints of aluminum alloys. Xu et al.12,13 investigated pitting corrosion using an alkaline chloride solution at different positions of the weld nugget zone along the thickness plate in FSW 2219-O aluminum alloys, inding that the materials present signiicant passivation, with the top of the zone having the highest corrosion potential, pitting potential and repassivation potential compared to the bottom or base material. Proton et al.9 also showed that the nugget of a FSW joint formed from a 2050 Al-Cu-Li alloy was susceptible to both intergranular and intragranular corrosion, with the corrosion behavior related to the microstructural heterogeneities observed on a microscopic scale. Thus, this work is the irst report attempting to understand the relationship between the microstructure and the corrosion behavior of a weld nugget zone in FSLW joints of a 6061-T6 aluminum alloy. The goal of this work is to investigate
how the changes in the weld nugget zone microstructure affect its corrosion behavior. For the analysis, Tafel polarization measurements, scanning electron microscopy (SEM) and atomic force microscopy (AFM) were used in this investigation.
2. Experimental Procedure
2.1. Materials
The parent alloy was a 6061-T6 wrought aluminum alloy plate with a 5 mm thickness, deined by the B0209-04 ASTM standard14. The nominal compositions of the materials used in this study are given in Table 1.
2.2. Welding method
The friction-stir lap welding (FSLW) process and joint design used in this research are depicted in the schematic in Figure 1. As shown in Figure 1, the dimensions of each overlapping plate were up to 220 mm in length and 140 mm in width, allowing them to be longitudinally overlap welded parallel to the plate’s rolling direction using an automatic CNC machine. The overlap along the linear direction of the plate was 50 mm wide. A welding ixture was designed to tightly clamp the lapped parent alloy to be welded on the worktable. A supporting plate of identical thickness was placed underneath the upper plate to help align and stabilize the plates to be welded. A single FSLW pass was performed along the longitudinal centerline of the overlap. The chosen tool parameters used for welding in this work are given in Table 2, and the welding conditions are listed in Table 3. To improve the weld joining, the tool was tilted 3 degrees from the plate’s normal direction toward the trailing side of the tool during welding. Additionally, a clockwise rotational direction was chosen.
2.3. Structural characterization
After the welding process, the electro spark wire-electrode cutting machine was used to remove sample cross sections from the welded plate’s perpendicular to the welding direction for microstructural examination and corrosion studies. As a result, the samples were cut along the welding direction to separate the weld nugget zone (WNZ) from the welded joints. Then, the WNZ was sliced into two zones (top and bottom) along the thickness of the plates, as shown in Figure 1a. The samples were used in the lat coniguration after careful preparation by applying
Table 1. Nominal composition of parent alloy used in the welding test (in wt%).
Alloy Si Fe Cu Mn Mg Cr Ti Zn Al
Al6061 0.66 0.3 0.27 0.07 1.0 0.18 0.02 0.05 Balance
Table 2. Welding conditions used in this study.
Joint symbol Rotation speed (rpm) Welding speed (mm/min) Tool tilts Heat Index (×103)
FSLW 1 1000 60 3° 16.6
Figure 1. Cross section of the macrograph (a), SEM micrograph of grains and distribution of intermetallic particles in FSLW 1 (b) top (c) bottom and FSLW 2 (d) top (e) bottom.
Table 3. EDS analysis (wt %) of different intermetallic precipitates highlighted in weld regions and parent alloy shown in Figure 1.
Location Points Composition (wt%)
Al Mg Si Fe Cu Cr
Parent alloy Bright 90.46 0.66 1.75 6.8 0.21 0.12
Dark 89.58 0.18 9.83 0.41 -
-FSLW 1-WNZ Bright 93.4 0.68 1.13 4.5 011 0.18
Dark 94.11 - 5.6 0.26 -
-FSLW 2-WNZ Bright 91.69 0.76 1.31 5.8 0.18 0.26
-standard metallographic techniques, including wet grinding (water and SiC abrasive paper with grit numbers of 400, 600, 800, and 1200), followed by polishing with a 1 µm diamond paste, degreasing with acetone, washing with double distilled water, and drying in warm air. Samples were etched by immersion in an etchant solution composed of 5 ml HNO3, 3 ml HCl, 2 ml HF, and 100 ml H2O. Scanning electron microscopy (SEM), energy dispersive spectroscopy (EDS) and atomic force microscopy (AFM) techniques were used to analyze the microstructures of the samples after the welding process and corrosion tests.
3. Electrochemical testing
To compare the corrosion behavior of the test samples, Tafel polarization curves were plotted using a PARSTAT 2273 equipped with the Power Suite software according to the ASM standard15 in a 3.5 wt% aerated NaCl aqueous solution (pH = 5.5) at ambient temperature. Prior to placing the test samples in the open glass vessel containing the test solution for use as a corrosion cell, they were embedded in cold-setting resins in order to expose only a single surface to the test solution, and these were connected electrically with a copper wire after being set in a polyethylene tube. Immediately prior to each experiment, the surface of the sample was dipped in concentrated HNO3 for 30 s. The electrochemical measurement consisted of a standard three electrode setup with the sample as the working electrode, including both the top and bottom regions of the nugget (0.3 cm2), a saturated calomel electrode SCE (0.242 V vs. SHE) as the reference electrode, and a graphite rod as the counter electrode. The Tafel polarization curves were recorded in the potential range of –0.25 mV to +0.75 mV with respect to the OCP at a scan rate of 1 mVs–1 after allowing a steady-state potential to develop for 30 min. The corrosion potentials (Ecorr) and corrosion current densities (Icorr) were calculated using Tafel extrapolation methods. All the experiments in this study were repeated at least twice to ensure reproducibility.
4. Results and Discussion
4.1. Results of the metallographic observation
Figure 1 depicts the backscattered electron micrographs of the grains and distribution of intermetallic particles at different WNZ positions for FSLW 1 as 1000 rpm-60 mm/min and FSLW 2 as 900 rpm-40 mm/min. The EDS analyses of the intermetallic particles are summarized in Table 3. Two types of intermetallic particles, including the Fe-rich and the Si-rich particles are observed as transparent and dark particles, respectively. Indeed, for FSW under different values of ω (rpm) and ʋ (mm/min), the temperature and material low patterns have been studied by numerous researchers. Fratini and Buffa16 reported that with increasing
ω (rpm) and decreasing ʋ (mm/min), the quality of the welding will be enhanced due to the increase in stirring effects. Furthermore, according to Arbegast and Hartley17, both the tool rotational speed (ω, rpm) and the welding speed (ʋ, mm/min) display a signiicant effect on the thermal input and mechanical properties. Ren et al.18 demonstrated that
it is dificult to quantitatively estimate the thermal input (Heat Index, HI) and mechanical properties due to the change in both rotation speed (ω) and welding speed (ʋ). Based on experimental thermal observation, a Heat Index (HI) parameter has been used to represent the thermal input during FSW, which is deined as19-21:
HI = 10–4 (ω2/ʋ) (1)
where ɷ is the tool rotational speed (rpm) and ʋ is the welding speed (mm/min).
It is clear that both increasing ω and decreasing ʋ (increasing the (ω2/ʋ) ratio) result in an increase in the FSW Heat Index. Accordingly, and based on the principles of grain growth, the grain size of the structure is increased at faster ʋ (Figure 1). According to Table 2, the HI in the FSLW 2 is higher than that in the FSLW 1; thus, the average grain size in the WNZ of FSLW 1 is smaller than that of FSLW 2, resulting in FSLW1 having a iner grain structure than FSLW 2. Furthermore, the quantity of the coarse intermetallic particles and their distributions are promoted with the increased Heat Index (HI) in FSLW 2 rather than FSLW 1 (Figure 1).
separately distributed in the Al matrix on the top and bottom of the weld nugget zone.
4.2. Electrochemical behavior
In some of the more complicated multi-pass processes compared to the FSW (e.g., equal channel angular pressing), the inluence of texture variation (in addition to the grain size) on corrosion behavior should be considered22,23. However, during FSW, the extensive shear plastic deformation is the primary phenomenon, leading to a dynamic recrystallized fine grain microstructure in the WNZ8,24. Meanwhile, due to the rapid heat transfer and the reduction in plastic deformation along the thickness of the plates, the grain size in the top half of the WNZ is smaller than that in the bottom half for FSLW 1 and FSLW 2 (Figure 1).
It is important to note that the intermetallic particles in the top half of the WNZ experienced greater mechanical stirring and crushing mechanics. Accordingly, they have a smaller size than those in the bottom half. Meanwhile, due to the generation of a greater friction heat in the FSLW 2; its intermetallic particle sizes are larger than in FSLW 1 at both the top and bottom halves of the WNZ. Ralston et al.25, who evaluated the relationship between the corrosion rate and grain size (G.S.) across a diverse range of metals and suggested the following equation, presented the effect of grain size on the corrosion rate of metallic alloys:
icorr = α + β (G.S.)–0.5 (2)
where the constant α is claimed to be a function of the environment and β is a material dependent constant that will change based on the composition or impurity level.
Regarding the above equation, as the grain size (G.S.) increases, there will be a higher corrosion resistance, decreasing the icorr25. Consequently, the corrosion resistance of the FSLW 1 is higher than that of the FSLW 2 at both the top and bottom halves of the WNZ. Based on Equation 2, by increasing the (ω/ʋ) ratio, the heat index in the WNZ increases, generating the coarse recrystallized grains in the WNZ8,22,25. In this regard, due to the increasing heat index in the FSLW 2 with respect to the FSLW 1, the grain size in both halves of the WNZ for FSLW 2 is smaller than that of FSLW 1.
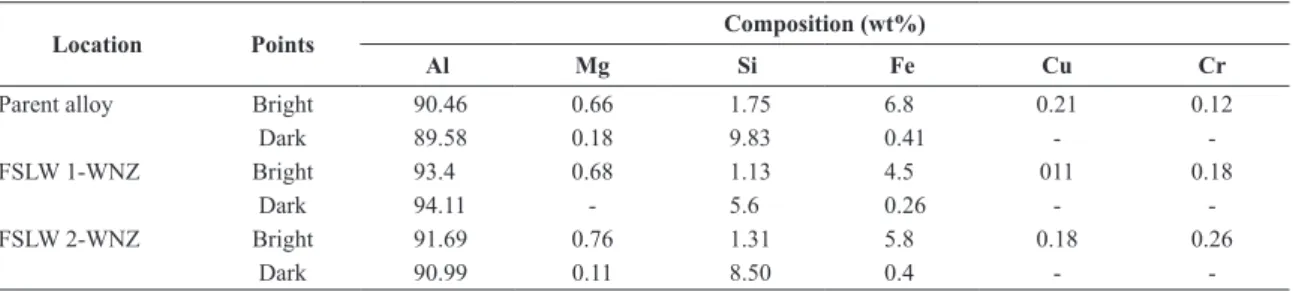
Tafel polarization curves of different WNZ locations after immersion for 30 min in the 3.5 wt% NaCl solution for both welding conditions are presented in Figure 2. It is clear that the Tafel polarization plots for the WNZ are completely unsymmetrical for passive metals. According to the Purbaix diagram of aluminum, aluminum alloys are expected to develop immunity to corrosion by forming a passivation layer in the pH range of 4 to 8.5. The solution used in this research consisted of a 3.5 wt% aqueous NaCl solution at ambient temperature with a pH = 5.5. In these conditions, the aluminum alloy is prone to passive layer formation; however, this behavior was not seen in the various regions of the WNZ. The inability to form a passivation layer is related to the weld microstructure. With closer observation of the polarization curves, it is clear that the anodic branch of the polarization plots for the parent alloy and the different positions of the WNZ are similar to one other, meaning that all have a similar anodic dissolution mechanism. In comparison, the parent alloy and the different positions of the WNZ have an identical cathodic branch, but with different cathodic slopes. In other words, the cathodic branch of the curves (over -900 mV potential) are controlled by the diffusion of oxygen, and beyond a -800 mV potential, the cathodic reactions are controlled by water activation and oxygen reduction. Thus, from the polarization curves taken at the different WNZ positions, it is clear that the corrosion in these areas is controlled by a cathodic reaction because the cathodic Tafel slope is greater than the anodic slope. An increase in the cathodic Tafel slope with respect to the anodic slope can be related to the presence of the intermetallic particles in the Al matrix.
Intermetallic elements are more electrochemically active than the matrix, acting as anodes and undergoing dissolution, while particles nobler than the aluminum matrix act as cathodes. Generally, it is accepted that noble Fe- or Cu-containing intermetallic particles act as cathodes and support oxygen reduction.
Based on the electrochemical reactions of aluminum and its alloys in an aqueous, chloride-containing solution, the cathodic reactions are the reduction of water and of oxygen, shown below12,26:
2H2O + 2e–→ H 2 + 2OH
– (3)
2H2O + O2 + 4e–→ 4OH– (4)
whereas the oxidation of aluminum occurs at the anode12,26:
Al → Al+3 + 3e– (5)
It should be noted that reaction (3) can be easily detected by release of hydrogen gas at the electrode surface. However, reaction (4) is not clearly identifiable and is usually controlled by diffusion. Based on the above reactions, it is clear that the reduction of oxygen will occur near the cathodic regions (i.e., intermetallic particles) and the anodic oxidation of aluminum will occur on the Al matrix. When the oxygen was reduced, the concentration of hydroxyl ions (OH-) increases around the intermetallic particles leading to a local increase in pH26-29. Therefore, there is a localized pH increase on the cathodic intermetallic particles caused by dissolution of the passive oxide (passivation) layer. As a result, the Al matrix will then be in contact with the corrosive solution, and the localized corrosion will also cause passivation layer dissolution. The appearance of pitting corrosion can be related to the degree of the reduction reactions occurring on a set of intermetallic particles26-29. Moreover, the presence of Cl– ions in a neutral solution results in the following reactions30:
Al(s) + Cl–→ AlCl ads + e
– (6)
AlClads + Cl–→ AlCl 2ads + e
– (7)
AlCl2 + Cl–→ AlCl 3ads + e
– (8)
AlCl3 dissolves into the solution and hydrolyzes, leaving the bare Al matrix active sites open for a corrosion attack, meaning that the rate of corrosion increases in the presence of Cl– [30].
The amount of corrosion potential and the corrosion current densities are summarized in Table 4. As the observed corrosion potential values in FSLW 1 and FSLW 2 shifted towards the anodic direction from the bottom half to the top half of the WNZ, it is clear that the corrosion potential of the bottom half of the WNZ for both welding conditions is smaller than that of the top half; thus, the corrosion resistance of the bottom half of the WNZ in FSLW 1 is better than that of FSLW 2. On the other hand, the corrosion resistance of the top half of the WNZ in FSLW 2 is inferior to the top half in FSLW 1. It is obvious that the top half of
the WNZ in FSLW 1 has a higher corrosion resistance than the parent alloy, but the corrosion resistance of the top half in FSLW 2 is similar to that of the parent alloy. Additionally, it was observed that the corrosion current density of the WNZ decreased in both FSLW 1 and FSLW 2 as opposed to the parent alloy. The larger corrosion current density causes the parent alloy to become more susceptible to localized corrosion. Thus, the localized corrosion of the bottom half was more severe than that of top half for both FSLW 1 and FSLW 2, whereas the highest current density was observed in the parent alloy. It should be emphasized that the corrosion resistance of the bottom half of the nugget zone for both welding conditions decreased with respect to the top half due to the larger intermetallic particle size and their greater distribution in the weld. Overall, it can be seen in Figure 2 that the WNZ corrosion resistance of both positions was increased in the FSLW 1 rather than in the FSLW 2.
Figure 3 presents the curve’s polarization resistance variation and corrosion current density for the top and bottom of the WNZ along the nugget zone thickness in the test solution for FSLW 1 and FSLW 2. The polarization resistance reduces when moving from the top half to the bottom half of the WNZ. Additionally, the reduction in the polarization resistance from the top half to the bottom half of the WNZ is the highest for FSLW 2. In contrast, the corrosion current density increased in the bottom half of the WNZ for FSLW 2 with respect to FSLW 1. In this
Table 4. Effect of welding conditions on variations of corrosion potential, current density and corrosion rate.
Material/process E(mV) vs. SCE
Icorrosion
(µAcm–2)
C.R (mpy)
Parent alloy (PA) –696 2.27 1.01
FSLW 1-Top –685 1.15 0.48
FSLW 1-Bottom –715 1.26 0.56
FSLW 2-Top –703 1.50 0.85
FSLW 2-Bottom –732 2.80 1.23
Figure 3. Polarization resistance for different positions of WNZ in parent alloy and different welding parameters.
regard, the maximum value in the bottom half, belonging to FSLW 2, was 2.8 µAcm–2, while the minimum value in the top half, belonging to FSLW 1, was 1.15 µAcm–2. Accordingly, the polarization resistance increased with a decrease in the corrosion current density in both the top and bottom of the WNZ for FSLW 1 as opposed to FSLW 2. It is clear that the higher corrosion current density in both the top and bottom of the WNZ for FSLW 2 results in a greater susceptibility to corrosion attack. Thus, the corrosion resistance of the bottom half for both FSLW 1 and FSLW 2 is lower than that of the top half. Therefore, the largest pit diameters and density occurs in the bottom WNZ half for FSLW 2.
4.3. Micro hardness
Figure 4 depicts the micro hardness proile variation from the bottom half to the top half of the WNZ along the thickness plates for FSLW 1 and FSLW 2. As seen in Figure 4, the hardness variation decreases from the bottom half to the top half of the WNZ for both welding conditions. There are obvious luctuations in the hardness variation for FSLW 2. However, for FSLW 1, the hardness variation does not have any luctuation, with a gradual decrease in the slope from the bottom half to the top half of the WNZ. It is also clear that the hardness variations in the top half of the WNZ for FSLW 1 are nearly identical, meaning that the distribution of intermetallic particles in the top half of the WNZ for FSLW 1 is greater and more uniform than that of the bottom half. As a result of the hardness variation, the adsorption capacity of the Cl- ions on the top half of the WNZ is less than that of the bottom half. The polarization plot displayed in Figure 2 also conirms this.
4.4. Observation of the corrosion morphology
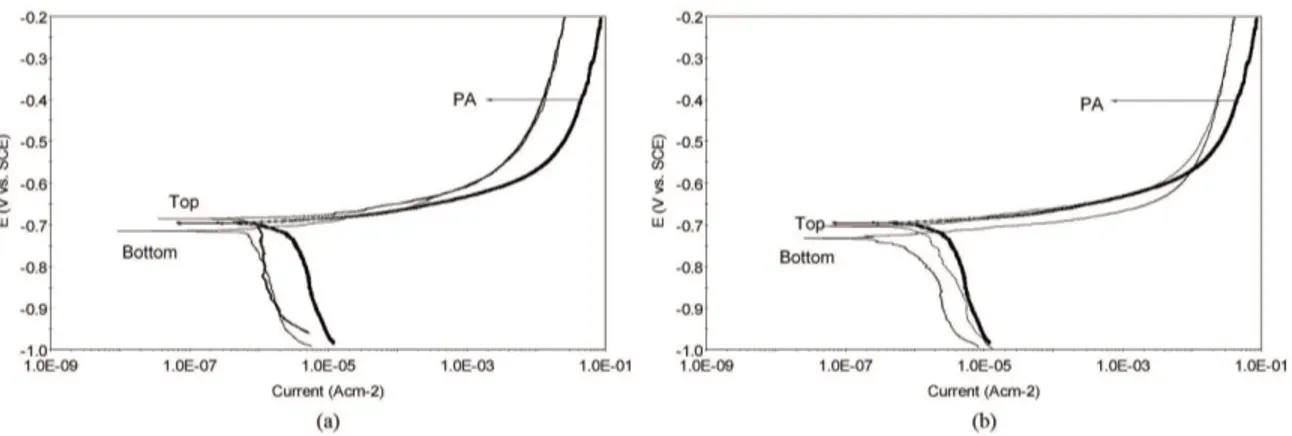
Figure 5 shows the observation of the corrosion morphology on the parent alloy’s surface after Tafel polarization. It can be seen that both a localized pit dissolution and intergranular corrosion were generated on the surface of the parent alloy. Large pits were observed, and the intergranular attack occurred on the pit walls. In fact, the intergranular attack was both intensive and extensive but remained localized around the pit walls. It can be seen in Figure 3 that the bottom half of the WNZ has larger and deeper pits than that of the top half for the FSLW 2 samples. Moreover, it is apparent that the grain boundaries were attacked across the pits in the bottom half of the WNZ, and intergranular corrosion spread from the pit, resulting in relatively narrow grooves in the grain boundaries. This can be attributed to the higher heat input of FSLW 2 during the welding process. The generation of high heat input sensitizes the grain boundaries in the bottom half of the WNZ during the welding process with passing time. In this way, the thermal transients experienced during the FSLW changed the chemistry of the grain boundaries and in regions near the boundary, selectively sensitizing the grain boundary region to varying degrees31.
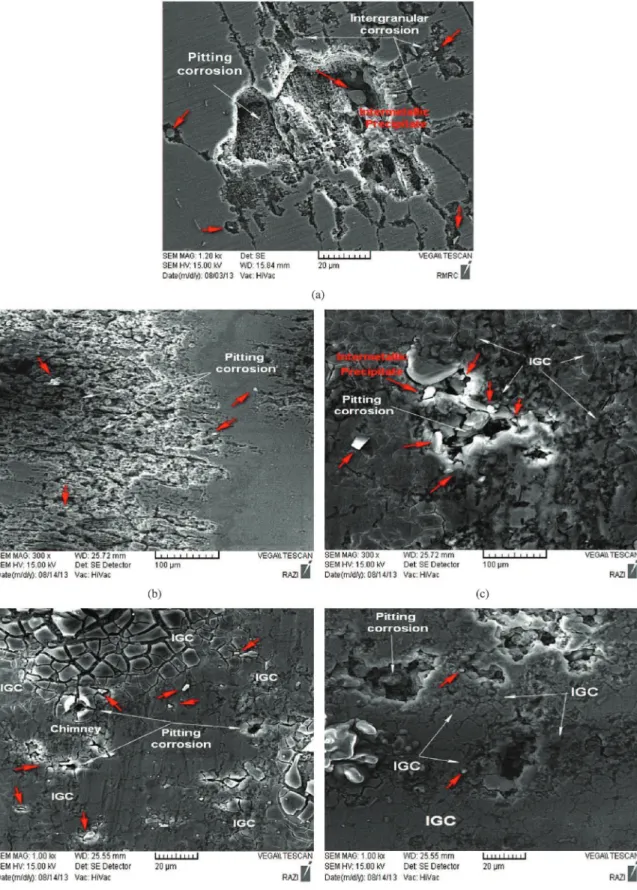
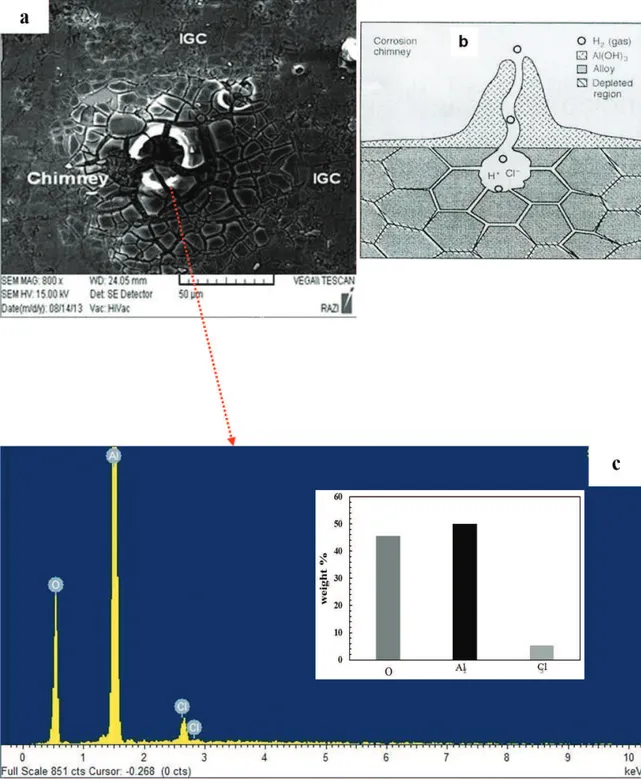
Furthermore, across the corroded surface, some corrosion products, including corrosion chimneys, were observed. The majority of them were circular with a central hole in the top half of the WNZ for the FSLW 2 samples (as shown in Figure 6a). It is believed that each hole beneath a circular corrosion product is a pit. Thus, the pit environment is isolated from the bulk solution by an abundance of aluminum hydroxide corrosion products (AlClx[OH]3-x), becoming acidic and high in chloride concentration32. The EDS analysis of the corrosion products is shown in Figure 6c, showing the presence of AlCl3 in the corrosion products. The presence of this component accelerates the breakdown of the aluminum hydroxide corrosion products33. The mud cracking (hydroxide breakdown)33 is displayed in Figure 6a. Moreover, it is hypothesized that after the pit environment becomes acidic, microscopic tunnels can begin nucleating on the pit walls, followed by the microscopic tunnels penetrating along the grain boundaries in contact with the growing pit (as shown in Figure 6b). In this regard, Guillaumin and Mankowiski32 also reported that intergranular corrosion will begin on the pit walls and then will spread from them.
Compared to the top half of the WNZ in the FSLW 2 samples, pitting corrosion was observed to be dominant in the top half of the WNZ in the FSLW 1 samples (as shown in Figure 5). The observed pits are signiicantly ramiied, presenting a rough proile on the surface of the sample. This can be attributed to the fact that the top half of the WNZ for FSLW 2 was exposed to high temperatures during the welding process, which modiied the variation in the microchemistry and microstructure. In this case, due to the high temperature at the top of the WNZ for FSLW 2, the intermetallic particles experienced an abnormal growth and were distributed separately in the Al matrix13. Indeed, in the bottom half of the WNZ for FSLW 1, similar to that for FSLW 2, pitting and intergranular corrosion were encountered together, but the pit size and depth was smaller than those of the FSLW 2 samples. Additionally, the intergranular corrosion across the pits occurred as broad grooves in the grain boundaries, extending from the pits. It should be emphasized that the presence of intergranular corrosion in the different positions of the WNZ for FSLW 1 and FSLW 2 contributed to the dissolution of intermetallic particles and their signiicant reinement during the friction stir lap welding. Moreover, it is obvious that the pitting corrosion mainly occurred in the vicinity of the iron (Fe) rich intermetallic particles. The EDS analysis of the corroded area conirmed the presence of Fe-rich precipitates in these areas; thus, the galvanic corrosion occurred between the Al matrix and the Fe-rich precipitates.
Figure 6. (a) Corrosion chimney in the top of WNZ at FSLW 2, (b) cross section of corrosion chimney24, (c) EDX of corrosion products.
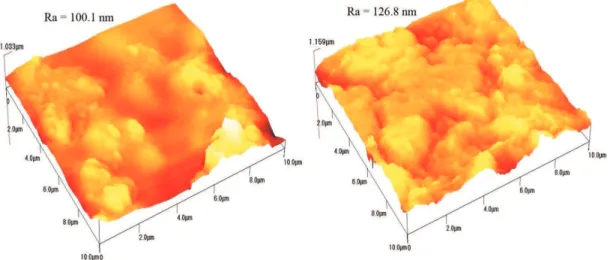
the bottom half of the WNZ for both FSLW 1 and FSLW 2, and the intensity of corrosion attacks on the surfaces of the FSLW 2 samples is greater than that of the FSLW 1 samples. As seen in Figures 8 and 9, the average surface roughness (Ra) of the top and bottom halves of the WNZ for FSLW 2 is greater than that for FSLW 1. The increase in average
Figure 7. Three-dimensional AFM images (10 μm × 10 μm) of the
samples surface after corrosion test: Parent alloy.
Figure 8. Three-dimensional AFM images (10 μm × 10 μm) of the samples surface after corrosion test: (a) Top (b) Bottom of WNZ in
FSLW 1.
Figure 9. Three-dimensional AFM images (10 μm × 10 μm) of the samples surface after corrosion test: (a) Top (b) Bottom of WNZ in
FSLW 2.
5. Conclusions
From this investigation, the following conclusions were obtained:
1. The microstructures at different positions of the WNZ in the FSLW 1 and FSLW 2 samples revealed dynamically recrystallized and fine equiaxed grain structures. The size and distribution of the intermetallic particles, especially the Fe-rich particles, increase from the top half to the bottom half in the WNZ of both FSLW samples. Furthermore, the Fe-rich particle sizes at different positions of the WNZ of the FSLW 2 samples are larger and wider than those at the top and bottom halves of the WNZ at FSLW 1. This can be attributed to the high temperature exposure of this section of the FSLW 2 sample during the welding process.
pit nucleation and consequently for intergranular corrosion. Indeed, the intergranular corrosion mechanism appears to dissolve the Fe-rich and Si-rich particles in the Al matrix during the welding process, and their distribution along the grain boundary acts as localized cathodes compared to the Al matrix as an anodic area.
3. The parent alloy of 6061-T6 is more susceptible to pitting and intergranular corrosion. The corrosion resistance in the top half of the WNZ for both FSLW 1 and FSLW 2 is better than that of bottom half. 4. Tafel polarization test results indicate that the top half
of the WNZ for both FSLW 1 and FSLW 2 has the highest corrosion potential (Ecorr), making it effective at resisting corrosion attack, but the bottom halves of the WNZ under both welding conditions have the smallest corrosion potential of all samples.
Finally, these results were be proven by the corrosion attack morphology in the SEM and AFM images, suggesting that the corrosion resistance at different positions in the WNZ for the FSLW 1 samples is greater than for the different positions of the WNZ for the FSLW 2 samples.
Acknowledgments
The authors wish to place sincere special thanks to Dr. Mohd Khairol Anuar Mohd Arifin Head of Department of Mechanical and Manufacturing, Faculty of Engineering, Universiti Putra Malaysia (UPM) for their technical supports. In addition, the authors are grateful to Prof. Abdul Razak Daud from the School of Applied Physics, Faculty of Science and Technology, University Kebangsaan Malaysia (UKM) for his help and guidance to do this research.
References
1. Mukhopadhyay P. Alloy Designation, Processing, and Use of AA6xxx Series Aluminum Alloys. International Scholarly Research Network, ISRN Metallurgy. 2012; 2012:1-15. http:// dx.doi.org/10.5402/2012/165082.
2. Thomas WM, Nicholas ED, Needham JC, Church MG, Templesmith P and Dawes CJ. G.B. Patent Application. No. 9125.978.9. 1991
3. Astarita A, Squillace A, Armentani E and Ciliberto S. Friction stir welding of AA2198-T3 rolled sheets in butt configuration.
Metallugia Italiana. 2012; 104(7-8):31-40.
4. Prisco U, Squillace A, Astarita A and Velotti C. Influence of welding parameters and post-weld aging on tensile properties and fracture location of AA2139-T351 friction stir welding joints. Materials Research. 2013; 16(5):1106-1112. http:// dx.doi.org/10.1590/S1516-14392013005000099.
5. Astarita A, Bitondo C, Squillace A, Armentani E and Bellucci F. Stress corrosion cracking behavior of conventional and innovative aluminium alloys for aeronautic applications.
Surface and Interface Analysis. 2013; 45(10):1610-1618. http:// dx.doi.org/10.1002/sia.5234.
6. Lee CY, Lee WB, Kim JW, Choi DH, Yeon YM and Jung SB. Lap Joint Properties of FSWed Dissimilar Formed 5052Al and 6061Al Alloys with Different Thickness. Journal of Materials Science. 2008; 43(9):3296-3304. http://dx.doi.org/10.1007/ s10853-008-2525-1.
7. Chen HB, Yan K, Lin T, Chen SB, Jiang CY and Zhao Y. The Investigation of Typical Welding Defects for 5456 Aluminum Alloy Friction Stir Welds. Materials Science and Engineering A. 2006; 433(1-2):64-69. http://dx.doi.org/10.1016/j. msea.2006.06.056.
8. Mishra RS and Ma ZY. Friction Stir Welding and Processing.
Materials Science and Engineering R Reports. 2005; 50(1-2):1-78. http://dx.doi.org/10.1016/j.mser.2005.07.001.
9. Proton V, Alexis J, Andrieu E, Delfosse J, Lafont MC and Blanc C. Characterization and Understanding of the Corrosion Behavior of the Nugget in A 2050 Aluminum Alloy Friction StirWelding Joint. Corrosion Science. 2013; 73:130-142. http:// dx.doi.org/10.1016/j.corsci.2013.04.001.
10. Nandan R, Debroy T and Bhadeshia HKDH. Recent Advances in Friction-Stir Welding – Process, Weldment Structure and
Properties. Progress in Materials Science. 2008; 53(6):980-1023. http://dx.doi.org/10.1016/j.pmatsci.2008.05.001. 11. Paglia CS and Buchheit RG. A Look in the Corrosion of
Aluminum Alloy Friction Stir Welds. Scripta Materialia. 2 0 0 8 ; 5 8 ( 5 ) : 3 8 3 - 3 8 7 . h t t p : / / d x . d o i . o rg / 1 0 . 1 0 1 6 / j . scriptamat.2007.10.043.
12. Xu W and Liu J. Microstructure and Pitting Corrosion of Friction Stir Welded Joints in 2219-O Aluminum Alloy Thick Plate. Corrosion Science. 2009; 51(11):2743-2751. http:// dx.doi.org/10.1016/j.corsci.2009.07.004.
13. Xu W, Liu J and Zhu H. Pitting Corrosion of Friction Stirs Welded Aluminum Alloy Thick Plate in the Alkaline Chloride Solution. Electrochimica Acta. 2010; 55(8):2918-2923. http:// dx.doi.org/10.1016/j.electacta.2009.12.083.
14. American Society for Testing and Materials – ASTM. ASTM B0209M-04 Standard: Specification for Aluminum and Aluminum-Alloy Sheet and Plate. West Conshohocken: ASTM, 2005.
15. American Society of Materials – ASM. ASM Handbook: Corrosion, Vol. 13. ASM International Committee, 1987.
16. Fratini L and Buffa G. CDRX Modeling in Friction Stir Welding of Aluminum Alloys. International Journal of Machine Tools & Manufacture. 2005; 45(10):1188-1194. http://dx.doi. org/10.1016/j.ijmachtools.2004.12.001.
17. Arbegast WJ and Hartley PJ. In: Proceeding of the Fifth international conference on trends in Welding research; 1998. Pine Mountain: GA, 1998; p. 541.
18. Ren SR, Ma ZY and Chen LQ. Effect of Welding Parameters on Tensile Properties and Fracture Behavior of Friction Stir Welded Al-Mg-Si Alloy. Scripta Materialia. 2007; 56(1):69-72. http://dx.doi.org/10.1016/j.scriptamat.2006.08.054. 19. Hashimoto T, Jyogan S, Nakata K, Kim YG and Ushio M. In:
Proceeding of the First International symposium on friction stir welding; 1999. Thousand Oaks: CA, 1999.
20. Lee WB, Yeon YM and Jung SB. Mechanical Properties Related to Microstructural Variations of 6061 Al Alloy Joints by Friction Stir Welding. Materials Transactions. 2004; 45(5):1700-1705. http://dx.doi.org/10.2320/matertrans.45.1700.
22. Hariri MB, Shiri SG, Yaghoubinezhad Y and Rahvard MM. The Optimum Combination of Tool Rotation Rate and Traveling Speed for Obtaining the Preferable Corrosion Behavior and Mechanical Properties of Friction Stir Welded AA5052 Aluminum Alloy. Materials & Design. 2013; 50:620-634. http://dx.doi.org/10.1016/j.matdes.2013.03.027.
23. Hoseini M, Shahryari A, Omanovic S and Szpunar JA. Comparative Effect of Grain Size and Texture on the Corrosion Behavior of Commercially Pure Titanium Processed By Equal Channel Angular Pressing. Corrosion Science. 2009; 51(12):3064-3067. http://dx.doi.org/10.1016/j. corsci.2009.08.017.
24. Jariyaboon M, Davenport AJ, Ambat R, Connolly BJ, Williams SW and Price DA. The Effect of Welding Parameters on the Corrosion Behavior of Friction Stir Welded AA2024-T351.
Corrosion Science. 2007; 49(2):877-909. http://dx.doi. org/10.1016/j.corsci.2006.05.038.
25. Ralston KD, Birbilis N and Davies CHJ. Revealing the relationship between Grain Size and Corrosion Rate of Metals.
Scripta Materialia. 2010; 63(12):1201-1204. http://dx.doi. org/10.1016/j.scriptamat.2010.08.035.
26. Gharavi F, Matori KA, Yunus R and Othman NK. Corrosion Behavior of Friction Stir Welded Lap Joints of AA6061-T6 Aluminum Alloy. Materials Research. 2014; 17(3):672-681. http://dx.doi.org/10.1590/S1516-14392014005000053.
27. Ezuber H, El-Houd A and El-Shawesh F. A Study on the Corrosion Behavior of Aluminum Alloy in Seawater. Materials & Design. 2008; 29(4):801-805. http://dx.doi.org/10.1016/j. matdes.2007.01.021.
28. Aballe A, Bethencourt M, Botana FJ, Cano MJ and Marcos M. Influence of Cathodic Intermetallics Distribution on the Reproducibility of the Electrochemical Measurements on AA5083alloy in NaCl Solution. Corrosion Science. 2003; 45(1):161-180. http://dx.doi.org/10.1016/S0010-938X(02)00067-7.
29. Yasakau KA, Zheludkevich ML, Lamaka SV and Ferreira MGS. Role of Intermetallic Phases in Localized Corrosion of AA5083. Electrochimica Acta. 2007; 52(27):7651-7659. http:// dx.doi.org/10.1016/j.electacta.2006.12.072.
30. Badawy WA, Al-Kharafi FM and El-Azab AS. Electrochemical Behavior and Corrosion Inhibition of Al, Al-6061 and Al-Cu in Neutral Aqueous Solutions. Corrosion Science. 1999; 41(4):709-727. http://dx.doi.org/10.1016/S0010-938X(98)00145-0.
31. Lumsden JB, Mahoney MW, Pollock GA and Rhodes CG. Intergranular Corrosion Following Friction Stir Welding of Aluminum Alloy 7075-T65. Corrosion. 1999; 55(12):1127-1135. http://dx.doi.org/10.5006/1.3283950.
32. Guillaumin V and Mankowiski G. Localized Corrosion of 6056 T6 Aluminum Alloy in Chloride Media. Corrosion Science. 2000; 42(1):105-125. http://dx.doi.org/10.1016/ S0010-938X(99)00053-0.