ISSN 1546-9239
© 2012 Science Publications
Corresponding Author: Mahdieh Eisakhani, School of Social, Development and Environmental Studies,
Faculty of Social Sciences and Humanities, University Kebangsaan Malaysia, 43600 Bangi, Malaysia
Validation of MIKE 11 Model Simulated Data for
Biochemical and Chemical Oxygen Demands Transport
1
Mahdieh Eisakhani,
2Md. Pauzi Abdullah,
3
Othman Abd Karim and
4Amirhossein Malakahmad
1
School of Social, Development and Environmental Studies,
Faculty of Social Sciences and Humanities,
2
School of Chemical Sciences and Food Technology,
Faculty of Sciences and Technology,
3
School of Civil and Structural Engineering,
Faculty of Engineering and Built Environment,
University Kebangsaan Malaysia, 43600 Bangi, Malaysia
4
Department of Civil Engineering, Faculty of Engineering,
University Technology PETRONAS, 31750 Tronoh, Malaysia
Abstract: Problem statement: The aim of the study was to model the discharge, Biochemical and Chemical Oxygen Demands (BOD and COD) loads in each cross section of Bertam River in Cameron Highlands, Malaysia. Cameron Highlands form the headwater catchment for two major rivers of the lowlands; Pahang River and Perak River. On the other hand, Cameron Highlands is undergoing rapid development as a popular tourist destination and an area exploited for growing of temperature vegetables, fruits and flowers. It is also a mountainous area subjected to torrential tropical showers. The condition of Bertam River as one of the main rivers in Cameron Highlands has degraded over the years in terms of water pollution and river environment. Approach: Therefore, MIKE 11 a one-dimensional hydrodynamic simulation program was utilized to model stream flow transport and water quality processing in the river system. The model was used to generate the river outflow and simulate BOD and COD concentrations in each cross section of Bertam River. Hydrodynamic Module (HD) which uses an implicit, finite difference solver was applied to calculate water level and flow for the river. Next, Rainfall-Runoff Module (RR) which is include unit hydrograph method and lumped conceptual continuous hydrological model was used to combine the meteorological data of the study area to MIKE 11 simulation system. Finally, Advection-Dispersion Module (AD) was used for transported BOD and COD concentrations calculation. Results: Water quality results show the BOD5
varies from 1-2 mg L−1 during pre-monsoon and from 4-10 mg L−1 during post-monsoon. The COD between 39-49 mg L−1 was observed during High Water Flow (HWF). Much lower concentration was detected during Average Water Flow (AWF) which was between 10-14 mg L−1. The comparative analysis between measured and simulated data showed that MIKE 11 is able to predict sufficiently accurate BOD and COD loads at the catchment outlet especially during AWF. Conclusion: Due to higher discharge during HWF some differences between measured and predicted values were observed. Therefore, it is suggested that for better agreement at higher discharges the hydraulic model simulation to be conducted using more measured flow data and by application of more precise differential equation such as RKQC and RK4.
Key words: BOD and COD loads, MIKE 11 model, Bertam river, Cameron highlands
INTRODUCTION
Most major rivers in Peninsular Malaysia have their headwaters in the highlands and almost 90% of the
383 (Hashim and Rahaman, 2006). An estimated amount of 5.8 million liters a day is abstracted for drinking water supply at several intake points along rivers originating from the mountain forests of the Cameron Highlands.
Cameron Highlands are drained by eight rivers (only largest counted) with Bertam river, Telom river and Lemoi river, being the major ones; as well as Ringlet river, Habu river, Burong river, Tringkap river and Terla river WWF, 2001. These rivers drain eastwards into Pahang River (Hashim and Rahaman, 2006). Bertam river which drains the Northern part of the area is fed by the very constant source of clean water from mountain forests, even in dryer seasons (Kumaran and Ainuddin, 2004) and plays a vital role in fresh water supply, agricultural activities (irrigation) and as a source for hydroelectric power generation (Eisakhani and Malakahmad, 2009). Alternatively, pollution loads from agricultural activities, tourism and urban development which have been reported in previous studies (D’Silva et al., 2011; Hamzah et al., 2011) cause water quality deterioration of Bertam river. Therefore, the protection of river becomes a priority for decision makers and water quality of Bertam needs to be predicted appropriately by a comprehensive tool prior to any development in surrounding area.
Water quality models are utilized to simulate stormwater (EPA, 1997; VKI, 1994), surface and underground water pollution (Busteed et al., 2009), land use effects (Carpio and Fath, 2011) and wastewater treatment processes. These model components (like the underlying processes) can be very complex when simulating the cycle of pollutant build-up, wash-off and impact. Water quality models have similar components as hydrologic and hydraulic models and often require calibration to produce credible predictions (GSMM, 2003).
MIKE 11, which is developed by the Danish Hydraulic Institute (DHI), is a tool for modeling conditions in rivers, lakes, reservoirs, irrigation canals and other inland water systems. MIKE 11 consists of modules that allow users to specify the type of hydrologic process to simulate. It is a menu-driven model configured with a core module that includes a menu for data handling and program execution. The model includes modules to handle various data types. One of these modules is the water quality module, which is an extension of the transport-dispersion module and is utilized to simulate the reaction processes of multi compound systems and models a variety of biochemical interaction processes, including BOD and DO computations and simulations of nutrients, macrophytes and plankton. MIKE 11 requires hydrologic parameters, river cross sections, floodplain
topography, discharge and water level records, measured or simulated rainfall for the purpose of water quality modeling MIKE, 2007.
MATERIALS AND METHODS
Sampling procedures for BOD and COD measurements: Water samples were collected from mid-way between the surface and the river bed; disturbing as little bottom sediment as possible. The water samples with sediment from river bed disturbance were rejected. Sampling bottles were turned underwater into the current and were filled underwater completely, without air. Finally the labeled samples were placed in a cooler and transported to the laboratory. Both BOD and COD were determined according to APHA (Eaton and Franson, 2005).
MIKE 11 calibrations with secondary data: Secondary data was used to calibrate MIKE 11 system. The recovery capacity of rivers shows a strong dependence on seasonal changes (Adeogun et al., 2011). Two different period data were used; first Average Water Flow (AWF) data, during which the river runs with relatively stable water rates and riverbed erosion takes place delivering bonded compounds in the riverbed to the water stream; and second, High Water Flow (HWF) data, which is during rain or just after rain and the river is relatively unstable with rapidly increasing water rates with surface runoff of the surrounding land being added to the water stream. Then, the following steps were carried out.
Node points calculations: To achieve a stable solution in Hydrodynamic Module (HD) calculations, the time and node range was selected according to the following:
U. t Cr x ∆ << ∆
Where:
U = Velocity t = The time step x = The length interval Cr = Courant number
For transport dispersion module t and x was selected for Cr less than 1.
are dependent on other modules in a simulation and it is therefore required to have more modules selected (e.g., Selection of ECOLab, which will form the basis of the water quality simulation selects AD-model and HD-model also). Therefore for performing the water quality model first HD model and AD model were run. Water Quality modeling takes place through the ECO Lab model entry where BOD and COD as water quality parameters were selected from the ECO Lab templates.
Meteorological and hydrological data: Meteorological and hydrological data (Fig. 1) was included in the model to achieve the variations of water level and discharge in each time.
Fig. 1: Metrological data of Bertam river in MIKE 11
Fig. 2: Bertam river raw cross section information in MIKE 11
Fig. 3: Bertam River processed cross section information in MIKE 11
Cross sections: The Cross Section Editor managed stores and displayed all model cross section information. In MIKE 11 there are two types of cross section data; the raw survey data and the derived processeddata. The raw data describes the shape of the cross section and typically comes from a section survey of the river (Fig. 2). The processed data is derived from the raw data and contains all information used by the computer model (e.g., level, cross section area, flow width, hydraulic/resistance radius). The processed data could be calculated by the cross section editor or entered manually. In this research the processed data calculated by cross section editor (Fig. 3).
Boundary description: The boundary description explains the nature of the boundary. There are six different types of boundary description in MIKE 11 environment. The boundary type specifies the kind of data required for the boundary. For each boundary description there were a number of valid boundary types in the system. Once a boundary description was selected only the valid choices of boundary type could displayed. Specifying the boundary description was done based on the nature of project and case of study; therefore, Global, Structures and Closed type of boundary description was eliminated at the first place. The remaining was Open, Point source and Distributed source, which based on the available data “Distributed source” boundary description was selected.
Resistance numbers: In fact, the reason for selecting resistance numbers is to indicate how to deal with bed resistance factors. Initially “Uniform Transversal distribution” was selected which a single resistance number was applied throughout the cross section. Then, the resistance type was set as Manning’s n which the resistance number was specified as Manning’s n in the unit s/m1/3. Roughness coefficient is one of the important hydraulic items in MIKE 11 calibration procedure. Roughness coefficient depends on series of parameters such as length, concentration, distribution and species of existing flora in the area of study as well as size, shape and morphology of river bed. Site inspection was done and series of images and slides was taken in different part of upstream and downstream. Then the collected data was compared to those available as secondary data and finally the roughness coefficient of 0.03 was selected for the system.
385 Fig. 4: Accuracy rates of differential equations in MIKE 11
• RKQC (Fifth order Runge-Kutta with Quality Control)
• RK4 (Fourth order Runge-Kutta) • EULER (Euler or Linear Solution)
The accuracy (and the computing time) varies for the three mentioned integration routines. As shown in Fig. 4 the most accurate results will be calculated when using RKQC (Default routine). But the computing time can be reduced by using EULER. The Xenobiotics module explicitly handles most of the physical, chemical and biological processes that affect synthetic organic compounds, excluding reduction and precipitation dissolution.
RESULTS AND DISCUSSION
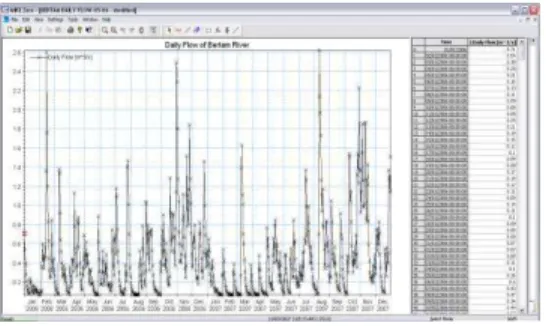
Meteorological and hydrological data: Based on the given meteorological data and also the information of cross sections in Bertam River, MIKE 11 was able to calculate the flow rate at each point. Figure 5 shows the comparisons between the measured and simulated flow rates at Robinson fall, Bertam river. The data was obtained from Gunung Berincang station. This station provides the most complete rainfall data that could be useful for long duration analysis. As shown in the figure the agreement between observed and simulated flow rate in some points is acceptable.
BOD and COD concentrations: The model was calibrated with BOD and COD secondary data. Then the measured values were compared with those simulated by MIKE 11. Naturally, occurring organic matter is present in low concentrations and consequently its oxidation gives rise to low BOD values (<1–2 mg L−1). Although the threshold value of BOD indicating pollution varies with effluent characteristics and environment, in the Bertam river, the BOD5 varies from 1-2 mg Lduring pre-monsoon and from 4-10 mg Lduring post-monsoon. The results during both AFW and HWF are in agreement with (Gandaseca et al., 2011). Desa et al. (2005) indicated that on the whole the average BOD5 is higher during post-monsoon compared to pre-monsoon values. As productivity is higher during monsoon season there will be an increase in dead organic matter in the water column, resulting in higher BOD.
Fig. 5: Comparison between measured and simulated monthly flow at Robinson fall
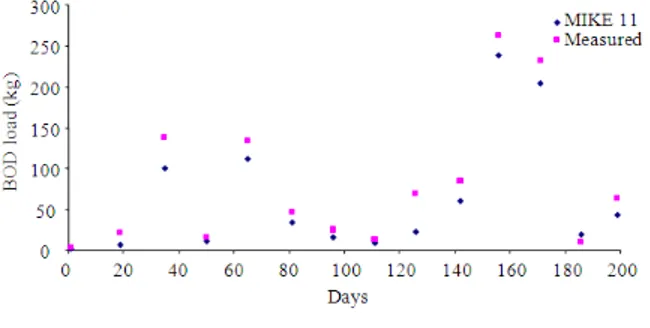
Fig. 6: Predicted and measured BOD load at the Bertam river
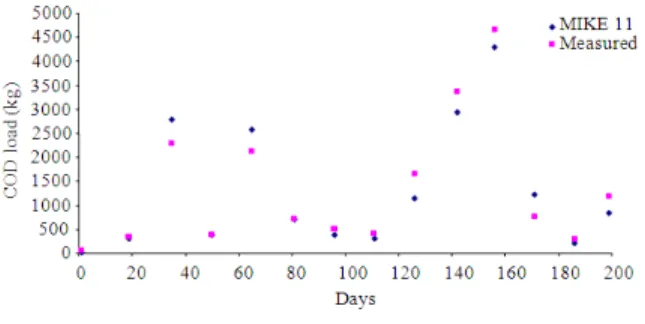
Therefore, an increase in BOD can be observed in the river during post monsoon compared to pre-monsoon season. Chemical Oxygen Demand (COD) was found to be high on some days. The COD between 39-49 mg L−1was observed during High Water Flow (HWF). On the other hand much lower concentrations were detected during Average Water Flow (AWF). The COD between 10-14 mg L−1was found during this period. This is in agreement with other researchers who have found COD less than 20 mg L-1 in rivers during AWF (Rosli et al. 2010). Overall, comparison between BOD and COD in both sampling moments (average and high water flow) shows water quality deterioration during high water flow. Therefore, it can be concluded that non-point sources of pollution have significant impacts on water quality of Bertam river. This confirms that selection of “Distributed source” as boundary descriptionin previous stage was appropriate and valid choice.
Fig. 7: Predicted and measured COD load at the Bertam river
The agreement between the measured and simulated BOD and COD loads are acceptable, especially during average water flow.At high loads due to greater discharge there are some differences between measured and predicted values. It indicates that for better agreement at higher discharge the hydraulic model should simulate with more measured flow data, which can provide better simulated hydraulic data as well as better water quality scenario prediction.The water quality modules in MIKE 11 consist of a set of coupled differential equations describing the relevant processes for water quality models. The equations in the software are based on 20 years of experience and numerous worldwide applications. However, there is an increasing demand for a more open and flexible system, where models can be customized to the specific study area. In addition, application of RKQC (Fifth order Runge-Kutta with Quality Control) or RK4 (Fourth order Runge-Kutta) could yield the better simulation at higher loads.
CONCLUSION
While the BOD was less than 10 mg L−1even during high water flow, COD was found high on some days, especially during high water flow. COD of up to 49 mg L−1was observed in HWF period. The results indicate that the agreement between the measured and simulated BOD and COD in MIKE 11 is acceptable. The comparison between predicted and measured BOD and COD loads shows the suitability of the model to be used as an accurate tool for future scenarios and developments, especially during average water flow.At high loads due to higher discharge there are some differences between measured and predicted values. It could be suggested that for better agreement at higher discharges the hydraulic model should be simulated with more measured flow data and more precise differential equation such as RKQC and RK4, which can provide better water quality scenario prediction.
REFERENCES
Adeogun, A.O., A.V. Chukwuka and O.R. Ibor, 2011. Impact of abattoir and saw-mill effluents on water quality of upper ogun river (Abeokuta). Am. J. Environ. Sci., 7: 525-530. DOI: 10.3844/ajessp.2011.525.530
Busteed, P.R., D.E. Storm, M.J. White and S.H. Stoodley, 2009. Using SWAT to target critical source sediment and phosphorus areas in the Wister Lake Basin, USA. Am. J. Environ. Sci., 5: 156-163. DOI: 10.3844/ajessp.2009.156.163
Carpio, O.V. and B.D. Fath, 2011. Assessing the environmental impacts of urban growth using land use/land cover, water quality and health indicators: A case study of Arequipa, Peru. Am. J. Environ. Sci., 7: 90-101. DOI: 10.3844/ajessp.2011.90.101 D’Silva, J.L., N. Man, H.A.M. Shaffril and B.A.
Samah, 2011. Acceptance of sustainable agricultural practices: The case of crop farmers. Am. J. Agric. Biol. Sci., 6: 227-230. DOI: 10.3844/ajabssp.2011.227.230
Desa, E., M.D. Zingde, P. Vethamony, M.T. Babu and S.N. D’Sousa et al., 2005. Dissolved oxygen-a target indicator in determining use of the Gulf of Kachchh waters. Marine Pollut. Bull. , 50: 73-79. DOI: 10.1016/j.marpolbul.2004.08.014
Eaton, A.D. and M.A.H. Franson, 2005. Standard Methods for the Examination of Water and Wastewater. 21st Edn., American Public Health Association, Washington, DC., ISBN: 0875530478. Eisakhani, M. and A. Malakahmad, 2009. Water quality
assessment of Bertam river and its tributaries in Cameron Highlands, Malaysia. World Applied Sci. J., 7: 769-776.
Ent, A.V.D. and C. Termeer, 2005. Study on river water quality of the Upper Bertam catchment. Saxion University.
EPA, 1997. Volunteer stream monitoring: A methods manual. Environmental Protection Agency. Gandaseca, S., N. Rosli, J. Ngayop and C.I. Arianto,
2011. Status of water quality based on the physico-chemical assessment on river water at wildlife sanctuary sibuti mangrove forest, Miri Sarawak. Am. J. Environ. Sci., 7: 269-275. DOI: 10.3844/ajessp.2011.269.275
387 Hamzah, Z., S.D. Riduan and A. Saat, 2011.
Determination of sediment profile for 210Pb, Pb, U and Th from Sultan Abu Bakar Dam Due to soil erosion from highland agriculture area, Cameron Highlands, Malaysia. Am. J. Environ. Sci., 7: 263-268. DOI: 10.3844/ajessp.2011.263.268
Hashim, A. and G.M. Rahaman, 2006. Soil erosion and water pollution in Cameron Highlands: conservation strategies. Malaysian Agricultural Research and Development Institute.
Kumaran, S. and A.N. Ainuddin, 2004. Forests, water and climate of cameron highland. University Putra Malaysia.