GEOGRAPHIA
NAPOCENSIS
AN.
VII,
nr. 2/2013
geographianapocensis.acad-cluj.ro
USING VARIOUS VISUALIZATION TECHNIQUES
TO OUTLINE VULNERABILITY TO DROUGHT
IN THE REPUBLIC OF MOLDOVA
CONSTAN A BORONEAN 1,VERA POTOP2,MIHAELA CAIAN3,JOSEF SOUKUP2
Abstract: - Using visualization techniques to outline vulnerability to drought in the Republic of Moldova. This paper is a demonstration of use of various visualization techniques in representing the results on vulnerability to drought at various times scales in the Republic of Moldova. Monthly precipitation totals from simulated data at 10 km horizontal resolution with a regional climatic model RegCM, CRU TS2.10 land observation data set at 0.5ºx0.5º horizontal resolution and observations recorded at 15 meteorological stations in Moldova were used to compare the annual cycle of precipitation, seasonal variability of precipitation, and the spatial and temporal evolution of drought.
The Empirical Orthogonal Functions (EOF) analysis was used to identify the principal modes of seasonal variability of precipitation over the country and the Standardized Precipitation Index (SPI) was calculated as an indicator of drought or wetness at various time scales (1 to 24 months). The period of analysis was 1960-1997.
One of the visualization techniques was the Grid Analysis and Display System (GrADS) which is an easy manipulation and visualization tool for gridded and station meteorological data. We used it to represent the RegCM and CRU data on their grids. The kriging interpolation with a Gaussian model variance was selected as a suitable interpolation tool for the spatial distribution of the SPI and EOF over Moldova. For temporal diagram and mapping, Golden Software Surfer 9.0 and ArcGis Software 9.1 were used. The results presented with these visualization tools emphasize precipitation and drought characteristics over Moldova domain.
Key-Words: ArcGIS, Surfer, GrADS, drought, SPI, Republic of Moldova
1. Introduction
Drought is a recurring extreme climate event over land characterized by below-normal precipitation over a period of months to years. It is defined as a dry spell relative to its local
normal condition. Drought is often assessed in terms of meteorological, agricultural, hydrological, and socio-economic impacts. Large areas of Europe including Republic of Moldova have been affected by drought durin g the 20th century. Recent severe and prolonged droughts have highlighted Europe’s vulnerability to this natural hazard and alerted the public, governments, and operational agencies about many socio-economic problems accompanying water shortage and to the need for drought
mitigation measures.
The Republic of Moldova is among the eastern European countries affected by extreme drought. The changes of temperature/ precipitation ratio over the year shows that although Moldova’s baseline climate only for the end of summer and the beginning of autumn were characterized as semiarid, it is likely that in the future there would be significantly longer and deeper dry spells. In particular, according to the results of six General Circulation Model experiments based on A2 and B2 SRES scenarios, Moldova will face warmer and wetter winters and hotter and drier summers and autumns. The projected annual decrease of precipitation in association with increase of
1
Centre for Climate Change, Geography Department, University Rovira I Virgili, Tortosa, Spain, [email protected]
2
Czech University of Life Sciences Prague, Department of Agroecology and Biometeorology, Prague, Czech Republic, [email protected]
3
GEOGRAPHIA
NAPOCENSIS
AN.
VII,
nr. 2/2013
geographianapocensis.acad-cluj.ro
temperature would likely stimulate stronghumidity deficit inducing droughts (Corobov and Overcenco, 2007). Precipitation is the primary factor controlling the formation and persistence of drought conditions, but evapotranspiration is also an important variable.
In the present study, the Standardized Precipitation Index (SPI), originally developed by McKee et al. (1993) was adopted to assess the drought characteristics in the Republic of Moldova based on regional climate model (RegCM) simulations which were compared with station and CRU observation data sets.
It is well recognized that Global Circulation Models (GCMs) can reproduce reasonably well climate features on large scales (global and continental) but their accuracy decreases when proceeding from continental to regional and local scales because of the lack of resolution (Meehl et al., 2007). This is especially true for surface fields, such as precipitation and surface air temperature, which are critically affected by topography and land use. However, in many applications, particularly related to the assessment of climate-change impacts, the information on surface climate change at regional to local scale is fundamental.
One alternative to bridge the gap between the climate information provided by GCMs and that needed in impact studies is nesting of a fine scale limited area model (or Regional Climate Model, RCM) within the GCM. Such an approach have been used in the framework of the EU-project CECILIA (Central and Eastern Europe Climate Change Impact and Vulnerability Assessment). The regional climatic model ICTP_RegCM3 centered over Romania and including the Republic of Moldavia was run at a horizontal resolution of 10 km for the current climate (19601-1990) and under SRES A1B scenario for 2021-2050 and 2071-2100 periods (Halenka, 2010, Boroneant et al., 2011).
In this paper RegCM3 simulations were compared with observations at 15 meteorological stations in Moldova and gridded CRU TS2.10 land observation data set in order
to characterize seasonal precipitation variability and drought characteristics in terms of temporal evolution and spatial distribution over the Republic of Moldova. Appropriate manipulation and visualization techniques like Grid Analysis and Display System (GrADS), Golden Software Surfer8 and ArcGis Software 9.1 (ArcMap and ArcCatalog) were used for representing the results.
2. Data and Methods
2.1 DataMonthly precipitation totals simulated with the Beta version of the regional climatic model ICTP_RegCM3 at a horizontal resolution of 10 km have been used. The ICTP_RegCM model was originally developed (Giorgi et al, 1993) and then augmented and used in various reference and scenario simulations (Giorgi et al., 1994a, 1994b; Pal et al., 2004).
The RegCM simulations conducted in CECILIA-FP6 Project covered a domain (41.016ºN-50.175ºN; 14.095ºE-36.192ºE) centered over Romania (46ºN, 25ºE) (Boroneant et al, 2009; Boroneant et al, 2011; Halenka, 2010). The simulations were driven by ERA40 Reanalysis double nested from 25 km RegCM run for the period 1960-1997. For this study a domain centered over Republic of Moldova (45.01ºN-49.01ºN; 26.52ºE-30.48ºE) was considered [Fig. 1]. The domain contains 8010 grid points (90 lat x 89 lon). The topography of the RegCM represented with GrADS [Fig. 1a] and the real topography of the terrain and station distribution represented with ArcGIS [Fig1b] point out on the differences in altitude between the RegCM and reality. The observation data used to compare the results with RegCM simulations were the CRU TS2.10
data set (http://www.cru.uea.ac.uk/cru/data/hrg/cru_ts_2
GEOGRAPHIA
NAPOCENSIS
AN.
VII,
nr. 2/2013
geographianapocensis.acad-cluj.ro
a) b)
Fig. 1 The topography of the RegCM represented with GrADS (a) and the real topography of the terrain and station distribution represented with ArcGIS (b).
2.2 Methods
2.2.1 EOF Analysis
To identify the principal modes of variability of seasonal precipitation over the territory of the Republic of Moldova the Empirical Orthogonal Functions (EOF) analysis (Preisendorfer 1988, von Storch 1995) has been performed. EOF techniques aims at finding a new set of variables that captures most of the observed variance from data through a linear combination of the original variables allowing such a convenient method for studying the spatial and temporal variability of the time series in a given domain. This method splits the temporal variance of data into orthogonal patterns called empirical eigenvectors. The EOF analysis was performed with the series of seasonal precipitation totals of gridded RegCM and CRU data sets and at 15 stations. The EOFs were calculated on detrended and standardized anomalies.
2.2.2 SPI
Drought was analyzed using the SPI (McKee et al. 1993, 1995) which has been considered the most reliable index for quantifying the intensity, duration and spatial
extent of drought on multiple time scales (Lloyd-Hughes and Saunders, 2002). It is an excellent tool for research on spatial analysis, since it removes the temporal effects of various precipitation magnitudes. The SPI is computed by fitting a probability density function to the frequency distribution of precipitation summed over the time scale of interest. Each probability density function is then transformed into a standardized normal distribution and the anomaly strength is classified into 7 categories [Table 1.]. The SPI was calculated at time scales from 1 to 24-months. At these time scales it is relevant to describe drought conditions for a range of meteorological, agricultural and hydrological applications and also socio-economic impact.
2.2.3 Visualization techniques
GEOGRAPHIA
NAPOCENSIS
AN.
VII,
nr. 2/2013
geographianapocensis.acad-cluj.ro
(http://www.iges.org/grads/). It was used torepresent the RegCM simulations and results on gridded data.
Geostatistical methods allow the spatial interpolation of meteorological data in relationship with topographic attributes. The basic tool of geostatistics and kriging is the semivariogram, which describes the spatial dependence between the estimation points and the measurement points in a function of distance. Kriging is a very flexible geostatistical gridding method. This method produces maps from irregularly spaced data. Surfer includes two kriging types: point and block kriging. Both point kriging and block kriging generate an interpolated grid. Block kriging estimates the average value of the rectangular blocks centred on the grid nodes. Since block kriging is estimating the average value of block, it generates smoother contours. Furthermore, since block kriging is not estimating the value at a point, it is not a perfect interpolator. Point kriging estimates the values of the points at the grid nodes. Thereby, in this study ordinary point kriging has been applied. An important component of the kriging gridding method is the variogram. The ordinary kriging interpolation with a Gaussian variogram was selected as a suitable interpolation tool for the spatial distribution of the SPI and EOF over Moldova.
For 3D-diagram and contouring mapping, Golden Software 8.0 and ArcGis Software 9.1 have been used.
Tab. 1. Drought classification by SPI value and corresponding event probabilities
Class no
Category SPI value Probability%
1 Extremely dry ≤ -2.00 2.3
2 Severely dry -1.50 to -1.99 4.4 3 Moderately dry -1.00 to -1.49 9.2
4 Near Normal -0.99 to
+0.99
68.2
5 Moderately wet +1.00 to +1.49
9.2
6 Severely wet +1.50 to +1.99
4.4
7 Extremely wet ≥ +2.00 2.3
3. Results and Discussions
3.1 Model validationThe 30-year monthly means of precipitation totals simulated by RegCM forced by ERA40, CRU observations and station observations were calculated for the period 1961-1990 in each grid point of corresponding data set, and at station locations.
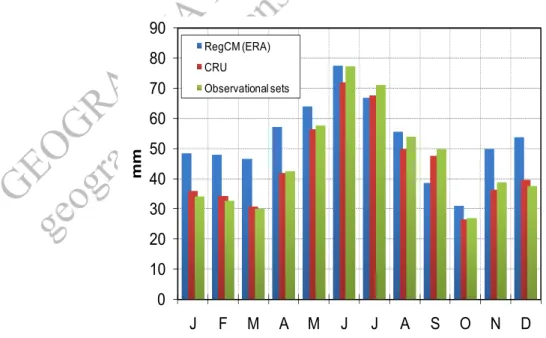
Fig. 2 Annual cycle of precipitation based on RegCM (ERA) simulations, CRU and observation datasets for the reference period 1961-1990.
0 10 20 30 40 50 60 70 80 90
J F M A M J J A S O N D
mm
RegCM (ERA)
CRU
GEOGRAPHIA
NAPOCENSIS
AN.
VII,
nr. 2/2013
geographianapocensis.acad-cluj.ro
Then, these means were spatially averaged andcompared. The results show that the model systematically overestimates precipitation compared to CRU and station observations [Fig. 2]. The largest magnitudes of RegCM (ERA40) precipitation errors are observed in late spring (April, May) and summer months (June, July, August). This drawback is transferred to SPI which is based only on precipitation.
3.2 EOF analysis of seasonal precipitation
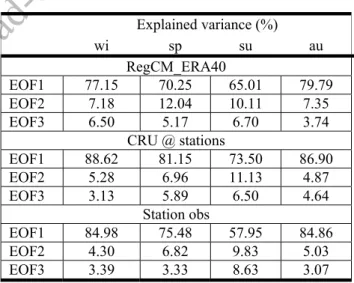
In order to identify the principal modes of variability of seasonal precipitation totals over Moldova domain, the EOF analysis was performed on RegCM simulated data, CRU and station observations. The explained variance of the EOF1 of seasonal precipitation totals ranges between 65 and 79.8% for RegCM simulated data, between 73.5 and 88.6% for CRU observations and between 56 and 85% for station observation, respectively [Table 2]. The least variance is explained during summer and the most variance is explained during winter for both CRU and stations observations and, during autumn for RegCM simulations. The explained variance of the EOF2 ranges between 7.2 and 12% for RegCM simulations and between 4.3 and 11% for observations. The least explained variance for the EOF2 is during winter for simulated precipitation and station observations while the most explained variance of EOF2 is shown during spring for simulated precipitation and during summer for both CRU and station observation data. The explained variance of the EOF3 ranges between 3.7 and 6.7% for RegCM simulations and between 3 and 8.6% for observations.
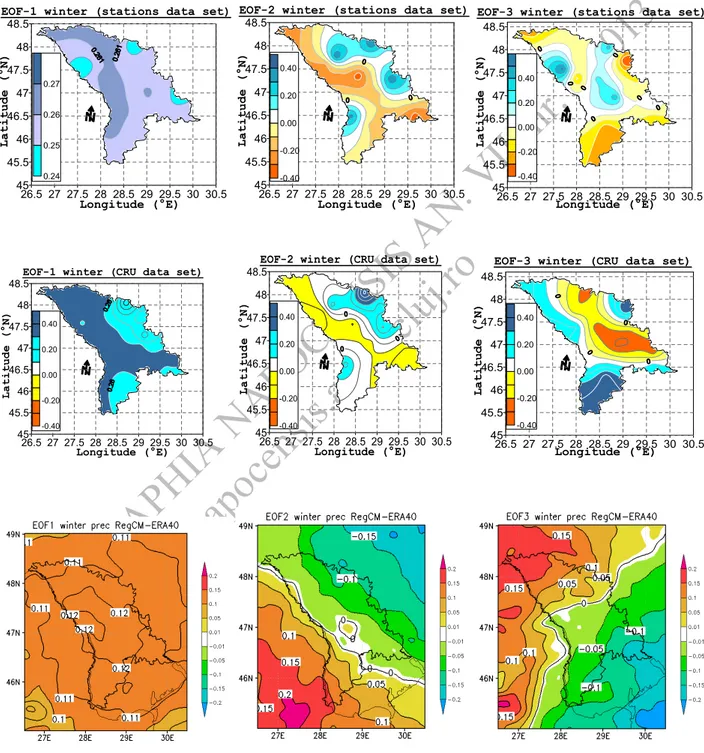
Because the patterns of the three leading EOFs do not differ essentially from season to season, only the loading patterns for winter precipitation totals are shown, as example, in Fig. 3. In the upper row are represented the leading EOFs of winter precipitation totals for station data, in the second row for CRU data and on the bottom row for RegCM forced by ERA40 simulated data. The patterns of EOF1 for the three data sets are presented in the left
hand column of Fig. 3. The spatial coefficients have the same sign over Moldova domain, the simulated data showing lower values of the loading than the observations. The distribution over the country’s territory of the spatial coefficients of the EOF2 roughly separates the eastern and western halves of country territory [Fig. 3 middle column] while for the EOF3 the southern most region has opposite sign of loading compared to the rest of the country [Fig. 3, right hand side column]. These spatial characteristics of the leading EOFs loadings point out on various driving factors for seasonal variability of precipitation totals in Republic of Moldova: large scale circulation, continentality, Black Sea and Mediterranean influences.
The EOF patterns of winter precipitation for both CRU and station data were produced with the Golden Software Surfer 8.0 while for simulated data with GrADS2.0.a9.
Tab. 2. The explained variance of the first three EOFs of seasonal precipitation
Explained variance (%)
wi sp su au RegCM_ERA40
EOF1 77.15 70.25 65.01 79.79
EOF2 7.18 12.04 10.11 7.35
EOF3 6.50 5.17 6.70 3.74 CRU @ stations
EOF1 88.62 81.15 73.50 86.90 EOF2 5.28 6.96 11.13 4.87 EOF3 3.13 5.89 6.50 4.64
Station obs
EOF1 84.98 75.48 57.95 84.86 EOF2 4.30 6.82 9.83 5.03 EOF3 3.39 3.33 8.63 3.07
3.3 Drought persistence
GEOGRAPHIA
NAPOCENSIS
AN.
VII,
nr. 2/2013
geographianapocensis.acad-cluj.ro
from 1 to 24-months. Then, the resulted SPI at8010 grid points for RegCM simulation, at 100 grid points for CRU observation, respectively, and at 15 stations were averaged to get an aggregated SPI at country level for each accumulated period. To aggregate all times
scales of SPI from 1 to 24 months into the diagrams of Fig. 4 the Golden Software Surfer 8.0 was used. Each diagram contains a large volume of information for SPI (12 months x 38 years x 24 SPI time scales).
Longitude (°E) Lati tu d e (°N)
EOF-1 winter (stations data set)
26.5 27 27.5 28 28.5 29 29.5 30 30.5 45 45.5 46 46.5 47 47.5 48 48.5 0.24 0.25 0.26 0.27 Longitude (°E) Lat itu d e (°N)
EOF-2 winter (stations data set)
26.5 27 27.5 28 28.5 29 29.5 30 30.5 45 45.5 46 46.5 47 47.5 48 48.5 -0.40 -0.20 0.00 0.20 0.40 Longitude (°E) La ti tu d e (° N)
EOF-3 winter (stations data set)
26.5 27 27.5 28 28.5 29 29.5 30 30.5 45 45.5 46 46.5 47 47.5 48 48.5 -0.40 -0.20 0.00 0.20 0.40 Longitude (°E) La ti tu d e (° N)
EOF-1 winter (CRU data set)
26.5 27 27.5 28 28.5 29 29.5 30 30.5 45 45.5 46 46.5 47 47.5 48 48.5 -0.40 -0.20 0.00 0.20 0.40 Longitude (°E) La ti tu de ( °N )
EOF-2 winter (CRU data set)
26.5 27 27.5 28 28.5 29 29.5 30 30.5 45 45.5 46 46.5 47 47.5 48 48.5 -0.40 -0.20 0.00 0.20 0.40 Longitude (°E) La tit ud e ( °N )
EOF-3 winter (CRU data set)
26.5 27 27.5 28 28.5 29 29.5 30 30.5 45 45.5 46 46.5 47 47.5 48 48.5 -0.40 -0.20 0.00 0.20 0.40
GEOGRAPHIA
NAPOCENSIS
AN.
VII,
nr. 2/2013
geographianapocensis.acad-cluj.ro
1980
1960
1970
1990
4
8
16
12
20
24
SPI a
t time-scales
extreme drought
severe drought
moderate
drought normal
moderate wet
severe wet
extreme wet Moldova domain: 45.01°N - 49.01°N 26.52°E - 30.48°E
Minimum:-2.222; 25%-tile:-0.586; Median: -0.065; 75%-tile:0.562; Maximum: 2.417
SPI at 1 to 24-month by 15 station observations data set
1980
1960
1970
1990
4
8
16
12
20
24
SPI at time-scales
extreme drought
severe drought
moderate
drought normal
moderate wet
severe wet
extreme wet
Moldova domain: 45.01°N - 49.01°N 26.52°E - 30.48°E
Minimum:-1.935; 25%-tile:-0.461; Median: -0.022; 75%-tile: 0.416; Maximum: 2.517
SPI at 1 to 24-month by CRU TS2.1 data (0.5°lat x 0.5°lon)
1980
1960
1970
1990
4
8
16
12
20
24
SP
I at ti
me-scal
es
extreme drought
severe drought
moderate
drought normal
moderate wet
severe wet
extreme wet Moldova domain: 45.01°N - 49.01°N 26.52°E - 30.48°E
Minimum:-2.264; 25%-tile:-0.585; Median:-0.075; 75%-tile:0.487; Maximum: 2.266
SPI at 1 to 24-month by RegCM simulations (forced by ERA40 data)
GEOGRAPHIA
NAPOCENSIS
AN.
VII,
nr. 2/2013
geographianapocensis.acad-cluj.ro
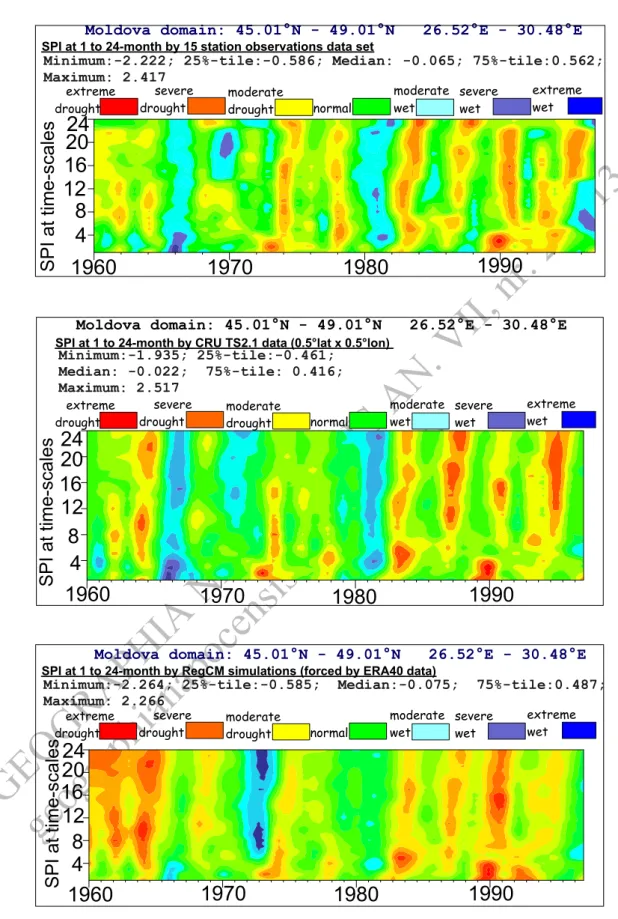
The temporal evolution of dry and wetconditions for Moldova domain was represented [Fig. 4] at 15 station observations (top), CRU observations (middle) and RegCM simulations. Each diagram shows an aggregated picture of the evolution of moisture characteristics quantified by SPI pointing out on the development of drought from one month to 24 months. The persistence of drought at these time scales is relevant for a range of meteorological, agricultural and hydrological applications and also for socio-economic impact studies. The RegCM captures the main characteristics of droughts identified both in CRU and station observations. According to SPI values characterizing categories of dry and wet conditions [Table 1] the periods of drought in the Republic of Moldova were 1962-1965, 1972-1974, 1977-1978, 1985-1986, 1990-1992 and 1996 while the periods with wet conditions were 1966-1967, 1970-1971 and 1981-1982. All these periods were identified both in the simulations and observations. It is evident that drought conditions have noticeable increased in the country with drought duration gaining in persistence during the period 1960-1997 (Potop, 2011). Fig. 4 also shows the evolution and persistence of an individual drought pointing out on the lack of precipitation which characterizes these periods and on its large scale driving factors. The Golden Software Surfer technique turned out to be the most appropriate tool to represent an integrated image of the evolution and persistence of dry and wet conditions based of SPI values calculated for 1 to 24 months accumulation periods over Republic of Moldova.
3.4 Temporal evolution
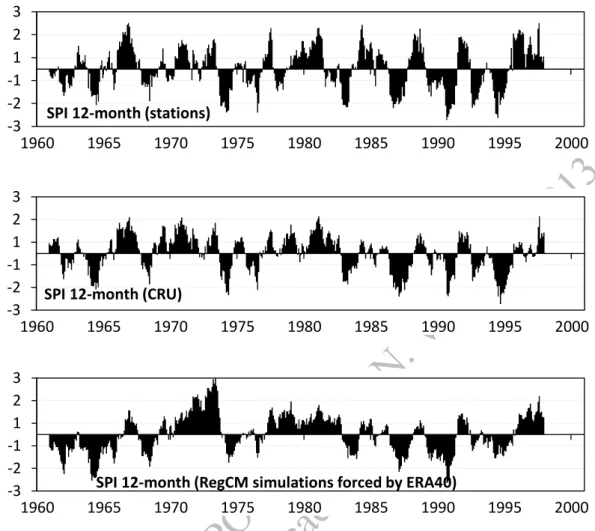
As the time scale for calculation the SPI increases from 1 to 24 months the wet and dry conditions can be clearly identified as well as their persistence. The antecedent conditions in SPI calculation for 12-month accumulation period point out on the persistence of dry and wet conditions for time lengths of some years. The temporal evolutions of the averaged SPI calculated at 12-month accumulation period for station (top) and CRU observations (middle)
and RegCM simulations (bottom) for Moldova domain are represented in Fig. 5. When compared with the observations, the model does quite well in identifying the major dry and wet periods and their persistence. The main dry periods identified in the simulations are 1961-1965, 1968-1969, 1974-1975, 1983-1984, 1986-1987, 1989-1990, 1993-1995. These periods are also identified in the observations with similar or more severe category of dryness. The wet periods identified in the simulation are 1966-1967, 1970-1973, 1977-1982, and 1996-1997. Most of these periods are also identified in the observations but the severity of wetness is higher in the simulation than in the observations due to the drawback of the RegCM model to generally overestimate precipitation [Fig. 2].
3.5 Case study – Severe drought of 1986
GEOGRAPHIA
NAPOCENSIS
AN.
VII,
nr. 2/2013
geographianapocensis.acad-cluj.ro
-3 -2 -1 1 2 3
1960 1965 1970 1975 1980 1985 1990 1995 2000
SPI 12-month (stations)
-3 -2 -1 1 2 3
1960 1965 1970 1975 1980 1985 1990 1995 2000
SPI 12-month (CRU)
-3 -2 -1 1 2 3
1960 1965 1970 1975 1980 1985 1990 1995 2000
SPI 12-month (RegCM simulations forced by ERA40)
Fig. 5 Temporal evolution of averaged SPI at 12 month accumulation period over Moldova domain at 15 stations (top), CRU grid points (middle), and RegCM grid points (bottom)
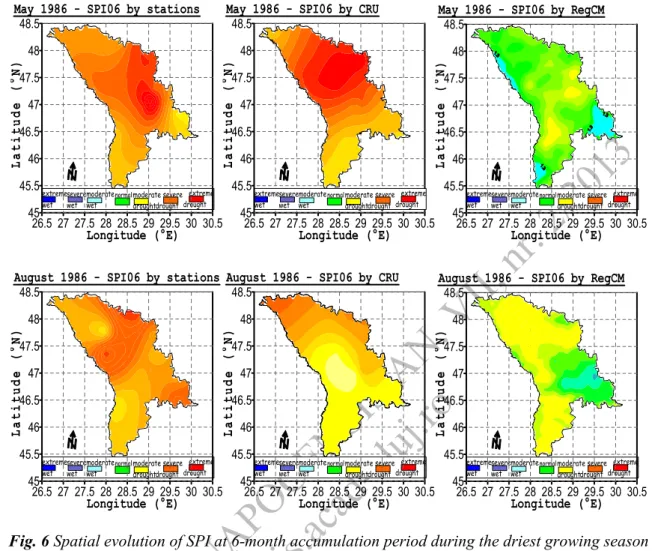
According to SPI06 values and its categories [Table 1] the drought of May 1986 based on station observations was characterized as severe in most of the regions and extreme in the eastern half of country. Based on CRU observations, the drought was severe and extreme, but the area with extreme drought is larger than that resulted from station observations. Compared to both observation data sets (station and CRU) it is obvious that the model can not capture the severity of drought [Fig. 6 top row]. This is because as shown above [Fig. 2] the model overestimates precipitation which is the main factor to characterize drought with SPI. Similarly, for August 1986 [Fig. 6 bottom row] based on station observation the drought was severe and extreme over the whole country, moderate in the southern half, severe and extreme in the northern half of the country based on CRU data, and
moderate in the north and the south and normal moisture conditions in the south-east of the country based on RegCM simulation. This result is again a consequence of model overestimation of precipitation. These results should be taken into consideration when the RegCM is used in assessing the current and projected vulnerability to drought in Republic of Moldova.
4. Summary and Conclusions
− Various visualization techniques have been used to characterize domain topography, seasonal precipitation variability, spatial and temporal evolution of drought for various accumulation periods ranging from 1 to 24 months.
GEOGRAPHIA
NAPOCENSIS
AN.
VII,
nr. 2/2013
geographianapocensis.acad-cluj.ro
Longitude (°E) La t it ude ( ° N)May 1986 - SPI06 by stations
normal moderate wet severe wet extreme wet moderate drought severe drought extreme drought
26.5 27 27.5 28 28.5 29 29.5 30 30.5 45 45.5 46 46.5 47 47.5 48 48.5
26.5 27 27.5 28 28.5 29 29.5 30 30.5 45 45.5 46 46.5 47 47.5 48 48.5 Longitude (°E) La t it ude ( ° N)
May 1986 - SPI06 by CRU
normal moderate wet severe wet extreme wet moderate drought severe drought extreme drought Longitude (°E) La titude ( ° N)
May 1986 - SPI06 by RegCM
normal moderate wet severe wet extreme wet moderate drought severe drought extreme drought 26.5 27 27.5 28 28.5 29 29.5 30 30.5 45 45.5 46 46.5 47 47.5 48 48.5 Longitude (°E) La t it ude ( ° N)
August 1986 - SPI06 by stations
normal moderate wet severe wet extreme wet moderate drought severe drought extreme drought
26.5 27 27.5 28 28.5 29 29.5 30 30.5 45 45.5 46 46.5 47 47.5 48 48.5 Longitude (°E) La t it ude ( ° N)
August 1986 - SPI06 by CRU
normal moderate wet severe wet extreme wet moderate drought severe drought extreme drought
26.5 27 27.5 28 28.5 29 29.5 30 30.5 45 45.5 46 46.5 47 47.5 48 48.5 Longitude (°E) Latit ude ( ° N)
August 1986 - SPI06 by RegCM
normal moderate wet severe wet extreme wet moderate drought severe drought extreme drought 26.5 27 27.5 28 28.5 29 29.5 30 30.5 45 45.5 46 46.5 47 47.5 48 48.5
Fig. 6 Spatial evolution of SPI at 6-month accumulation period during the driest growing season (April-September) of 1986 over Moldova domain at 15 stations (left), CRU grid points (middle),
and RegCM grid points (right).
− Two observation data sets (15 stations and CRU data set) were used to compare the RegCM ability to reproduce the annual cycle of precipitation, seasonal variability of precipitation, spatial and temporal evolution of drought based on SPI calculated for 1 to 24 accumulation periods.
− The results show that the model overestimates precipitation and this drawback is transferred to SPI which turn out to show less intense droughts than the observations.
− However, the model capture the general characteristics of precipitation and drought in terms of spatial and temporal distribution and, with due uncertainty, it can be used for vulnerability to drought assessments for the Republic of Moldova.
Acknowledgements: The RegCM simulations
have been produced in the NMA-Romania in the framework of CECILIA – EU-FP6 Project, Contract 037005 GOCE/2006. The work of Czech co-author was financially supported by S grant of MSMT CR and project 6046070901 from the Ministry of Education, Youth and Sports of the Czech Republic.
References
[1] BORONEAN C., CAIAN M., BOBERG F., ENCULESCU A. and MATEI M. (2009),
GEOGRAPHIA
NAPOCENSIS
AN.
VII,
nr. 2/2013
geographianapocensis.acad-cluj.ro
[2] BORONEAN , C., POTOP, V., CAIAN, M.,(2011), Validation of RegCM precipitation simulation over Republic of Moldova: Application for Standard Precipitation indices calculated for the period 1960-1997. In:Šiška, B. et al.: Bioklimate: Source and Limit of Social Development, Topolčianky, 6th-9th September 2011.
[3] CONSTANTINOV, T., POTOP, V., (2009),
Manifestarea fenomenelor de uscaciune si seceta in Republica Moldova. Chisinau, Mediul Ambiant, 64pp. (in Romanian)
[4] COROBOV R. and OVERCENCO A., (2007)
Use of climate modeling outputs for regionalization of global climate projections.
In: Problems of ecological monitoring and ecosystem modeling, Vol. XXI, St.Petersburg Gidrometeoizdat, Russian Federation, pp. 123-145.
[5] EUROPEAN ENVIRONMENTAL
AGENCY, (2001), Sustainable water use in Europe, Part 3: Extreme hydrological events: floods and droughts. Environmental Issue Report No. 21.
[6] GIORGI F, BI X and PAL J. S. (2004a),
Means, trends and interannual variability in a regional climate change experiment over Europe. Part I: present day climate (1961– 1990). Clim Dyn (22), pp 733–756.
[7] GIORGI F, BI X and PAL J. S. (2004b),
Means, trends and interannual variability in a regional climate change experiment over Europe. Part II: future climate scenarios (2071–2100). Clim Dyn (23), pp 839–858. [8] GIORGI, F., MARINUCCI, M.R. and
BATES, G.T. (1993), Development of a second generation regional climate model (RegCM2). Part I: Boundary layer and radiative transfer processes. Mon. Wea. Rev., 121, 2794-2813
[9] HALENKA, T., (2010), Cecilia – EC FP6 Project on the Assessment of Climate Change Impacts in Central and Eastern Europe, in Global Environmental Change: Challenges to Science and Society in Southeastern Europe, SpringerLink, 2010, Part 3, 125-137, DOI: 10.1007/978-90-481-8695-2_11
[10] LLOYD-HUGHES B., and SAUNDERS, M. A., (2002), A drought climatology for Europe, Int. J. Climatol. 22: 1571–1592
[11] McKEE TB, DOESKEN NJ, KLEIST J, (1993), The relationship of drought frequency and duration to time scales. Preprints Eighth Conf on Applied Climatology Anaheim CA. Amer Meteor Soc, pp 179–184
[12] McKEE TB, DOESKEN NJ, KLEIST J., (1995), Drought monitoring with multiple time scales. Proceedings of the Ninth Conference on Applied Climatology. Amer Meteor Soc Boston, pp 233–236
[13] MEEHL G. A., STOCKER T. F., COLLINS W. D., FRIEDLINGSTEIN P., GAYE A. T., GREGORY J. M., KITCH A., KNUTTI R., MURPHY J. M., NODA A., RAPER S. C. B., WATTERSON I. G., WEAVER A. J. AND ZHAO Z-C. (2007), Global climate projections. In Climate Change 2007: The Physical Science Basis. Contribution of Working Group I to the Fourth Assessment Report of the Intergovernmental Panel on Climate Change Program. Cambridge, UK/New York, USA: Cambridge University Press; pp 747-846.
[14] PAL J. S., GIORGI F. and BI X. (2004),
Consistency of recent European summer precipitation trends and extremes with future regional climate projections. Geophysical Research Letters, (31), L13202, doi:10.1029/2004GL019836.
[15] POTOP V., BORONEANT C., CAIAN M., (2012), Model validation and drought assessment with a regional climate model over Moldova. Scientia Agriculturae Bohemica, 42 (4) (in print)
[16] POTOP, V. (2011), Evolution of drought severity and its impact of corn in the Republic of Moldova. Theor Appl Climatol. 105 (3) 469–483.
[17] POTOP, V. OVERCENCO, A.
BORONEAN , C. (2012), Drought variability and its driving factors in the Republic of Moldova. In: EMS Annual Meeting Abstracts Vol. 9, EMS2012-54, 12th EMS / 9th ECAC. 10th -14th September, Łódź, Poland, 2012.
GEOGRAPHIA
NAPOCENSIS
AN.
VII,
nr. 2/2013
geographianapocensis.acad-cluj.ro
Conference. 14-16 September, 2011, NoviSad, Serbia, 403-418.
[19] POTOP, V., SOUKUP J., (2009),
Spatiotemporal characteristics of dryness and drought in the Republic of Moldova. Theor Appl Climatol, 96, 305–318.
[20] PREISENDORFER, RW, (1988), Principal component analysis in meteorology and
oceanography. Elsevier, Amsterdam, p. 425 [21] von STORCH H (1995), Spatial patterns: