ACPD
9, 4653–4689, 2009Measurements of particle masses of
inorganic salt particles
M. Kuwata and Y. Kondo
Title Page
Abstract Introduction
Conclusions References
Tables Figures
◭ ◮
◭ ◮
Back Close
Full Screen / Esc
Printer-friendly Version
Interactive Discussion
Atmos. Chem. Phys. Discuss., 9, 4653–4689, 2009 www.atmos-chem-phys-discuss.net/9/4653/2009/ © Author(s) 2009. This work is distributed under the Creative Commons Attribution 3.0 License.
Atmospheric Chemistry and Physics Discussions
This discussion paper is/has been under review for the journalAtmospheric Chemistry
and Physics (ACP). Please refer to the corresponding final paper inACPif available.
Measurements of particle masses of
inorganic salt particles for calibration of
cloud condensation nuclei counters
M. Kuwata and Y. Kondo
Research Center for Advanced Science and Technology, the University of Tokyo, Tokyo, Japan
Received: 7 January 2009 – Accepted: 23 January 2009 – Published: 24 February 2009
Correspondence to: M. Kuwata (kuwata@atmos.rcast.u-tokyo.ac.jp)
ACPD
9, 4653–4689, 2009Measurements of particle masses of
inorganic salt particles
M. Kuwata and Y. Kondo
Title Page
Abstract Introduction
Conclusions References
Tables Figures
◭ ◮
◭ ◮
Back Close
Full Screen / Esc
Printer-friendly Version
Interactive Discussion Abstract
We measured the mobility equivalent critical dry diameter for CCN activation (dc me) and the particle mass of size-selected (NH4)2SO4 and NaCl particles to calibrate a
CCN counter (CCNC) precisely. The CCNC was operated downstream of a diff eren-tial mobility analyzer (DMA) for the measurement of dc me. The particle mass was
5
measured using an aerosol particle mass analyzer (APM) operated downstream of the DMA. The measurement of particle mass was conducted for 50–150-nm particles. Effective densities (ρeff) of (NH4)2SO4 particles were 1.67–1.75 g cm−
3
, which corre-spond to the dynamic shape factors (χ) of 1.01–1.04. This shows that (NH4)2SO4
particles are not completely spherical. In the case of NaCl particles, ρeff was 1.75–
10
1.99 g cm−3 and χ was 1.05–1.14, demonstrating that their particle shape was non-spherical. Using these experimental data, the volume equivalent critical dry diameter (dc ve) was calculated, and it was used as an input parameter for calculations of critical supersaturation (S). Several thermodynamics models were used for the calculation of water activity. When the Pitzer model was employed for the calculations, the criticalS
15
calculated for (NH4)2SO4 and NaCl agreed to well within the uncertainty of 2%
(rela-tive). This result demonstrates that the use of the Pitzer model for the calibration of CCNCs gives the most probable value ofS.
1 Introduction
The number concentration of cloud condensation nuclei (CCN) is an important
param-20
eter for cloud microphysics. The number concentration and size distribution of cloud droplets are affected by changes in the CCN number concentration. Consequently, CCN number concentration is indirectly related to radiative forcing and the hydrological cycle. Thus, it is important to measure the CCN number concentration and CCN ac-tivity of atmospheric particles precisely (Twomey, 1974; Lohmann and Feichter, 2005,
25
ACPD
9, 4653–4689, 2009Measurements of particle masses of
inorganic salt particles
M. Kuwata and Y. Kondo
Title Page
Abstract Introduction
Conclusions References
Tables Figures
◭ ◮
◭ ◮
Back Close
Full Screen / Esc
Printer-friendly Version
Interactive Discussion
CCN number concentration is measured using a CCN counter (CCNC). Several types of CCNCs have been developed (McMurry, 2000; Nenes et al., 2001; Roberts and Nenes, 2005). In most CCNCs, supersaturated conditions are produced by cre-ating a temperature difference on wetted walls. CCN-active particles grow to large droplets in the artificial supersaturated environment. The number of droplets is then
5
counted using an optical particle counter (OPC) (e.g., Stratmann et al., 2004; Roberts and Nenes, 2005) or a charge coupled device (CCD) camera (Otto et al., 2002). The most important parameter in CCN measurement is the precise value of the supersatu-ration (S) inside the instrument, which ensures compatibility with other studies (Seinfeld and Pandis, 2006).
10
Sinside a CCNC can be calculated theoretically (e.g., Nenes et al., 2001; Stratmann et al., 2004; Roberts and Nenes, 2005). These theoretical studies are indispensable for developing CCNCs. However, theoretical results are not sufficient for practical ob-servations and experiments as the ideal instrument does not exist and instrumental conditions can change with time. Therefore, routine calibrations are required for the
op-15
eration of CCNCs (e.g., Rose et al., 2008). Unfortunately, there are no instruments that can measureS directly; thus, we have to choose an alternative method for calibration. In most CCN studies, the critical dry diameters (the threshold diameters for CCN acti-vation,dc) of laboratory-generated particles are measured using a CCNC connected to a differential mobility analyzer (DMA) in tandem to calibrate the instruments. Then, the
20
criticalS values corresponding to the observeddc values are calculated using K ¨ohler theory. (NH4)2SO4 is the most frequently used compound for calibration (e.g., Kumar
et al., 2003; VanReken et al., 2005), and some studies also use NaCl particles (Riss-man et al., 2007; Shilling et al., 2007; Rose et al., 2008). However, the criticalS of (NH4)2SO4 particles is strongly dependent on thermodynamics models (Kreidenweis
25
vari-ACPD
9, 4653–4689, 2009Measurements of particle masses of
inorganic salt particles
M. Kuwata and Y. Kondo
Title Page
Abstract Introduction
Conclusions References
Tables Figures
◭ ◮
◭ ◮
Back Close
Full Screen / Esc
Printer-friendly Version
Interactive Discussion
ous experimental data (Archer, 1992). However, it is difficult to estimate the criticalS of a DMA-selected NaCl particle because of its non-spherical shape (Kelly and McMurry, 1992; Zelenyuk et al., 2006a). In previous studies,S values calculated using the two different compounds did not always agree, and the magnitude of the difference was up to 10% (relative) (e.g., Shilling et al., 2007). These discrepancies were possibly caused
5
by the uncertainties described above. Rose et al. (2008) have described that the cali-bration results using (NH4)2SO4 and NaCl agrees well if the dynamic shape factor (χ)
of NaCl is assumed to be 1.08, although they acknowledged that further systematic investigations are still needed for more quantitative measurements.
In this study, we measured the masses of (NH4)2SO4and NaCl particles generated
10
for the calibration of a CCNC using an aerosol particle mass analyzer (APM). The APM can select particles according to their mass by virtue of the balance between electro-static and centrifugal forces (Ehara et al., 1996). Thus, the combination of a DMA and an APM (DMA-APM system) enables us to measure the mass of DMA-selected par-ticles, and we can obtain parameters related to particle morphology such asχ (e.g.,
15
Park et al., 2004). Then,S values inside the CCNC were calculated using the mea-sureddc, particle mass, and several thermodynamics models. The calculatedSvalues are compared to investigate the consistency of the experimental results of (NH4)2SO4
and NaCl particles.
2 Theoretical background
20
2.1 The relationship ofdmeanddve
In this section, we summarize the relationship between mobility diameter (dme) and volume equivalent diameter (dve), because the conversion ofdmetodve is needed to prepare an input parameter for calculations based on K ¨ohler theory (Sect. 2.2). For spherical particles, dme is equal to dve. However, particles are not always spherical.
25
(De-ACPD
9, 4653–4689, 2009Measurements of particle masses of
inorganic salt particles
M. Kuwata and Y. Kondo
Title Page
Abstract Introduction
Conclusions References
Tables Figures
◭ ◮
◭ ◮
Back Close
Full Screen / Esc
Printer-friendly Version
Interactive Discussion
Carlo et al., 2004):
mp=π
6ρmd
3
ve=
π
6ρeffd
3
me (1)
or
dve= 3 s
ρeff
ρmdme (2)
wherempis particle mass, and ρm is the material density. In the DMA-APM system,
5
dmeis known as it is prescribed by the DMA, andmpcan be measured using the APM. Thus, if we apply this experimental system to particles composed of single compounds,
we can obtain the conversion factor
3
qρ
eff
ρm
easily, asρmis a known parameter.
dveanddmecan also be related byχ, which is defined as the ratio of the drag force acting on spherical particles with diameters of dve and dme. Under the equilibrium
10
sphere approximation (ESA) (Dahneke, 1973),χ is defined by the following equation (Kasper, 1982):
χ = Zp(dve) Zp(dme)
= CC(dve) dve
dme
CC(dme)
(3)
whereZpis the electrical mobility, and the slip correction factor (CC) can be calculated from the following equation (Allen and Raabe, 1985):
15
CC =1+2λ dp
1.142+0.558 exp
−0.999
2λ dp
(4)
ACPD
9, 4653–4689, 2009Measurements of particle masses of
inorganic salt particles
M. Kuwata and Y. Kondo
Title Page
Abstract Introduction
Conclusions References
Tables Figures
◭ ◮
◭ ◮
Back Close
Full Screen / Esc
Printer-friendly Version
Interactive Discussion
for particles that are highly non-spherical (Dahneke, 1973). For this purpose, the ad-justed sphere approximation (ASA) was introduced (Dahneke, 1973). Using ASA, χt can be written as follows (DeCarlo et al., 2004):
χt=χc
CC(dve)
CCχf
χcdve
(5)
where, χf and χc denote χ in the free molecular regime and continuous regime,
re-5
spectively.
2.2 K ¨ohler theory
The water activity of an aqueous solution (aw) is equal to the saturation ratio of water vapor (Robinson and Stokes, 2002)
pw
p0w =aw (6)
10
wherepw is the vapor pressure of water and p0w is the saturation vapor pressure of water. For an aqueous solution in gas-liquid equilibrium,pw is equal to the equilibrium water vapor pressure of a solution having a flat surface. In the case of particles, the equilibrium vapor pressure of the solution (pw aerosol) is affected by the curvature of the
droplet (Kelvin effect). The magnitude of this effect is described as follows (Seinfeld
15
and Pandis, 2006)
pw aerosol
pw =
exp 4σMw
RT ρwDp !
(7)
whereσis surface tension,Mw is the molecular weight of water,R is the gas constant,
ACPD
9, 4653–4689, 2009Measurements of particle masses of
inorganic salt particles
M. Kuwata and Y. Kondo
Title Page
Abstract Introduction
Conclusions References
Tables Figures
◭ ◮
◭ ◮
Back Close
Full Screen / Esc
Printer-friendly Version
Interactive Discussion
Eq. (7) into (6), we get
s= pw aerosol
p0w =awexp
4σMw RT ρwDp
!
(8)
where s is the saturation ratio of water vapor. Thus, aw is needed to calculate s. There are several expressions for theaw of solution. One of the most commonly used expressions is the equation defining the molal osmotic coefficient (ϕ) (Robinson and
5
Stokes, 2002);
lnaw =−υmMw
1000 ϕ , (9)
whereυis the stoichiometric number of solute ions and molecules, andm(molality) is defined as follows:
m= 1000ms Msmw
. (10)
10
In Eq. (10),ms is the mass of solute, Ms is molecular weight of solute, andmw is the mass of water in aqueous solution. The van’t Hofffactor (i) is also frequently used to expressaw. The valuei is defined as follows:
aw =
nw nw+i ns
(11)
wherenw andni are the numbers of moles of water (solvent) and solute, respectively
15
(Pruppacher and Klett, 1997). As an example of another expression, Tang and Munkel-witz (1994) and Tang (1996) expressedaw as a polynomial equation with respect to the concentration of the solution (weight percent). Thermodynamics models employed for the present study is summarized in Appendix B. Among the models summarized in Appendix B, we regard that of Archer (1992) as the most reliable, as it is based
20
ACPD
9, 4653–4689, 2009Measurements of particle masses of
inorganic salt particles
M. Kuwata and Y. Kondo
Title Page
Abstract Introduction
Conclusions References
Tables Figures
◭ ◮
◭ ◮
Back Close
Full Screen / Esc
Printer-friendly Version
Interactive Discussion
Using Eqs. (8)–(10), we get
lns= 4σMw RT ρwDp −
υϕMwms Msmw
. (12)
In Eq. (12), we need to knowms for the calculation of s. It is equal to mp when the particle is composed of a single component. Then, Eq. (12) can be rewritten usingdve (Eq. 1),
5
lns= 4σMw
RT ρwDp −υϕ
Mwρmdve3 Msρw
D3p−dve3
(13)
When we calculatesof a single particle as a function ofDp, it has the maximum value.
S corresponding to this value is called the criticalS. If the particle is subjected to anS
greater than the criticalS, the particle can grow into a cloud droplet.
3 Experiment
10
3.1 Particle generation and classification
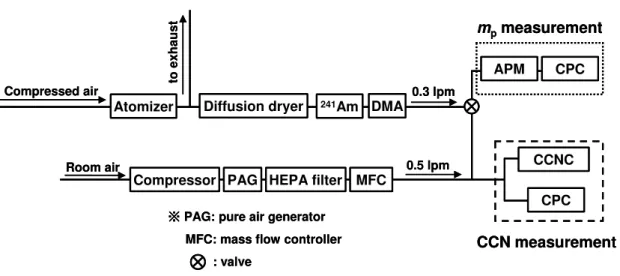
The experimental setup used in this study is shown in Fig. 1. Aqueous solutions (∼0.1 wt.%) of (NH4)2SO4 and NaCl were prepared and introduced into an atomizer
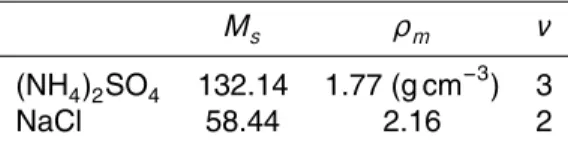
(TSI model 3075). Chemical properties of these compounds are summarized in Ta-ble 1. Synthetic compressed air supplied from a gas cylinder was used for this
atom-15
izer. Particles were dried by passing them through two diffusion dryers (TSI model 3062) connected in tandem. Silica gel used for the diffusion dryers was regenerated before each run. Then, particles were charged with a241Am neutralizer, and their size was selected by a DMA (TSI model 3081). The sheath and sample flow rates of the DMA were set at 3.0 lpm and 0.3 lpm, respectively. The size-selection of the DMA was
20
ACPD
9, 4653–4689, 2009Measurements of particle masses of
inorganic salt particles
M. Kuwata and Y. Kondo
Title Page
Abstract Introduction
Conclusions References
Tables Figures
◭ ◮
◭ ◮
Back Close
Full Screen / Esc
Printer-friendly Version
Interactive Discussion
in Table 2. The peak diameters of the size-distributions agreed with the diameters of the PSL to within the errors given by the manufacturers. In this paper, we report diam-eters by the set values of the DMA. The random error in diameter estimated from the PSL measurements was less than 0.5%.
3.2 CCN measurement
5
The CCN measurement part of Fig. 1 was used to determine the mobility equivalent critical dry diameter (dc me). A CCNC (Droplet Measurement Technologies) (Roberts and Nenes, 2005) was used to measure CCN number concentration, and a conden-sation particle counter (CPC: TSI model 3022) was used for CN measurement. The sample flow from the DMA was mixed with dry compressed particle-free air (0.5 lpm)
10
to keep the sample flow rate of the DMA at 0.3 lpm. Dilution air was produced from air in the laboratory using a pure air generator (PAG 003, ECO Physics) and a high-efficiency particulate air (HEPA) filter. The flow rate of the dilution air was controlled by a mass flow controller. The sample flow and the sheath flow rates of the CCNC were set to 0.045 lpm and 0.455 lpm, respectively. Two temperature gradient (∆T) conditions
15
of the thermal gradient chamber inside the CCNC were used as shown in Table 3 so that the measurement was performed at twoS values. Solenoid pumps used for water circulation in the CCNC were replaced by external peristaltic pumps for flow stabiliza-tion. The air circulation system for the OPC drying system was plugged to stabilize the airflow in the chamber. The reproducibility ofdc memeasurement was tested using
20
(NH4)2SO4particles. The random errors associated withdc memeasurement were 0.1 and 0.3 nm for∆T1 and∆T2, respectively. The influence of this error on the criticalS
was calculated to be negligibly small (less than 0.001% (absolute)).
3.3 DMA-APM system
An APM (APM 302, KANOMAX JAPAN, Inc.) was employed to measurempof particles
25
ACPD
9, 4653–4689, 2009Measurements of particle masses of
inorganic salt particles
M. Kuwata and Y. Kondo
Title Page
Abstract Introduction
Conclusions References
Tables Figures
◭ ◮
◭ ◮
Back Close
Full Screen / Esc
Printer-friendly Version
Interactive Discussion
al., 1996),
mp= neVAP M ω2r2ln(r
2/r1)
(14)
wheren is the number of charges, e is the elementary charge, VAP M is the voltage applied to the APM,ω is the rotation speed, and r, r1, and r2 are the center, inner,
and outer radii of the APM, respectively. Particle number concentration downstream
5
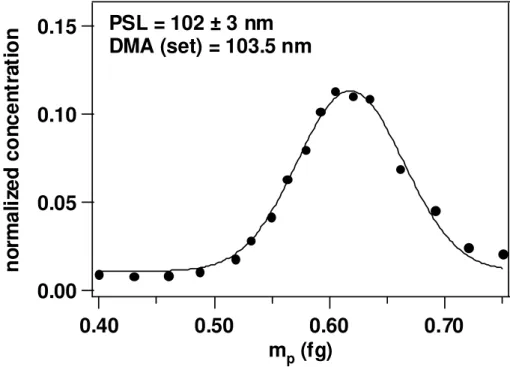
of the APM was measured by a CPC (TSI model 3022). To calibrate mp and ρeff measurement by the DMA-APM system, the masses of DMA-selected PSL particles were measured. Figure 2 shows an example of a mass distribution of DMA-selected PSL particles. The peak of the distribution, which corresponds tomp, was obtained by fitting the distribution by a Gaussian function. Density calculated using Eqs. (14)
10
and (1) (in this case, we can assumedve=dme, as PSL particles have spherical shape) agreed with the values given by the manufacturers to within 5%, and this difference was corrected for inorganic salt particles. The random error associated with theρeff measurement by the DMA-APM system was 1%, estimated from PSL measurements. The measurement of ρeff was performed four times. RUN1 and RUN2 were
per-15
formed prior to CCN measurement. RUN3 was performed soon after (within 5 h) the CCN measurement at ∆T1, and we concentrated on the size range that is important for CCN activation under these conditions. Likewise, RUN4 was performed soon after the CCN measurement at∆T2.
4 Results and discussion
20
4.1 dc meof inorganic salt particles
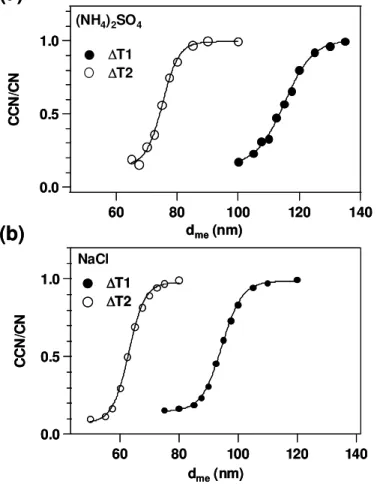
Figure 3 shows experimental results for the CCN measurement of (NH4)2SO4 and
ACPD
9, 4653–4689, 2009Measurements of particle masses of
inorganic salt particles
M. Kuwata and Y. Kondo
Title Page
Abstract Introduction
Conclusions References
Tables Figures
◭ ◮
◭ ◮
Back Close
Full Screen / Esc
Printer-friendly Version
Interactive Discussion
approach unity. The CCN/CN ratios are fitted by a sigmoid function (Eq. 15):
CCN CN =a+
b
1+expdc me−dme
c
(15)
wherea,b, andcare constants determined by the fitting.dc mevalues were 115.2 nm (∆T1) and 75.3 nm (∆T2) for (NH4)2SO4 and 94.7 nm (∆T1) and 63.2 nm (∆T2) for
NaCl, respectively.
5
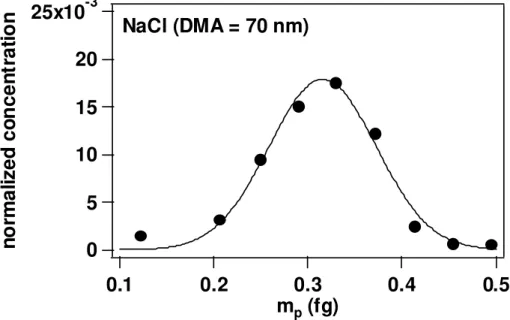
4.2 ρeff,χ anddveof inorganic salt particles
Figure 4 shows an example mass distribution of DMA-selected NaCl particles mea-sured using the APM and CPC. As in the case of PSL, these distributions were fitted by Gaussian functions to obtain the peak of the distribution, and then we obtained the particle mass. ρeff, dve and χ were calculated from the experimental results.
10
The calculated values are summarized in Fig. 5. ESA was used to calculate χ in all cases, asχf andχc are not available. In the case of (NH4)2SO4, the measured
val-ues ofρeff (1.67∼1.75 g cm−
3
) were slightly smaller than the bulk density (1.77 g cm−3) (Fig. 5a), and χ was slightly larger than unity (1.01∼1.04) (Fig. 5b). These values are similar to those obtained by Zelenyuk et al. (2006a), who showed that the χ of
15
(NH4)2SO4 is 1.03±0.01 at 160 nm using a DMA and a single-particle laser ablation
time-of-flight mass spectrometer (SPLAT). Biskos et al. (2006a) estimated aχ for 6– 60-nm (NH4)2SO4particles of 1.02 to explain the discrepancy between theoretical cal-culations and experimental results of the hygroscopicity measurement. These results indicate that (NH4)2SO4 particles do not have a completely spherical shape, as
ob-20
served by electron microscope (Dick et al., 1998; Zelenyuk et al., 2006a). Comparing the results of RUN1∼RUN4, systematic differences are observed. ρeff was the highest in RUN2 and lowest in RUN4. These differences are greater than the uncertainty of theρeff measurement (1%). Zelenyuk et al. (2006b) reported that rapid drying causes particles to have a more irregular shape. Thus, we suspect that these differences found
ACPD
9, 4653–4689, 2009Measurements of particle masses of
inorganic salt particles
M. Kuwata and Y. Kondo
Title Page
Abstract Introduction
Conclusions References
Tables Figures
◭ ◮
◭ ◮
Back Close
Full Screen / Esc
Printer-friendly Version
Interactive Discussion
are possibly caused by different conditions of the silica gel in the diffusion dryer in each run. Figure 5c shows the relationship betweendme and dve of (NH4)2SO4 particles.
As can be easily expected from the values of χ, the slope is almost equal to unity (0.99). Considering that the error in the diameter of PSL particles is typically about 3% (Table 2), this result shows that (NH4)2SO4 particles can be treated approximately as
5
spherical in most cases.
Figure 5d and e shows ρeff and χ of NaCl particles, respectively. ρeff
(1.75∼1.99 g cm−3) was smaller than the bulk density (2.16 g cm−3), and χ was sig-nificantly larger than unity (1.05∼1.14). Kelly and McMurry (1992) used a DMA and an impactor to measureρeff of NaCl particles (dme=111 nm). They reported thatρeff
10
was equal to 1.86 g cm−3 (χ=1.08). Zelenyuk et al. (2006a) measured ρeff of NaCl (dme=160∼850 nm) using a DMA and a SPLAT. They showed that ρeff∼1.95 g cm−
3
(χ∼1.06) at 160 nm. Mikhaliov et al. (2004) estimated that χ is equal to 1.06 (99 nm) and 1.07 (201 nm) from hygroscopicity measurements. These values show that the shape of NaCl particles is significantly different from spherical. Our results shown in
15
Fig. 5 are similar to these other studies except for RUN4. In that case, χ was sys-tematically higher than the other cases (1.10∼1.14). This value is higher than the χ
for a cubic shape in the continuous regime (1.08) (Hinds, 1999). Biskos et al. (2006b) showed thatχ calculated by ASA for a cubic shape is needed to explain hygroscopic growth ofdme=6–60-nm NaCl particles. χ is about 1.2 for dme=50–100 nm when we
20
employ ASA to calculate theχ of cubic particles. Thus, we regard the results of RUN4 as quite reasonable, considering that the shape of NaCl particles is cubic with rounded edges (Zelenyuk et al., 2006a). Figure 5f shows the relationship between dme and
dve of NaCl particles. dve is smaller thandmeby 3–7%, and the value of the slope is 0.95. This shows that morphology should be considered when using NaCl particles for
25
ACPD
9, 4653–4689, 2009Measurements of particle masses of
inorganic salt particles
M. Kuwata and Y. Kondo
Title Page
Abstract Introduction
Conclusions References
Tables Figures
◭ ◮
◭ ◮
Back Close
Full Screen / Esc
Printer-friendly Version
Interactive Discussion
4.3 Calculation ofS
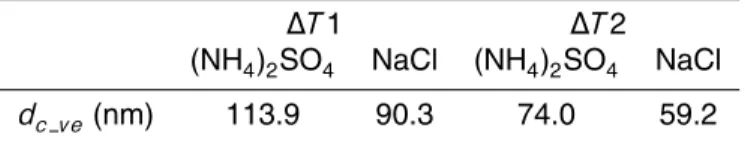
In this section, we estimate S inside the CCNC using experimental results shown in Sects. 4.1 and 4.2. In order to calculate volume equivalent critical dry diameter (dc ve),
dc me andρeff atdc me are required (Eq. 1). Thedc meshown in Sect. 4.1 was used, andρeffatdc mewas calculated by interpolating the corresponding experimental result
5
of the DMA-APM system measurement (RUN3 and RUN4 for∆T1 and ∆T2, respec-tively). The values of dc ve used for the calculation are summarized in Table 4. The calculation was performed using the temperatures atT2 (Table 3).
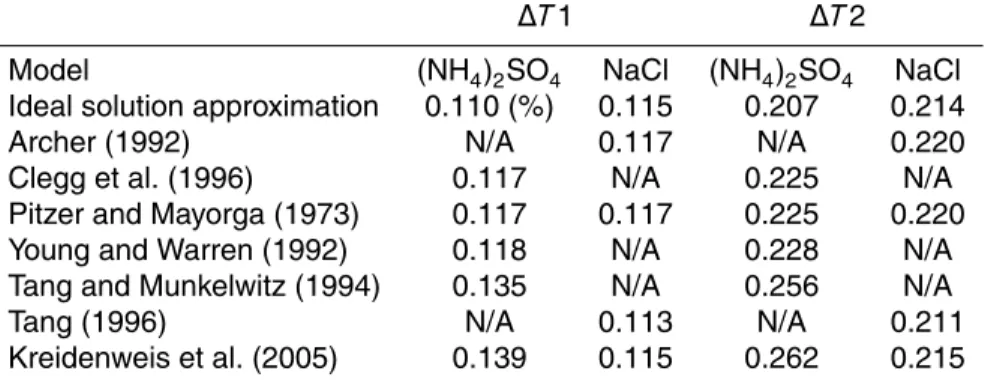
Table 5 shows the calculated results. As discussed in Sect. 2.2, we regard the model of Archer (1992) as the most reliable. Using this model,S values were calculated to be
10
0.117% and 0.220% for∆T1 and∆T2, respectively. Thus, we regard these values as the most probable values ofS in the CCN chamber.
In the case of NaCl particles at ∆T1, the value calculated using the approach of Tang (1996) was the lowest, and a higherS value was obtained with the approach of Kreidenweis et al. (2005) and the ideal solution approximation. The values calculated
15
using the Pitzer models (Pitzer and Mayorga, 1973; Archer et al., 1992) are the same. For (NH4)2SO4 at∆T1, values similar to those of Archer (1992) were obtained when
we employed the Pitzer models (Pitzer and Mayorga, 1973; Clegg et al., 1996). This indicates the validity of the Pitzer model for the calculation ofS. A similar value was obtained based on the work of Young and Warren (1992). The ideal solution
approxi-20
mation for (NH4)2SO4 gave the lowest S. This indicates the inappropriateness of the
use of this approximation for (NH4)2SO4. Parameterizations by Tang and Munkelwitz (1994) and Kreidenweis et al. (2005) estimated the highest values ofS. These values are significantly higher than those of Archer (1992). In the case of∆T2, the trend is similar to∆T1. For NaCl particles,aw given by Tang (1996) gave the lowestS, and the
25
Pitzer models (Pitzer and Mayorga, 1973; Archer 1992) gave the highestS. In the case of (NH4)2SO4, the ideal solution approximation gave the lowest values, and the Pitzer
ACPD
9, 4653–4689, 2009Measurements of particle masses of
inorganic salt particles
M. Kuwata and Y. Kondo
Title Page
Abstract Introduction
Conclusions References
Tables Figures
◭ ◮
◭ ◮
Back Close
Full Screen / Esc
Printer-friendly Version
Interactive Discussion
(1992) gave similar values. Application of the approach of Tang and Munkelwitz (1994) and Kreidenweis et al. (2005) gave the highest estimation of S. However, unlike the case of∆T1, a relatively large difference (0.005% in absolute terms) between Clegg et al. (1996) and Archer (1992) was observed at∆T2. So far, we have been unable to determine what caused this difference.
5
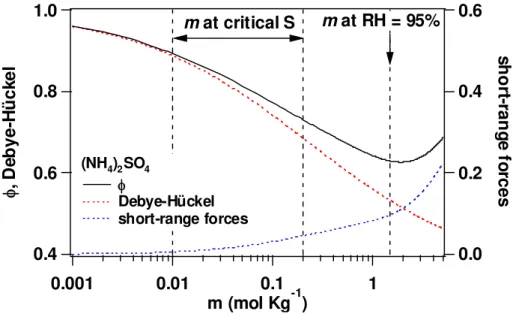
To summarize the above discussion, the Pitzer models (Pitzer and Mayorga, 1973; Archer, 1992; Clegg, 1996) are valid to estimate critical S values within the uncer-tainty of 2% (relative). The ideal solution approximation gives lower values of the crit-icalS, and the parameterizations by Tang and Munkelwitz (1994) and Kreidenweis et al. (2005) yield higher values for (NH4)2SO4. These parameterization are based on
10
the data of hygroscopic growth up to RH=95%. The concentration of the (NH4)2SO4 solution at this RH is aboutm=1.5 mol kg−1. Figure 6 shows theϕof (NH4)2SO4given
by Clegg et al. (1996). In the case ofm<1 mol kg−1,ϕdecreases with an increase in
mbecause of the Debye-H ¨uckel effect. However, ϕincreases with the increase inm
form>2 mol kg−1due to short-range forces. This shows that the thermodynamic
prop-15
erties of (NH4)2SO4solutions change at around 1.5 mol kg− 1
. Values ofmat criticalS
values of (NH4)2SO4 particles were calculated to be 0.01∼0.2 mol kg− 1
(S=0.1∼1%), and thus we need to take care in employing these parameterizations to calibrate a CCNC.
5 Summary and conclusion
20
In this study, we measured CCN/CN ratios and mp of size-selected (NH4)2SO4 and
NaCl particles. CCN/CN ratios were measured using a CCNC and a CPC, andmpwas measured using an APM and a CPC. The CCNC was operated under two conditions (∆T1 and ∆T2). The dc me values of (NH4)2SO4 were 115.2 nm (∆T1) and 75.3 nm
(∆T2). In the case of NaCl, these values were 94.7 nm (∆T1) and 63.2 nm (∆T2). dve
25
calculated frommpand ρm were smaller than dmeby about 1 and 5% for (NH4)2SO4
ACPD
9, 4653–4689, 2009Measurements of particle masses of
inorganic salt particles
M. Kuwata and Y. Kondo
Title Page
Abstract Introduction
Conclusions References
Tables Figures
◭ ◮
◭ ◮
Back Close
Full Screen / Esc
Printer-friendly Version
Interactive Discussion
as spherical particles.
dc ve values were estimated fromdc meand measured ρeff and they were used as input parameters for K ¨ohler theory calculations. Then,S values inside the CCNC were estimated using several thermodynamics models. In these calculations, we regarded that the Pitzer model for NaCl (Archer, 1992) was the most reliable, as it was in
ex-5
cellent agreement with the experimental data, including the concentration range that is important for CCN activation. The values obtained for (NH4)2SO4 and NaCl agreed to
within a difference of 2% (relative) when the Pitzer model was employed for the calcu-lation. This result indicates that application of the Pitzer model for calibrating a CCNC gives the most probable values ofS.
10
Appendix A
List of parameters
ai coefficients in the polynomial equation for water density given by Kell (1975)
15
aw water activity
Aϕ Debye-H ¨uckel constant for the osmotic coefficient
CC Cunningham slip correction factor
Ci coefficients in the polynomial equation for water activity given by Tang and Munkelwitz (1994) and Tang (1996)
20
CMXϕ ,C(0)MX,C(1)MX parameters for the Pitzer equation
ACPD
9, 4653–4689, 2009Measurements of particle masses of
inorganic salt particles
M. Kuwata and Y. Kondo
Title Page
Abstract Introduction
Conclusions References
Tables Figures
◭ ◮
◭ ◮
Back Close
Full Screen / Esc
Printer-friendly Version
Interactive Discussion dc me,dc ve critical dry diameter (mobility equivalent diameter and volume
equiv-alent diameter, respectively)
dme mobility equivalent diameter
dve volume equivalent diameter
Dp droplet diameter
5
dp particle diameter
e elementary charge
I ion strength
i van’t Hofffactor
m molality of solution
10
mp mass of particle
mw mass of water
ms mass of solute
Mw molecular weight of water
Ms molecular weight of solute
15
n particle charge
nw number of moles of water
ns number of moles of solute
ACPD
9, 4653–4689, 2009Measurements of particle masses of
inorganic salt particles
M. Kuwata and Y. Kondo
Title Page
Abstract Introduction
Conclusions References
Tables Figures
◭ ◮
◭ ◮
Back Close
Full Screen / Esc
Printer-friendly Version
Interactive Discussion pw equilibrium water vapor pressure of aqueous solution having a flat
surface
pw aerosol equilibrium water vapor pressure of aerosol particle
R gas constant
r,r1,r2 center, inner, and outer radii of the operating space of the APM
5
s saturation ratio of water vapor
S supersaturation of water vapor
T temperature (K)
∆T temperature gradient of CCNC
VAP M voltage applied to APM
10
x concentration of solution in weight percent (%)
Zp electrical mobility
zm, zx charges of ionsmandx
α a constant in the Pitzer equation
α2 a constant in the revised Pitzer equation given by Archer (1991)
15
β(0)MX,β(1)MX parameters in the Pitzer equation
λ mean free path of air
σ surface tension
ACPD
9, 4653–4689, 2009Measurements of particle masses of
inorganic salt particles
M. Kuwata and Y. Kondo
Title Page
Abstract Introduction
Conclusions References
Tables Figures
◭ ◮
◭ ◮
Back Close
Full Screen / Esc
Printer-friendly Version
Interactive Discussion ρm density of the material in the particle
ρw density of water
υ υm+υx
υm,υx stoichiometric number of ionsmandx ϕ molal osmotic coefficient
5
ω rotation speed of APM
χ dynamic shape factor
χc,χt,χf dynamic shape factor of continuum, transition, and free molecular regimes
Appendix B
10
Thermodynamics models foraw of inorganic salt
In this section, we review the thermodynamics models of (NH4)2SO4 and NaCl
em-ployed in this study to estimateS in the CCNC.
Ideal solution approximation
15
The simplest model is the ideal solution approximation (ϕ=1). Although it may be too simple (e.g., Young and Warren, 1992), this approximation has been used to calibrate CCNCs in many studies (e.g., Raymond and Pandis, 2002; Roberts and Nenes, 2005). The manufacture of CCNC also relies on this model (Shilling et al., 2007). Thus, it is important to compare this model with more sophisticated models.
ACPD
9, 4653–4689, 2009Measurements of particle masses of
inorganic salt particles
M. Kuwata and Y. Kondo
Title Page
Abstract Introduction
Conclusions References
Tables Figures
◭ ◮
◭ ◮
Back Close
Full Screen / Esc
Printer-friendly Version
Interactive Discussion
Pitzer model
Pitzer developed a semi-empirical model to calculateϕ(Pitzer, 1973). Using the orig-inal Pitzer model,ϕof a single electrolyte can be calculated by the following equation (refer Appendix A for the notation of parameters):
ϕ=1− |zmzx|Aϕ √
I
1+1.2√I +m
2υmυx
υ
βMX(0) +βMX(1) exp(−αpI)
5
+m22(υmυx)
3/2
υ C
ϕ
MX . (B1)
The first two terms are derived from Debye-H ¨uckel theory, and the third and fourth terms express short-range interactions (e.g., ion-molecular interactions). Aϕ can be calculated as a function of temperature using the polynomial equation given by Clegg et al. (1994), which is based on the study of Archer and Wang (1990). Pitzer and Mayorga
10
(1973) determined three parameters (βMX(0) ,βMX(1) andCϕMX) for NaCl and (NH4)2SO4
us-ing experimental data reviewed by Electrolyte Solutions (Robinson and Stokes, 2002). The model has been used for the calibration of CCNCs (e.g., Mochida et al., 2006) and compared with other models by Rose et al. (2008).
Archer (1991) modified Eq. (B1) as follows:
15
ϕ=1− |zmzx|Aϕ √
I
1+1.2√I +m
2υmυx
υ
βMX(0) +βMX(1) exp(−αpI)
+m24υ
2
mυx
υ
C(0)MX +CMX(1) exp(−α2
p
I) . (B2)
Archer (1992) gave the parameters of the above equation for NaCl as a function of temperature and pressure. Experimental data used by Archer (1992) cover the con-centration range that is important for the calculation of critical S (on the order of
20
ACPD
9, 4653–4689, 2009Measurements of particle masses of
inorganic salt particles
M. Kuwata and Y. Kondo
Title Page
Abstract Introduction
Conclusions References
Tables Figures
◭ ◮
◭ ◮
Back Close
Full Screen / Esc
Printer-friendly Version
Interactive Discussion
use of the work of Archer (1992). Clegg et al. (1996) obtained parameters for Eq. (B2) for (NH4)2SO4, and their results have been used in some CCN studies (e.g., Kumar et
al., 2003), and it has been compared extensively with other models by Kreidenweis et al. (2005).
van’t Hofffactor
5
Another method to express the non-ideal behavior of inorganic electrolyte solutions is the use ofi. One of the most widely-used expressions fori was derived by Young and Warren (1992):
i =1.9242−0.1844 ln(m)−0.007931(ln(m))2 (B3)
This equation is applicable only to (NH4)2SO4. The value from this model has been
10
used in some studies (e.g., Svenningsson et al., 2006; Frank et al., 2007) and com-pared with other models by Rose et al. (2008).
Polynomial equation
Tang and Munkelwitz (1994) and Tang (1996) measured hygroscopic growth of (NH4)2SO4 and NaCl using the electrodynamic balance (EDB) technique. They
sum-15
marized the experimental results with the following polynomial function:
aw =1.0+ X
Cixi (B4)
whereCi are constants, andx is the concentration of the solution in wt.%. This model has also been used to calibrate a CCNC (e.g., Snider et al., 2006) and compared with other models by Kreidenweis et al. (2005) and Rose et al. (2008).
20
Kreidenweis et al. (2005) fitted the growth factors (GFs) of (NH4)2SO4 and NaCl
particles measured by a hygroscopic tandem DMA with the following equation:
GF =dmewet dmedry
=
1+a+baw+ca2w
aw
1−aw 1/3
ACPD
9, 4653–4689, 2009Measurements of particle masses of
inorganic salt particles
M. Kuwata and Y. Kondo
Title Page
Abstract Introduction
Conclusions References
Tables Figures
◭ ◮
◭ ◮
Back Close
Full Screen / Esc
Printer-friendly Version
Interactive Discussion
where a, b, and c are constants, and dme wet and dmedry denote the wet and dry
particle diameters, respectively. This model has also been used for some CCN studies (e.g., Mochida et al., 2006; Rose et al., 2008).
Appendix C
5
ρw andσ
Here we summarize values ofρw andσ employed for the calculation of criticalS. ρw
depends both on temperature (Kell, 1975) and the concentration of solute (Tang and Munkelwitz, 1994; Tang, 1996). However, the density of the solution is available only at 25◦C, and the influence of the solute on the density of solution near the criticalDpis
10
estimated to be small. Thus, we employed the temperature-dependent water density given by Kell (1975), which is written as follows:
ρw =
5
P
i=0
aiTi 1+a−1T
(C1)
whereai are constants.
σ also depends on temperature and chemical composition (Seinfeld and Pandis,
15
2006). We employed the following set of equations to calculateσ:
σ(NH4)2SO4 =σwater(T)+2.17×10⁻³m(NH4)2SO4 (C2)
σNaCl=σwater(T)+1.62×10⁻³mNaCl (C3)
where
σwater=235.8×10⁻³
T c−T
Tc
1.256
1−0.625
T c−T
Tc
(Tc =647.15 K) (C4)
ACPD
9, 4653–4689, 2009Measurements of particle masses of
inorganic salt particles
M. Kuwata and Y. Kondo
Title Page
Abstract Introduction
Conclusions References
Tables Figures
◭ ◮
◭ ◮
Back Close
Full Screen / Esc
Printer-friendly Version
Interactive Discussion
Equations (C2) and (C3) are taken from Seinfeld and Pandis (2006) and Eq. (C4) was given by Vargaftik et al. (1983).
Acknowledgement. This work was supported by the Ministry of Education, Culture, Sports,
Science, and Technology (MEXT), the global environment research fund of the Japanese Min-istry of the Environment (B-083). M. Kuwata thanks to the Japan Society for the Promotion of
5
Science (JSPS) for a JSPS Research Fellowship for Young Scientists.
References
Allen, M. D. and Raabe, O. G.: Slip correction measurements of spherical solid aerosol particles in an improved Millikan apparatus, Aerosol. Sci. Technol., 4, 269–286, 1985.
Archer, D. G. and Wang, P.: The dielectric constant of water and Debye-H ¨uckel limiting law
10
slopes, J. Phys. Chem. Ref. Data., 19, 371–411, 1990.
Archer, D. G.: Thermodynamic properties of the NaBr+H2O system, J. Phys. Chem. Ref. Data.,
20, 509–535, 1991.
Archer, D. G.: Thermodynamic properties of the NaCl+H2O system II. Thermodynamic
prop-erties of NaCl(aq), NaCl·2H2O(cr), and phase equilibria, J. Phys. Chem. Ref. Data., 21,
15
793–821, 1992.
Biskos, G., Paulsen, D., Russel, L. M., Buseck, P. R., and Martin, S. T.: Prompt deliquescence
and efflorescence of aerosol nanoparticles, Atmos. Chem. Phys., 6, 4633–4642, 2006a,
http://www.atmos-chem-phys.net/6/4633/2006/.
Biskos, G., Russel, L. M., Buseck, P. R., and Martin, S. T.: Nanosize effect on
20
the hygroscopic growth factor of aerosol particles, Geophys. Res. Lett., 33, L07801, doi:10.1029/2005GL025199, 2006b.
Clegg, S. L., Rard, J. A., and Pitzer, K. S.: Thermodynamic properties of 0–6 mol kg−1aqueous
sulfuric acid from 273.15 to 328.15 K, J. Chem. Soc. – Faraday Trans., 90(13), 1875–1894, 1994.
25
Clegg, S. L., Milioto, S., and Palmer, D. A.: Osmotic and activity coefficients of
aque-ous (NH4)2SO4 as a function of temperature, and aqueous (NH4)2SO4-H2SO4 mixtures at
298.15 K and 323.15 K, J. Chem. Eng. Data, 41, 455–467, 1996.
Clegg, S. L.: Interactive comment on “Calibration and measurement uncertainties of
a continuous-flow cloud condensation nuclei counter (DMT-CCNC): CCN activation of
ACPD
9, 4653–4689, 2009Measurements of particle masses of
inorganic salt particles
M. Kuwata and Y. Kondo
Title Page
Abstract Introduction
Conclusions References
Tables Figures
◭ ◮
◭ ◮
Back Close
Full Screen / Esc
Printer-friendly Version
Interactive Discussion
monium sulfate and sodium chloride aerosol particles in theory and experiments” by D. Rose et al., Atmos. Chem. Phys. Discuss., 7, S4180–S4183, 2007.
Dahneke, B. E.: Slip correction factors for nonspherical bodies-III the form of the general law, J. Aerosol. Sci., 4, 163–170, 1973.
DeCarlo, P. F., Slowik, J. G., Worsnop, D. R., Davidovits, P., and Jimenez, J. L.: Particle
mor-5
phology and density characterization by combining mobility and aerodynamic diameter mea-surements. Part 1: Theory, Aerosol. Sci. Technol., 38, 1185–1205, 2004.
Dick, W. D., Ziemann, P. J., Huang, P.-F., and McMurry, P. H.: Optical shape fraction mea-surements of submicrometre laboratory and atmospheric aerosols, Meas. Sci. Technol., 9, 183–196, 1998.
10
Ehara, K., Hagwood, C., and Coakley, K. J.: Novel method to classify aerosol particles ac-cording to their mass-to-charge ratio-aerosol particle mass analyzer, J. Aerosol. Sci., 27(2), 217–234, 1996.
Frank, G. P., Dusek, U., and Andreae, M. O.: Technical Note: Characterization of a static thermal-gradient CCN counter, Atmos. Chem. Phys., 7, 3071–3080, 2007,
15
http://www.atmos-chem-phys.net/7/3071/2007/.
Hinds, W. C.: Aerosol Technology, John Wiley and Sons, Inc., 1999.
Kasper, G.: Dynamics and measurements of Smokes. I size characterization of nonspherical particles, Aerosol. Sci. Technol., 1, 187–199, 1982.
Kell, G. S.: Precise representation of volume properties of water at one atmosphere, J. Chem.
20
Eng. Data, 12(1), 66–69, 1967.
Kelly, W. P. and McMurry, P. H.: Measurements of particle density by inertial classification of
differential mobility analyzer-generated monodisperse aerosols, Aerosol. Sci. Technol., 17,
199–212, 1992.
Kreidenweis, S. M., Koehler, K., DeMott, P. J., Prenni, A. J., Carrico, C., and Ervens, B.: Water
25
activity and activation diameters from hygroscopicity data – Part 1: Theory and application to inorganic salts, Atmos. Chem. Phys., 5, 1357–1370, 2005,
http://www.atmos-chem-phys.net/5/1357/2005/.
Pradeep Kumar, P., Broekhuizen, K., and Abbatt, J. P. D.: Organic acids as cloud condensation nuclei: Laboratory studies of highly soluble and insoluble species, Atmos. Chem. Phys., 3,
30
509–520, 2003,
http://www.atmos-chem-phys.net/3/509/2003/.
ACPD
9, 4653–4689, 2009Measurements of particle masses of
inorganic salt particles
M. Kuwata and Y. Kondo
Title Page
Abstract Introduction
Conclusions References
Tables Figures
◭ ◮
◭ ◮
Back Close
Full Screen / Esc
Printer-friendly Version
Interactive Discussion
715–737, 2005,
http://www.atmos-chem-phys.net/5/715/2005/.
McMurry, P. H.: A review of atmospheric aerosol measurements, Atmos. Environ., 34, 1959– 1999, 2000.
Mikhailov, E., Vlasenko, S., Niessner R., and P ¨oschl, U.: Interaction of aerosol particles
com-5
posed of protein and salts with water vapor: hygroscopic growth and microstructural rear-rangement, Atmos. Chem. Phys., 4, 323–350, 2004,
http://www.atmos-chem-phys.net/4/323/2004/.
Mochida, M., Kuwata, M., Miyakawa, T., Takegawa, N., Kawamura, K., and Kondo, Y.: Rela-tionship between hygroscopicity and cloud condensation nuclei activity for urban aerosols in
10
Tokyo, J. Geophys. Res., 111, D23204, doi:10.1029/2005JD006980, 2006.
Nenes, A., Chuang, P. Y., Flagan, R. C., and Seinfeld, J. H.: A theoretical analysis of cloud condensation nucleus (CCN) instruments, J. Geophys. Res., 106(D4), 3449–3474, 2001. Otto, P., Georgii, H.-W., and Bingemer H.: A new three-stage continuous flow CCN-counter,
Atmos. Res., 61, 299–310, 2002.
15
Park, K., Kittelson, D. B., and McMurry, P. H.: Structural properties of diesel exhaust particles measured by transmission electron microscope (TEM): relationships to particle mass and mobility, Aerosol. Sci. Technol., 38, 881–889, 2004.
Pitzer, K. S.: Thermodynamics of electrolytes. I. Theoretical basis and general equations, J. Phys. Chem., 77(2), 268–277, 1973.
20
Pitzer, K. S. and Mayorga, G.: Thermodynamics of electrolytes. II. Activity and osmotic
co-efficients for strong electrolytes with one or both ions univalent, J. Phys. Chem., 77(19),
2300–2308, 1973.
Pruppacher, H. R. and Klett, J. D.: Microphysics of Clouds and Precipitation, Kluwer Academic Publishers, 1997.
25
Raymond, T. M. and Pandis, S. N.: Cloud activation of single-component organic aerosol parti-cles, J. Geophys. Res., 107(D24), 4787, doi:10.1029/2002JD002159, 2002.
Rissman, T. A., Varutbangkul, V., Surratt, J. D., Topping, D. O., McFiggans, G., Flagan, R. C., and Seinfeld, J. H.: Cloud condensation nucleus (CCN) behavior of organic aerosol particles generated by atomization of water and methanol solutions, Atmos. Chem. Phys., 7, 2949–
30
2971, 2007,
http://www.atmos-chem-phys.net/7/2949/2007/.
ACPD
9, 4653–4689, 2009Measurements of particle masses of
inorganic salt particles
M. Kuwata and Y. Kondo
Title Page
Abstract Introduction
Conclusions References
Tables Figures
◭ ◮
◭ ◮
Back Close
Full Screen / Esc
Printer-friendly Version
Interactive Discussion
for atmospheric measurements, Aerosol. Sci. Technol., 39, 206–221, 2005.
Robinson, R. A. and Stokes, R. H.: Electrolyte Solutions, second revised edition, Dover Publi-cations, Inc., 2002.
Rose, D., Gunthe, S. S., Mikhailov, E., Frank, G. P., Dusek, U., Andreae, M. O., and P ¨oschl, U.: Calibration and measurement uncertainties of a continuous-flow cloud condensation nuclei
5
counter (DMT-CCNC): CCN activation of ammonium sulfate and sodium chloride aerosol particles in theory and experiment, Atmos. Chem. Phys., 8, 1153–1179, 2008,
http://www.atmos-chem-phys.net/8/1153/2008/.
Seinfeld, J. H. and Pandis, S. N.: Atmospheric Chemistry and Physics, John Wiley and Sons, Inc., New York, 2006.
10
Shilling, J. E., King, M. E., Mochida, M., Worsnop, D. R., and Martin, S. T.: Mass spectral evi-dence that small changes in composition caused by oxidative aging processes alter aerosol CCN properties, J. Phys. Chem. A., 111, 3358–3368, 2007.
Snider, J. R., Petters, M. D., Wechsler, P., and Liu, P. S.: Supersaturation in the Wyoming CCN instrument, J. Atmos. Ocean. Technol., 23, 1323–1339, 2006.
15
Stratmann, F., Kiselev, A., Wendisch, M., Heintzenberg, J., Charlson, R. J., Diehl, K., Wex, H., and Schmidt, S.: Laboratory studies and numerical simulations of cloud droplet formation under realistic supersaturation conditions, J. Atmos. Ocean. Technol., 21, 876–887, 2004. Svenningsson, B., Rissler, J., Swietlicki, E., Mircea, M., Blide, M., Facchini, M. C., Deccesari, S.,
Fuzzi, S., Zhou, J., Mønster, J., and Rosenørn, T.: Hygroscopic growth and critical
super-20
saturations for mixed aerosol particles of inorganic and organic compounds of atmospheric relevance, Atmos. Chem. Phys., 6, 1937–1952, 2006,
http://www.atmos-chem-phys.net/6/1937/2006/.
Tang, I. N. and Munkelwitz, H. R.: Water activities, densities, and refractive indices, of aqueous sulfates and sodium nitrate droplets of atmospheric importance, J. Geophys. Res., 99(D9),
25
18801–18808, 1994.
Tang, I. N.: Chemical and size effects of hygroscopic aerosols on light scattering coefficients, J.
Geophys. Res., 101(D14), 19245–19250, 1996.
Twomey, S.: Pollution and the planetary albedo, Atmos. Environ., 8, 1251–1256, 1974.
VanReken, T. M., Ng, N. L., Flagan, R. C., and Seinfeld, J. H.: Cloud condensation nuclei
30
activation properties of biogenic secondary organic aerosol, J. Geophys. Res., 110, D07206, doi:10.1029/2004JD005465, 2005.
ACPD
9, 4653–4689, 2009Measurements of particle masses of
inorganic salt particles
M. Kuwata and Y. Kondo
Title Page
Abstract Introduction
Conclusions References
Tables Figures
◭ ◮
◭ ◮
Back Close
Full Screen / Esc
Printer-friendly Version
Interactive Discussion
water, J. Chem. Engi. Data., 12(3), 817–820, 1983.
Young, K. C. and Warren, A. J.: A reexamination of the derivation of the equilibrium supersatu-ration curve for soluble particles, J. Atmos. Sci., 49(13), 1138–1143, 1992.
Zelenyuk, A., Cai, Y., and Imre, D.: From agglomerates of spheres to irregularly shaped par-ticles: determination of dynamic shape factors from measurements of mobility and vacuum
5
aerodynamic diameter, Aerosol. Sci. Technol., 40, 190–217, 2006a.
ACPD
9, 4653–4689, 2009Measurements of particle masses of
inorganic salt particles
M. Kuwata and Y. Kondo
Title Page
Abstract Introduction
Conclusions References
Tables Figures
◭ ◮
◭ ◮
Back Close
Full Screen / Esc
Printer-friendly Version
Interactive Discussion Table 1.Ms,ρm, andνof (NH4)2SO4and NaCl.
Ms ρm ν
(NH4)2SO4 132.14 1.77 (g cm−3) 3
ACPD
9, 4653–4689, 2009Measurements of particle masses of
inorganic salt particles
M. Kuwata and Y. Kondo
Title Page
Abstract Introduction
Conclusions References
Tables Figures
◭ ◮
◭ ◮
Back Close
Full Screen / Esc
Printer-friendly Version
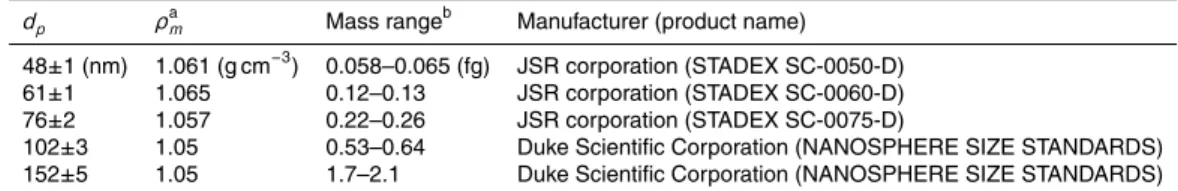
Interactive Discussion Table 2.List of PSL particles used for the calibration of the DMA and APM.
dp ρa
m Mass rangeb Manufacturer (product name) 48±1 (nm) 1.061 (g cm−3) 0.058–0.065 (fg) JSR corporation (STADEX SC-0050-D)
61±1 1.065 0.12–0.13 JSR corporation (STADEX SC-0060-D)
76±2 1.057 0.22–0.26 JSR corporation (STADEX SC-0075-D)
102±3 1.05 0.53–0.64 Duke Scientific Corporation (NANOSPHERE SIZE STANDARDS) 152±5 1.05 1.7–2.1 Duke Scientific Corporation (NANOSPHERE SIZE STANDARDS)
a
Density given by the manufacturers as a reference.
b
ACPD
9, 4653–4689, 2009Measurements of particle masses of
inorganic salt particles
M. Kuwata and Y. Kondo
Title Page
Abstract Introduction
Conclusions References
Tables Figures
◭ ◮
◭ ◮
Back Close
Full Screen / Esc
Printer-friendly Version
Interactive Discussion Table 3. Temperatures of the thermal gradient chamber in the CCNC.T1, T2, andT3
corre-spond to the temperatures at the top, middle, and the bottom of the chamber, respectively.
T inlet T1 T2 T3
∆T1 301.3±0.1 (K) 300.48±0.02 301.86±0.02 303.16±0.02
ACPD
9, 4653–4689, 2009Measurements of particle masses of
inorganic salt particles
M. Kuwata and Y. Kondo
Title Page
Abstract Introduction
Conclusions References
Tables Figures
◭ ◮
◭ ◮
Back Close
Full Screen / Esc
Printer-friendly Version
Interactive Discussion Table 4.Values ofdc veused for the calculation ofS.
∆T1 ∆T2
(NH4)2SO4 NaCl (NH4)2SO4 NaCl
ACPD
9, 4653–4689, 2009Measurements of particle masses of
inorganic salt particles
M. Kuwata and Y. Kondo
Title Page
Abstract Introduction
Conclusions References
Tables Figures
◭ ◮
◭ ◮
Back Close
Full Screen / Esc
Printer-friendly Version
Interactive Discussion Table 5. S values calculated using several thermodynamics models. See text for the input
parameters and descriptions of the models. “N/A” denotes that the thermodynamic data is not available.
∆T1 ∆T2
Model (NH4)2SO4 NaCl (NH4)2SO4 NaCl
Ideal solution approximation 0.110 (%) 0.115 0.207 0.214
Archer (1992) N/A 0.117 N/A 0.220
Clegg et al. (1996) 0.117 N/A 0.225 N/A
Pitzer and Mayorga (1973) 0.117 0.117 0.225 0.220
Young and Warren (1992) 0.118 N/A 0.228 N/A
Tang and Munkelwitz (1994) 0.135 N/A 0.256 N/A
Tang (1996) N/A 0.113 N/A 0.211
ACPD
9, 4653–4689, 2009Measurements of particle masses of
inorganic salt particles
M. Kuwata and Y. Kondo
Title Page
Abstract Introduction
Conclusions References
Tables Figures
◭ ◮
◭ ◮
Back Close
Full Screen / Esc
Printer-friendly Version
Interactive Discussion
0.3 lpm Compressed air
Room air
DMA Atomizer Diffusion dryer
CCNC CPC APM
CPC Compressor PAG HEPA filter MFC
to
exhau
s
t
0.5 lpm
mpmeasurement
CCN measurement
※PAG: pure air generator
MFC: mass flow controller
: valve
241Am
0.3 lpm Compressed air
Room air
DMA Atomizer Diffusion dryer
CCNC CPC APM
CPC Compressor PAG HEPA filter MFC
to
exhau
s
t
0.5 lpm
mpmeasurement
CCN measurement
※PAG: pure air generator
MFC: mass flow controller
: valve
241Am
ACPD
9, 4653–4689, 2009Measurements of particle masses of
inorganic salt particles
M. Kuwata and Y. Kondo
Title Page
Abstract Introduction
Conclusions References
Tables Figures
◭ ◮
◭ ◮
Back Close
Full Screen / Esc
Printer-friendly Version
Interactive Discussion
0.15
0.10
0.05
0.00
n
o
rm
al
iz
ed
co
n
c
en
tr
a
ti
o
n
0.70
0.60
0.50
0.40
m
p(fg)
PSL = 102 ± 3 nm
DMA (set) = 103.5 nm
ACPD
9, 4653–4689, 2009Measurements of particle masses of
inorganic salt particles
M. Kuwata and Y. Kondo
Title Page
Abstract Introduction
Conclusions References
Tables Figures
◭ ◮
◭ ◮
Back Close
Full Screen / Esc
Printer-friendly Version
Interactive Discussion
(a)
(b)
1.0
0.5
0.0
CCN
/CN
140 120
100 80
60
dme (nm)
NaCl
ΔT1
ΔT2 1.0
0.5
0.0
CCN
/CN
140 120
100 80
60
dme (nm) ΔT1
ΔT2 (NH4)2SO4
(a)
(b)
1.0
0.5
0.0
CCN
/CN
140 120
100 80
60
dme (nm)
NaCl
ΔT1
ΔT2 1.0
0.5
0.0
CCN
/CN
140 120
100 80
60
dme (nm) ΔT1
ΔT2 (NH4)2SO4
Fig. 3.CCN activation curves of (NH4)2SO4and NaCl particles under two experimental
ACPD
9, 4653–4689, 2009Measurements of particle masses of
inorganic salt particles
M. Kuwata and Y. Kondo
Title Page
Abstract Introduction
Conclusions References
Tables Figures
◭ ◮
◭ ◮
Back Close
Full Screen / Esc
Printer-friendly Version
Interactive Discussion
25x10
-320
15
10
5
0
n
o
rm
a
liz
e
d
c
o
n
c
e
n
tr
a
tio
n
0.5
0.4
0.3
0.2
0.1
m
p(fg)
NaCl (DMA = 70 nm)
ACPD
9, 4653–4689, 2009Measurements of particle masses of
inorganic salt particles
M. Kuwata and Y. Kondo
Title Page Abstract Introduction Conclusions References Tables Figures ◭ ◮ ◭ ◮ Back Close
Full Screen / Esc
Printer-friendly Version Interactive Discussion (a) (b) (c) (d) (e) (f) 1.04 1.02 1.00 χ 140 120 100 80 60
dme (nm) (NH4)2SO4 RUN1
RUN2 RUN3 RUN4 140 120 100 80 60 dve (n m ) 140 120 100 80 60
dme (nm) dve = 0.95 dme NaCl RUN1 RUN2 RUN3 RUN4 1.20 1.15 1.10 1.05 1.00 χ 140 120 100 80 60
dme (nm)
RUN3 RUN4 RUN1 RUN2 NaCl 1.80 1.75 1.70 1.65 1.60
ρeff
(g c m -3) 140 120 100 80 60
dme (nm) (NH4)2SO4
RUN3
RUN4 bulk density RUN1 RUN2 140 120 100 80 60 dve (n m) 140 120 100 80 60
dme (nm) dve = 0.99 dme (NH4)2SO4
RUN1 RUN2 RUN3 RUN4 2.2 2.0 1.8 1.6
ρeff
(g c m -3) 140 120 100 80 60
dme (nm) NaCl
RUN1 RUN2
RUN3
RUN4 bulk density
(a) (b) (c) (d) (e) (f) 1.04 1.02 1.00 χ 140 120 100 80 60
dme (nm) (NH4)2SO4 RUN1
RUN2 RUN3 RUN4 140 120 100 80 60 dve (n m ) 140 120 100 80 60
dme (nm) dve = 0.95 dme NaCl RUN1 RUN2 RUN3 RUN4 1.20 1.15 1.10 1.05 1.00 χ 140 120 100 80 60
dme (nm)
RUN3 RUN4 RUN1 RUN2 NaCl 1.80 1.75 1.70 1.65 1.60
ρeff
(g c m -3) 140 120 100 80 60
dme (nm) (NH4)2SO4
RUN3
RUN4 bulk density RUN1 RUN2 140 120 100 80 60 dve (n m) 140 120 100 80 60
dme (nm) dve = 0.99 dme (NH4)2SO4
RUN1 RUN2 RUN3 RUN4 2.2 2.0 1.8 1.6
ρeff
(g c m -3) 140 120 100 80 60
dme (nm) NaCl
RUN1 RUN2
RUN3
RUN4 bulk density
Fig. 5.ρeff,χ, anddveof (NH4)2SO4and NaCl particles measured using the DMA-APM system.
(a)ρeffof (NH4)2SO4,(b)χof (NH4)2SO4,(c)dveof (NH4)2SO4,(d)ρeffof NaCl,(e)χ of NaCl,