Numerical Investigations of Dynamic Stall Control
Florin FRUNZULICA*
,1,2, Horia DUMITRESCU
2, Alexandru DUMITRACHE
2*Corresponding author
*
,1“POLITEHNICA” University of Bucharest, Faculty of Aerospace Engineering
Polizu 1-6, RO-011061, Bucharest, Romania
[email protected]
2“Gheorghe Mihoc
-
Caius Iacob” Institute of Mathematical Statistics and
Applied Mathematics of the Romanian Academy
Calea 13 Septembrie no. 13, 050711 Bucharest, Romania
[email protected], [email protected]
DOI: 10.13111/2066-8201.2014.6.S1.8
Abstract: In this paper we investigated numerically the dynamic stall phenomenon and the possibilities to control it, with application to vertical axis wind turbines (for urban users). The Phenomenon appear at low tip speed ratio (TSR<4) and it has a great impact on structural integrity of the wind turbine and power performances. For this reason we performed a computational study of
dynamic stall around NACA 0012 airfoil in pitching motion at relative low Reynolds number (105).
Also, we performed the same analysis for four flow control methods: two passive (Gurney flap and slot) and two active (blowing jet on the rounded trailing edge and synthetic jet periodically activated). The Results are compared to those of an existing experimental case test.
Key Words: vertical axis wind turbine, dynamic stall, flow control, RANS.
1. INTRODUCTION
In the last years, for home users, the wind turbine with vertical axis (VAWT) has started to be more attractive due to its benefits in exploitation, the power range usually covering the domain ranging between 2 kW and 20 kW.
As compared to the widely used conventional Horizontal Axis Wind Turbines (HAWTs), VAWTs have many advantages, namely: they operate with wind blowing from any direction (thus simplifying the wind turbine system), they are designed for low wind speed, and operate at low/medium RPM, have lower vibration and small noise levels (being quieter in operation due to lower blade-tip speeds) and have lower manufacturing and maintenance costs [1].
But VAWTs also have many complicated aerodynamic issues, of which the dynamic stall is an inherent phenomenon at low values of the tip speed ratio (TSR < 4); it has a significant impact on vibration, noise, and power output of the VAWTs. In terms of aerodynamics, when the wind speed approaches to the speed of operation (for a low value of the tip speed ratio) the blade airfoil of VAWT exceeds the critical angle of incidence for static conditions. The angle of incidence varies quickly across the blade which works in dynamic stall condition.
These sudden variations of unsteady aerodynamic forces greatly enhance the unsteady loads on the blade and can be dangerous for the structural integrity of the blade [2].
The understanding of the fundamental aspects of the complex aerodynamics of VAWTs is crucial for a successful design of either small or large VAWTs, in particular at relatively low Reynolds number (Re ~ 105) appropriate to the urban/ suburban applications of VAWTs. The present study focuses on investigating the dynamic stall characteristics and dynamic stall control of unsteady flow around the blades on a fixed pitch straight bladed VAWT (H-type) using computational fluid dynamics (CFD). Due to the relative high aspect ratio of the VAWT blade, the simulation and analysis of the two dimensional (2D) modeling of VAWT blades give an efficient way to evaluate the blade profile performance away from the blade tips (median section of VAWT).
2. THEORETICAL BACKGROUND
The figure 1 shows a typical Darrieus straight-bladed fixed-pitch vertical axis wind turbine (H-type).
a. b.
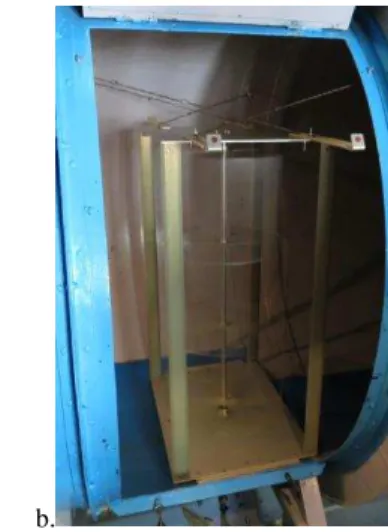
Figure 1. Darrieus type VAWT: (a) schematic view and (b) experimental VAWT in the wind tunnel of Faculty of Aerospace Engineering - UPB
Traditionally NACA 4-digits series have been employed for Darrieus-type VAWTs. The NACA0012 is almost used airfoil for H-type VAWT, but in the last time it shifted to thicker aerofoil NACA0015, NACA0018 and NACA0022, for a fast starting. The present study focuses on the analysis of NACA0012 airfoil profiled blades.
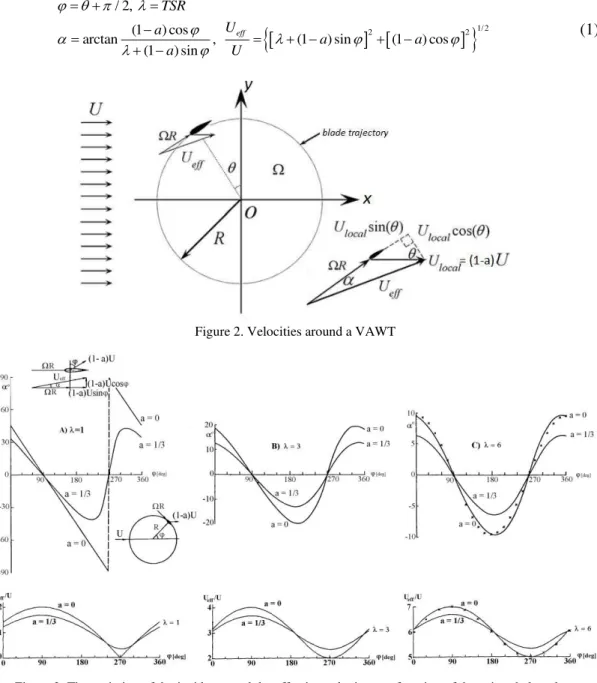
One feature of VAWT (H-type) is that the relative velocities perceived by the blade always change as the blade moves to different azimuthally positions . The figure 2 illustrates typical flow velocities around a rotating VAWT blade at a given azimuthally angle, where the velocity Ulocal represents the induced local velocity (a is the induction
factor - it can be function of azimuthally angle).
It should be noted that both the magnitude and the direction of the effective velocity (ideally flow) perceived by the blade, Ueff, change in a cyclic manner as the blade rotates
through different azimuthally angles. As a result, the aerodynamic loads exerted on the blade, change cyclically with .
1/ 22 2
/ 2,
(1 ) cos
arctan , (1 ) sin (1 ) cos
(1 ) sin
eff
TSR U a
a a
a U
(1)
Figure 2. Velocities around a VAWT
Figure 3. The variation of the incidence and the effective velocity as a function of the azimuthal angle
Since dynamic stall of VAWTs mainly occurs under the circumstances of low values of relative tip speed ratio (TSR < 4). It should be noted that the track of the general variation of the normalized incidence of the rotating blade is very similar to the sine-curve
( 01sin( ) ) for TSR3. Therefore, the investigation of the dynamic stall
At stall onset the airfoil angle of attack is slightly above the critical angle of attack and small separation begins on the upper side of the airfoil. At this stage increased lift is present without the penalties of increased drag or increased moment. There is a slight hysteresis in the lift coefficient as function of angle of attack.
Light stall occurs as a slightly higher max angle of attack is attained (figure 4.a). A separation bubble is present and the turbulent flow is prevalent after the bubble along with a thickening boundary layer. The trailing edge flow reversal is established and the viscous boundary layer thickness at the trailing edge flow separation is about the thickness of the airfoil. The behavior of light stall is the most sensitive to the effects of the airfoil shape, reduced frequency, and Reynolds number, which can influence the dominance of trailing edge or leading edge separation.
Deep stall occurs as the angle of attack greatly exceeds the static critical angle of attack (figure 4.b). The deep stall is characterized by the creation of a strong vortex at the leading edge. The vortex is shed from the boundary layer and moves downstream over the upper surface of the airfoil. As the vortex moves over the airfoil upper surface, the values of Cl, Cd
and Cm are dramatically increased over their static values. The viscous layer is now about the
thickness of one chord length of the airfoil. When the vortex leaves the trailing edge, a large increase in pitching moment known as moment stall and a sharp drop in lift take place. A large amount of hysteresis occurs during this part of the cycle.
a. b.
Figure 4. Schematic flow structures - light stall (a) and deep stall (b)
3. NUMERICAL SIMULATIONS
3.1 Case studied
We investigated numerically the case of the NACA0012 airfoil with a chord length c =15 cm, which executes a sinusoidal pitching motion ( ) 10t 015 sin(18.67 )0 t around the point located at 1/4 c from the leading edge (corresponding to a reduced frequency
/ 2 0.1
kc V ). The airfoil is placed in a free uniform flow with velocity V 14m s/ and turbulence intensity of about 1%, which corresponds to a Reynolds number 5
Re 1.35x10 . This case is based on the experimental investigations of the dynamic stall phenomenon described in ref. [8].
3.2 Numerical technique
The computational domain is composed by an inner circular domain which executes a rigid pitching motion around its center with angular velocity 0
( )t 15 18.67 cos(18.67 )t /180
,
For the present study, unsteady Reynolds averaged Navier-Stokes (RANS) model is the suitable approach to perform the dynamic stall flow simulations with an acceptable computational cost and, at least, reasonable accuracy. We used Ansys Fluent code for computational simulations [9]. Due to the incompressibility of the investigated flow, the unsteady pressure-based solver is chosen. All the governing equations for the solution variables, which are decoupled from each other, are solved sequentially and the SIMPLEC algorithm is applied as the pressure-velocity coupling algorithm. With respect to the discretization of the convection terms in the transport equations for the velocity and the turbulence quantities, second-order upwind schemes are utilized. The numerical time step is set to be 0.1 ms based on the characteristic time flow; after two complete oscillations the solution became periodical. Two turbulence models are used and evaluated in the present work: kSST (Shear Stress-Transport Turbulence Model) proposed by Menter [10] and
transitionSST proposed by Langtry & Menter [11].
3.3 Results
Figure 6 presents streamlines and static pressure contours at different angles of attack during the dynamic stall process (after the solution became periodic). In the upstroke phase we can observe that for range 0 0
5 11
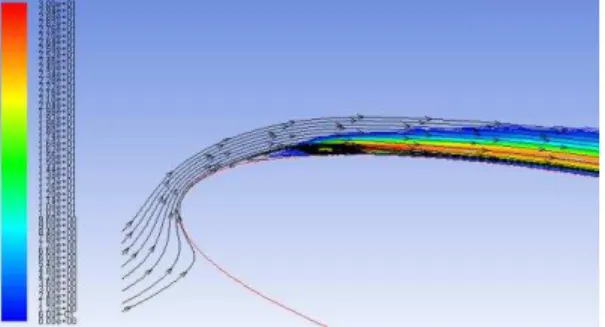
the flow is fully attached to the airfoil. At about 11.50a thin laminar separation bubble appears close to the leading edge; after bubble the boundary layer is turbulent (figure 5).
Figure 5. Turbulent viscosity ratio after laminar separation bubble
The laminar bubble grows in size and travels towards the trailing edge; at about 18.40 it has a length of 1/3 c on the upper surface and it has completely turned into leading edge vortex (transition SST model). For approx. 24.10 the leading edge vortex covers the whole upper surface of the airfoil; at this moment Cl reaches the maximum value. At 24.35
0 , the leading edge vortex begins detaching from the airfoil surface; it carries a pair of vortices at the leading edge and at 24.70, the trailing edge vortex has grown and the leading edge vortex becomes weak in intensity.
For the maximum angle of attack, the flow structure on the upper side contains a pair of vortices at the leading edge and a trailing edge vortex. The thin layer of reversed flow near the suction side is significantly unstable and easily breaks down into several small-scale vortices in upstroke phase. We observe that the used turbulence models give a good agreement with the experimental data, but the transition SST model performs best the maximum lift coefficient. Figure 7 shows a comparison between our numerical simulations and the results published in ref [8, 12].
pair of vortices covers the whole upper surface; at 21.50 the second vortex sheds in the wake; the last vortex generated on the suction surface grows in size and sheds at 100; under 100 the flow begins to reattach on the upper surface.
The turbulence models falls in the prediction of flow characteristics; the transition SST model gives with a reasonable accuracy, a better evaluation of the flow characteristics than
kSSTmodel.
Under the operating conditions in this case, a large difference of the solutions compared to the experimental data during the down stroke pitching phases is observed. The turbulence models haven't the ability to reproduce precisely the experiment in the down stroke phase; further investigation related to the turbulence models is required.
The computational results qualitatively capture well the features of the dynamic stall process, such as the formation, convection and shedding of the leading edge vortex as well as the secondary vortex, and these predictions provide information on the flow development.
= 10.000 = 15.130
= 21.060 = 24.310
= 25.000 = 24.490
= 23.000 = 21.900
= 10.000 = 4.870
= -0.130 = -4.490
Figure 6. Streamlines and static pressure contours (p ppref) at different angles of attack during the dynamic stall process, using transition SST model
a. c.
-1 -0.5 0 0.5 1 1.5 2 2.5 3
-10 -5 0 5 10 15 20 25 30
alpha (deg)
Cl
Trans. SST
Exp. k-w,SST
b. d.
0 0.2 0.4 0.6 0.8 1 1.2
-10 -5 0 5 10 15 20 25 30
alpha (deg)
Cd
Trans. SST
k-w, SST
Figure 7. Aerodynamic coefficients –Cland Cd: a. and b. from ref. [12]; c.and d. from present numerical
simulation
For the next computational cases we used the transition SST turbulence model.
4. DYNAMIC STALL CONTROL
4.1 Passive control
4.1.1 Gurney flap
attached perpendicularly to the lower surface of the airfoil in the vicinity of the trailing edge, with a height that can vary from 1% to 5%. The results showed a significant increment in lift compared to the baseline airfoil. This device increases the drag, but the percentage increase in lift is greater, resulting in an increased lift/drag ratio and therefore a better efficiency and performance. The flow structure downstream of a Gurney flap has a dual recirculation region that produces increasing lift due the significant turning of the upper-surface trailing-edge flow and reduces the form drag due the longer region of attached flow near the trailing edge.
Due to its simple geometry, the construction of the Gurney flap is simple and the implementation of this device is easily accomplished. Gurney flap has used in many applications, e.g., alleviation of airfoil static and dynamic stall, flutter control, and rotor blade control.
For numerical simulation the mesh is build on the same principles as the mesh for unchanged airfoil, at the trailing edge we put a Gurney flap perpendicularly to the lower surface of the airfoil, with h/c = 1 % and thickness h/ 5 (figure 8a). The flow is similar to the basic case, without flap [16, 17].
4.1.2 Thin channel or slot
Another passive device uses a slot between the lower-pressure and high-pressure points (near the separation point) on the upper surface of the airfoil (at positive angle of attack). The tendency of redistribution of the pressure will maintain the boundary layer attached to the upper surface.
Thus the form drag is reducing and the lift changes the orientation. Mounting on the channel a controlled hydraulic resistance we can control the separation point of the boundary layer. The advantage of this method is that it not imply additional source of power and can be used as a passive/active control of flow.
The settings are the same as for the previous cases. The figure 8b shows a detail of a thin channel; the channel of 1 mm thickness, connects the points placed at about 15% c and 75% c from the leading edge, on the upper surface of the airfoil.
During the dynamic stall, at a positive angle of attack, a laminar secondary flow occurs in the channel, between the second point, where there is high pressure (suction), and the first point where there is lower pressure (blowing) [16, 17]. As a result the flow remains attached to the upper surface until about 190 in upstroke regime.
After this value at the leading edge a vortex occurs, which deviates forward the flow blowing through the first orifice and creates two vortices near the leading edge. In down stroke phase, the vortex structures growth slowly and lift continues to increase until 21.150. The main vortex structure travels toward the leading edge, passes over the second orifice where the vortex intensity grows down. At about 00, in down stroke phase, the vortex leaves the upper surface of the airfoil.
a. Gurney flap b. Thin channel
Figure 8. Meshes for studied cases 4.2 Active control
4.2.1 Blowing jet at trailing edge
The circulation control is known as beneficial in increasing the bound circulation and hence the lift coefficient of the airfoil. This technology has been investigated both experimentally and numerically [18] in the last decade. Usually, the circulation control is implemented by tangentially blowing a small high-velocity jet over a highly curved surface, such as a rounded trailing edge. This causes the boundary layer and the jet to remain attached along the curved surface due to the Coanda effect (the tendency of a moving fluid to attach itself to a surface and flow along it) and causing the jet to turn without separation. The circulation control for the design of the wind turbine is advantageous because any increase in the magnitude of the lift force (while keeping drag small, and lift/drag high) will immediately contribute to an increasing in induced thrust and torque. If the flow over the airfoil separates at the leading edge, secondary Coanda jets are needed at the leading edge to maintain the flow attached to the airfoil.
The forced jets have a few disadvantages such as: complexity of internal piping from a source of pressure or vacuum, and the parasitic cost to produce this pressure. While the circulation control with forced jets has the potential for increased power generation, the power is consumed in the generation of the jet. A challenge is to reduce the power consumption to produce the jet and to use efficiently the jet to control the flow separation. For the numerical simulation we kept the geometry of the NACA0012 airfoil and at 92 % we create a rounded surface as a trailing edge; the ratio h/c is set to about 0.15% (h is the nozzle height) (figure 8c).
The jet has the impulse coefficient C 0.02 and remains attached a short distance on the rounded surface (low impulse of jet). At about 200 in the upstroke phase the leading edge vortex occurs which grows in size.
The lift increases quasi-linearly with the angle of attack up to 250 [16, 17]. In the down stroke phase, the leading edge vortex increases and as a consequence the lift increases slowly until the angle of attack reaches 200. After this value near the leading edge on the upper surface a pair of vortices appears, which increases in size and intensity while the main vortex grows down in intensity and travels to the leading edge. At about 50 the pair of vortices diffuses in the exterior flow and at about -30 the vortex that exists on the upper surface diffuses in the wake.
4.2.2 Blowing jet at trailing edge
Figure 9. The conceptual scheme of synthetic jet actuator [19]
Figure 10. Zoning of acoustic jets [19]
At a high level of excitation of the elastic membrane, the emanation of a regular fluid jet can be observed.
Because there is no additional contribution of mass, the stream lines should form a closed circulation as shown in figure 9. This phenomenon of acoustic jet stream through an orifice which is based on a highly excited acoustic diaphragm is well known for many years. In Figure 10 presents the four modes of circulation and turbulence that form around the acoustic device.
The dotted line corresponds to the area where the particle displacement amplitude is equal to the length of the aperture hole. At high excitation levels in region 4, the movement of the fluid particles extends beyond the opening providing sufficient time for the particles to form a vortex ring, with a circular aperture. This vortex is separated from the region of the orifice and determines a disturbance powered by the movements caused by convection vortex; thus synthetic jets are formed.
For the numerical simulation the settings are the same as for the previous cases, but the airfoil has a synthetic jet cavity, which is placed at about 15% c (figure 8d). The synthetic jet is activated for a period tsj=T/4 when
0
20
(sj=747 rad/s, approx. 119 Hz, where T=0.3365 s is the period of airfoil motion). The jet velocity in the cavity has the following variation in time (figure 11):
4
sj
/ 8
/ 2 [
/ ]V t sin
t T
m s (2)Figure 11. Period of synthetic jet activation
4.3 Aerodynamic coefficients
In Figure 12 the aerodynamic coefficients Cl, Cdand Cm are shown. We noted that for
current numerical simulations the momentum coefficient is negative when the angle of attack grows (the airfoil is placed in the XOY plane).
presents a too sharp drop-off of the Clbetween 25
0
and 100angle of attack. It’s clear that the Gurney flap produces more lifting effects than in the basic case and is a good alternative to amplify the dynamic stall.
Near the maximum angle of attack we observe a sudden variation of Cland Cd which
can produce structural vibrations.
The passive control with a thin channel assures (for a positive angle of attack) a quasi-linear dependence of a lift coefficient with angle of attack in upstroke phase. In down stroke phase the lift coefficient has a greater value than in upstroke phase. The drag coefficient is smaller than in the basic case and the pitching moment is greater in the down stroke phase.
The active control with a thin jet assures a positive Clduring the dynamic stall process,
d
C is smaller than in the basic case, and the pitching moment is greater in down stroke phase. We observe that the synthetic jet reduces the hysteresis of aerodynamic coefficients (figure 12). The high impulse of the jet produces a quick separation of vortex generated at the leading edge and the flow became unstable on the upper surface. More numerical simulations are necessary to identify an optimal position of the control device and the proper set of frequencies and amplitude for the membrane motion.
Figure 12. Aerodynamic coefficients for the controlled dynamic stall phenomenon
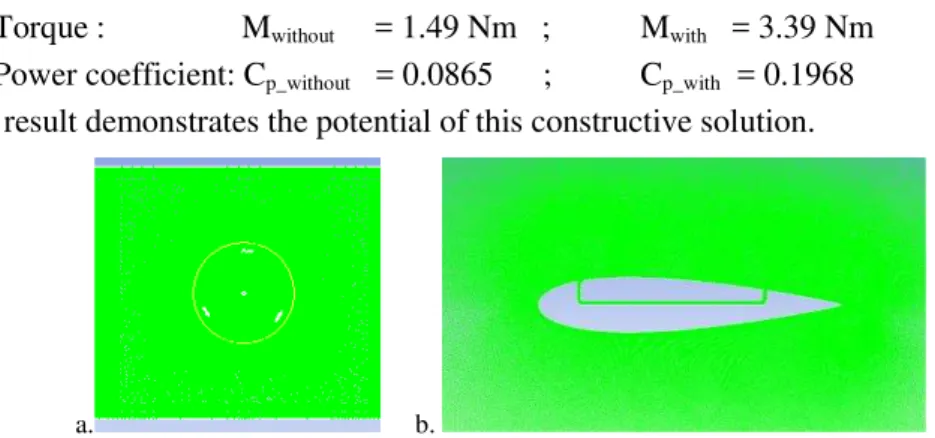
4.4 Test of passive control on a typical VAWT
Torque : Mwithout = 1.49 Nm ; Mwith = 3.39 Nm Power coefficient: Cp_without = 0.0865 ; Cp_with = 0.1968
(3)
The result demonstrates the potential of this constructive solution.
a. b.
Figure 13. Mesh of computational domain: (a) rotating domain of VAWT and (b) detail of blade with slot
a.
b.
Figure 14. Aerodynamic forces on a blade: without (a) and with (b) slot
5. CONCLUSIONS
In this paper, two RANS turbulence models, namely the k SST and the transition SST model have been used to simulate the fluid flow around a NACA 0012 airfoil executing a sinusoidal pitching, in the low Reynolds number fluid flow regime.
The two turbulence models employed can predict the experimental data with good accuracy in upstroke phase, but in down stroke phase the models cannot predict very well the experimental data, especially at high angle of attack. Our point of view is that the transition SST model performs best the dynamic stall process at relative low Reynolds.
We investigated four possibilities to enhance the dynamic stall phenomenon: Gurney flap, thin channel, blowing jet at trailing edge and synthetic jet using (transition) SST model. In our simplified study, all methods have potential to improve the phenomenon at low tip speed ratio for VAWTs. Gurney flap works very well in upstroke phase and the last two ensure an increase of the lift coefficient and pitching moment in the down stroke phase. The control with synthetic jet is inconclusive for our test case (the flow is unstable in time, being non-periodically).
We conclude that the combination of these methods can enhance/control the dynamic stall phenomenon in the starting phase of the VAWTs, and at low tip speed ratio increases performances for VAWTs.
ACKNOWLEDGEMENT
This work was realized through the Partnership programme in priority domains - PN II, developed with support from ANCS CNDI - UEFISCDI, project no. PN-II-PT-PCCA-2011-3.2-167.
REFERENCES
[1] H. Dumitrescu, V. Cardos, Al. Dumitrache, Aerodynamics of wind turbines, Romanian Academy Publihing House, 2001.
[2] H. Dumitrescu, V. Cardos, F. Frunzulica, Al. Dumitrache, Unsteady aerodynamics, aeroelasticity and
aeroacoustics for wind turbines. Romanian Academy Publishing House, ISBN 978-973-27-1394-5, 2007.
[3] W. McCroskey, L. Carr, K. McAlister, Dynamic stall experiments on oscillating airfoils, AIAA J. 14: 57–63, 1976.
[4] W. McCroskey, K. McAlister, L. Carr, S. Pucci, An experimental study of dynamic stall on advanced airfoil
sections. Summary of the experiment, Vol. 1. NASA Technical Memorandum 84245, 1982.
[5] C. Ferreira, H. Bijl, G. van Bussel, G. van Kuik, Simulating dynamic stall in a 2D VAWT: modeling strategy, verification and validation with particle image velocimetry data, J Phys Conf Ser;75, 2007.
[6] J. Leishman, Dynamic stall experiments on the NACA 23012 aerofoil, Exp Fluids, 9(1):49–58, 1990. [7] P. Wernert, W. Geissler, M. Raffel, J. Kompenhans, Experimental and numerical investigations of dynamic
stall on a pitching airfoil, AIAA Journal, 34: 982-989, 1996.
[8] T. Lee, P. Gerontakos, Investigation of flow over an oscillating airfoil, J Fluid Mech, 512:313–41, 2004. [9] *** Ansys Fluent 12. User’s guide. Fluent documentation.
[10] F. Menter, Two-equation eddy-viscosity turbulence models for engineering applications, AIAA J, 32 (8):1598–605, 1994.
[11] R. B. Langtry, F. Menter, Transition modeling for general CFD applications in aeronautics, AIAA Paper 2005-522, 2005.
[12] S. Wang, S. Ingham, D. B. MaLin et al., Numerical investigation on dynamic stall of low Reynolds number flow around oscillating airfoils, J Computer & Fluids, 39: 1529-1541, 2010.
[13] R. H. Liebeck, Design of subsonic airfoils for high lift, J. Aircr., 15: 547-561, 1978.
[15] R. Meyer, W. Hage, et al., Drag reduction on Gurney flap by three-dimensional modifications, J. Aircr., 43: 132-140, 2006.
[16] F. Frunzulica1, H. Dumitrescu, Al. Dumitrache, A numerical investigation on the dynamic stall of a vertical
axis wind turbine, Proc. Appl. Math. Mech. 13, 295 – 296, 2013.
[17] F. Frunzulica, H. Dumitrescu, Al. Dumitrache, B. Suatean, Control of dynamic stall phenomenon for vertical
axis wind turbine, AIP Conference Proceedings 1558, 1257, 2013.
[18] *** Applications of circulation control technologies, Progress in Astronautics and Aeronautics. vol. 214, Edited by Ronald D. Joslin and Gregory S. Jones, 2006.

![Figure 7. Aerodynamic coefficients – C l and C d : a. and b. from ref. [12]; c. and d](https://thumb-eu.123doks.com/thumbv2/123dok_br/16315058.187103/7.744.105.648.386.782/figure-aerodynamic-coefficients-c-l-c-d-ref.webp)
![Figure 10. Zoning of acoustic jets [19]](https://thumb-eu.123doks.com/thumbv2/123dok_br/16315058.187103/10.744.87.665.667.833/figure-zoning-of-acoustic-jets.webp)