Abstract— the purpose of this study is to clarify the mechanism
of how software engineering capabilities relate to the business performance of IT vendors in Japan. To do this, we developed a structural model using
M
anuscript received July 6, 2007. Y
asuo Kadono is with Management Scienc e Institute Inc., 5-31-6 Taishido, S
etagaya-ku, Tokyo 154-0004, JAPAN (+81-3-3412-7617; e-mail:
k
analysis, we found that software engineering excellence (SEE) has a direct positive impact on business performance measured by operating profit ratio.
II. R
ESEARCH METHOD
A. Structural Model
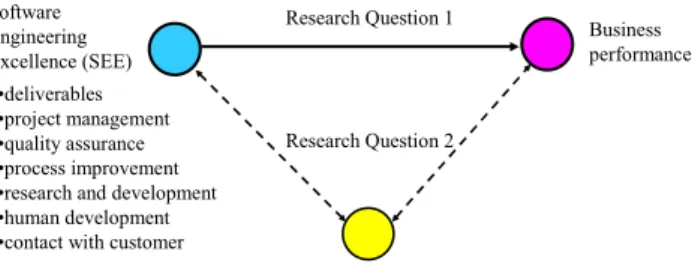
We assume the following research questions on the relationship among the three primary indicators (i.e., software engineering, business performance, and competitive environment) in Fig. 1.
Research question 1: the "software engineering excellence (SEE)" has a positive impact on "business performance". Research question 2: the "competitive environment" directly and indirectly (i.e., via SEE) affects "business performance".
Here, “software engineering excellence (SEE)” expresses the extent to which IT vendors can put software engineering into practice. SEE is a measurement tool for evaluating the overall capabilities of software engineering of IT vendors from the viewpoints of deliverables, project management, quality assurance, process improvement, research and development, human development, and contact with customers.
A Survey on Management of
Software Engineering in Japan
Research Question 1 Business performance Software Engineering Excellence (SEE) Competitive environment •deliverables •project management •quality assurance •process improvement •research and development •human development •contact with customer
Research Question 2
Fig. 1: Structural model.
“Business performance” expresses the overall business performance of individual IT vendors, such as profitability, growth, and management efficiency. “Competitive environment” expresses the company profile of IT vendors as well as the business environment in which the vendors work, e.g., number of software engineers, business model, and average age of employees.
B. Measurement Model
Our measurement model of software engineering excellence (SEE) was developed through the interviews with over 20 experts in the industry and literary searches [1][3][4][9]. The SEE measurement model has a hierarchical structure with three layers: observed responses, seven detailed concepts, and SEE as a primary indicator, as we developed in our research on IT management effectiveness [5, 6].
The observed responses such as readiness for state-of-the-art technology, moral support, and clarification of user
specification are newly added to the measurement model as a result of feedback from the respondents to SEE2005 and interviews with the experts.
- Software engineering excellence (SEE)
- deliverables: achievement ratio of quality, cost, speed, and productivity
- project management: project monitoring, assistance to project managers, project planning capability, ratio of PMP(Project Management Professional)
- quality assurance: organization, method, review, testing, guideline, management of outsourcers
- process improvement: data collection, improvement of estimation, assessment method, CMM/CMMI [2]
- research and development: strategy, organization, sharing technological skills, learning organization, development methodology, intellectual assets, commoditized software, readiness to state-of-the-art technology,
- human development: training hours, skill development systems, incentive schemes, measure of human development, moral support
- contact with customers: ratio of prime contracts, scope of service offered, direct communication with customer’s top
management, deficit prevention, clarification of user specification
In addition to SEE, we assume two primary indicators, business performance and competitive environment as follows.
- Business performance
- profitability: operating profit ratio - growth: annual sales growth
- management efficiency: return on equity - Competitive environment
- number of software engineers including programmers - average age of employees
- business model: ratio of customized development, ratio of development based on mainframe computer, ratio of prime contractors
- aspirations of senior managers: sales growth orientation, profitability orientation, business model innovation orientation, spirit of challenge
- corporate culture: information sharing and agility
III. SURVEY ON SOFTWARE ENGINEERING EXCELLENCE
To research on the questions in the previous section, we conducted a new survey on Software Engineering Excellence (SEE2006). In this survey, we designed a questionnaire on the practice of software engineering and the nature of the company. This questionnaire was sent to CEOs of 537 major Japanese IT vendors with over 300 employees, and was then distributed to the departments in charge of software engineering. Responses were received from 86 companies and valid responses totaled 78 at SEE2006 (response rate was 15%), while valid responses were 55 at SEE2005 (response rate was 23%). Profitability measured by operating profit ratio of 72 (36) vendors was available at SEE2006 (SEE2005).
Fig. 2 shows a histogram of the deviations of software engineering excellence (SEE) of 78 IT vendors. We consider that the result of SEE analysis is appropriate for further analyses since some scores of SEE are reasonable in light of the results of the interviews with the individual respondents and since the histogram has an almost unimodal distribution.
Fig. 3 is a box-and-whisker plots which shows that the median software engineering excellence (SEE) of vendors who were originally users of IT (2) is higher than that of vendors who were originally makers of IT (1). Also, the median SEE of vendors who were originally vendors of IT (1) is higher than that of independent vendors (3). However, the maximum SEE of 3 is higher than that of 2. This tendency in SEE206 is the same as that in SEE2005 except the slight order reversal of the median SEE between 1 and 2.
SEE
Fig. 3: SEE by origin of vendors (1: makers, 2: users, 3: independent).
The median achievement ratios of quality, cost, and delivery are higher than 70% (Fig 4). Achievement level of delivery is the highest of quality, cost, and delivery. This tendency was also observed in the previous study at SEE2005 [7].
Fig. 4: Achievement ratio of quality, cost, and delivery. Regarding training hours, the medium hours for new recruits is almost 500 hours per year, while the medium
hours for software engineers except new recruits is 40 hours per year (Fig.5 ).
Fig. 5: Training hours.
(left side: new recruits, right side: except new recruits)
IV. PRELIMINARY ANALYSES
To construct a path model analysis on the research questions in the next section, we conducted the following preliminary analyses of relationship among indicators such as SEE, business performance, and competitive environment.
Fig. 6 shows that vendors who have a larger number of software engineers tend to score higher for software engineering excellence (SEE). This tendency was similar to that of the previous study at SEE2005 [7].
SEE
Number of software engineers (log)
Fig. 6: Relationship between number of software engineers and software engineering excellence
2.0 2.5 3.0 3.5 4.0
Fig. 7 shows that vendors whose employees are older tend to score higher for software engineering excellence (SEE).
SEE
Average age of employees
Fig. 7: Relationship between average age of employees and SEE.
Fig. 8 shows that vendors who develop more custom software tend to score lower for software engineering excellence (SEE).
SEE
0 20 40 60 80 100
-2
-1
0
1
2
3
Ratio of custom development
Fig. 8: Relationship between ratio of custom development and SEE.
Fig. 9 shows that vendors whose employees are older tend to be less profitable. This relationship is weaker than that of the previous study at SEE2005. The reason for this change is thought to be recovery of revenue as well as rejuvenation of the software industry in Japan. However, we need further investigation of the reasons.
Profitability(%)
Average age of employees
Fig. 9: Relationship between average age of employees and profitability.
Fig. 10 shows that vendors who have a higher software engineering excellence (SEE) tend to be slightly more profitable (i.e., higher operating profit ratio) based on the 72 vendors whose data of business performance is available.
Profitability(%)
SEE
Fig. 10: Relationship between SEE and profitability.
-2 -1 0 1 2 3
-10
-5
0
5
1
0
1
5
2
0
28 30 32 34 36 38 40 42
-1
0
-5
0
5
1
0
1
5
2
0
28 30 32 34 36 38 40 42
-2
-1
0
1
2
3
WCECS 2007, October 24-26, 2007, San Francisco, USA
V. PATH MODEL ANALYSIS
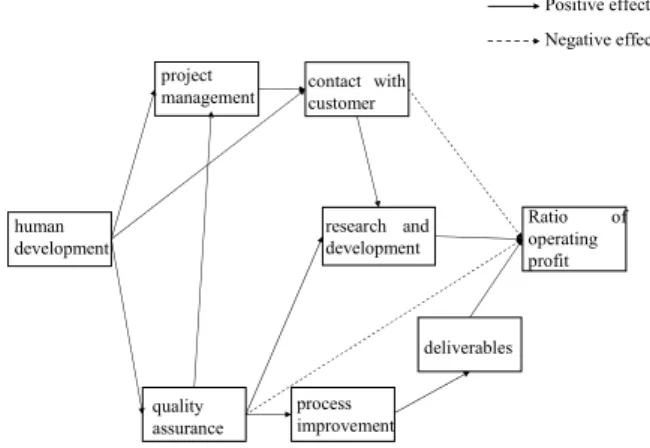
On the basis of the results of the preliminary analyses, we constructed a path model that consists of all seven factors of software engineering excellence (SEE) as well as the selected factors for business performance and competitive environment in section 2, owing to the constraints of sample size, statistical significance, and realistic interpretation, e.g., average age of employees, number of software engineers, ratio of development based on mainframe computer, ratio of prime contractors, ratio of manufacturer customers, and ratio of operating profit.
By a trial and error method, we succeeded in constructing a well-fitted path model (CFI = 1.0), where all the existing path coefficients are significant at the 5% level (Fig. 11 and Fig.12).
human development
quality assurance
project management
process improvement
contact with customer
research and development
deliverables
Ratio of operating profit
Positive effect
Negative effect
Fig. 11: Result of path analysis among factors of SEE and business performance.
Table 1: Coefficients of paths of Fig.11
From
on deliverables, while it has negative impact on human development and research and development.
- The ratio of prime contractor has positive impact on customer contact, quality assurance, and research and development.
- Average age of employees has positive impact on research and development, while it has negative impact on deliverables.
- The ratio of development based on mainframe computer has positive impact on process improvement and project management, while it has negative impact on deliverables, the ratio of operating profit, and customer contact.
Table 2: Coefficients of paths of Fig.12
From