www.biogeosciences.net/7/3447/2010/ doi:10.5194/bg-7-3447-2010
© Author(s) 2010. CC Attribution 3.0 License.
Biogeosciences
Soil CO
2
efflux of a larch forest in northern Japan
N. Liang1, T. Hirano2, Z.-M. Zheng3, J. Tang4, and Y. Fujinuma1,5
1Center for Global Environmental Research, National Institute for Environmental Studies, Tsukuba, Ibaraki 305-8506, Japan 2Research Faculty of Agriculture, Hokkaido University, Sapporo 060-0809, Japan
3East China Normal University, Shanghai 200062, China
4The Ecosystems Center, Marine Biological Laboratory, Woods Hole, MA 02543, USA 5Tottori University of Environmental Studies, Tottori 689-1111, Japan
Received: 22 September 2009 – Published in Biogeosciences Discuss.: 22 February 2010 Revised: 15 October 2010 – Accepted: 29 October 2010 – Published: 5 November 2010
Abstract. We had continuously measured soil CO2 efflux (Rs) in a larch forest in northern Japan at hourly intervals for the snow-free period in 2003 with an automated chamber system and partitionedRsinto heterotrophic respiration (Rh) and autotrophic respiration (Rr) by using the trench method. In addition, we applied the soil CO2 concentration gradi-ents method to continuously measure soil CO2profiles under snowpack in the snowy period and to partitionRsinto topsoil (Oa and A horizons) CO2efflux (Ft) with a depth of 0.13 m and sub-soil (C horizon) CO2efflux (Fc). We found that soil CO2effluxes were strongly affected by the seasonal variation of soil temperature but weakly correlated with soil moisture, probably because the volumetric soil moisture (30–40% at 95% confidence interval) was within a plateau region for root and microbial activities. The soil CO2effluxes changed sea-sonally in parallel with soil temperature in topsoil with the peak in late summer. On the other hand, the contribution ofRrtoRs was the largest at about 50% in early summer, when canopy photosynthesis and plant growth were more ac-tive. The temperature sensitivity (Q10) ofRrpeaked in June. Under snowpack, Rs was stable until mid-March and then gradually increased with snow melting. Rs summed up to 79 gC m−2during the snowy season for 4 months. The an-nualRs was determined at 934 gC m−2y−1in 2003, which accounted for 63% of ecosystem respiration. The annual contributions ofRhandRrtoRswere 57% and 43%, respec-tively. Based on the gradient approach, Rs was partitioned vertically into litter (Oi and Oe horizons) with a depth of 0.01–0.02 m, topsoil and sub-soil respirations with propor-tions of 6, 72 and 22%, respectively, on an annual basis. The vertical distribution of CO2efflux was consistent with those of soil carbon and root biomass.
Correspondence to: N. Liang
1 Introduction
The world’s soils contain about 1550 Pg of organic car-bon, which is more than twice the amount in the atmosphere (IPCC, 2007). Forests worldwide contain about 45% of the global carbon stock, a large part of which is in the forest soils. Recently, Bond-Lamberty and Thomson (2010) esti-mated that the global soil CO2efflux, widely referred to as soil respiration (Rs), was about 98 Pg C y−1 in 2008 based on a five-decade record of chamber measurements, which is more than 13 times the rate of fossil fuel combustion (IPCC, 2007), indicating that 20–40% of the atmospheric CO2 circu-lates through soils every year. Overall,Rsis the largest com-ponent of ecosystem respiration (RE) and the second largest flux in the global carbon cycle after gross primary produc-tion (GPP).Rsis therefore a key process that is fundamental to our understanding of the terrestrial carbon cycle (Davidson and Janssens, 2006). A relatively small change in the carbon flow into or out of soils can strongly influence the global car-bon cycle. For example, it was reported that the globalRs increased by 0.1 Pg C y−1 between 1989 and 2008 (Bond-Lamberty and Thomson, 2010), and that the positive feed-back from this enhancement ofRsby global warming would further raise atmospheric CO2concentration by 20-224 ppm by 2100 and resulting higher CO2 levels would lead to an additional temperature increase ranging from 0.1 to 1.5◦C
(Friedlingstein et al., 2006; IPCC, 2007).
Because Rs has high spatial variability and the soil medium is not easily accessible,Rs cannot be measured by large-scale remote sensing. FLUXNET has become an ef-fective network for observing carbon sequestration or loss by global terrestrial ecosystems by the eddy covariance tech-nique (Luyssaert et al., 2008). Unfortunately, the use of the eddy covariance technique for measuring soil CO2efflux, es-pecially below forest canopies, is often hampered by rela-tively low wind speeds (Drewitt et al., 2002) as well as by an abundance of understory vegetation (Lee, 1998; Janssens et al., 2001a). Therefore, to validate nocturnal, sub-canopy, and bad-weather (e.g., rainy period) eddy covariance mea-surements as well as the partition of the net ecosystem pro-duction (NEP), the flux research community have used au-tomated chamber systems, which provide continuous (i.e., half-hourly or hourly) measurements ofRs(Gaumont-Guay et al., 2009; Jassal et al., 2007). Moreover, the automated continuous measurements ofRs (Goulden and Crill, 1997; Savage and Davidson, 2003; Liang et al., 2004) provide in-sights about ecosystem processes, which were not possible to explore before (Vargas et al., 2010).
Although larch forests are an important forest biome in Northeast Eurasian continent (Gower and Richards, 1990), continuous measurements ofRs are quite limited (Liang et al., 2004; Kim et al., 2005a). In this study, we continuously measuredRsat hourly intervals with an automated chamber system and partitioned it into heterotrophic and autotrophic soil respirations using the trench method in a larch forest in northern Japan. In addition, we applied the gradient method to measureRs under snowpack in the winter season and to determine the vertical distribution of soil CO2 efflux. The objectives of this study are to investigate (1) seasonal vari-ations in soil CO2 efflux, (2) responses of soil CO2 efflux to temperature, moisture and rain events, (3) relative contri-butions of heterotrophic and autotrophic respirations to total
Rs, (4) vertical distribution of soil CO2efflux and (5) contri-bution ofRsto RE, in a larch forest.
2 Site description
The study site is the Tomakomai Flux Site (42◦44′N, 141◦31′E), a larch plantation in Tomakomai National Forest, southern Hokkaido, Japan. The altitude of the site is 125 m and the terrain is essentially flat with a gentle slope of 1–2◦. This site was one of the core sites of AsiaFlux network. The tower based eddy CO2 flux had been measured using both open-path and closed-path systems since August 2000 un-til the catastrophic damage by a typhoon in September 2004 (Hirano et al., 2003a; Hirata et al., 2007).
2.1 Vegetation characteristics
The forest was a 45-year-old Japanese larch (Larix kaempferi Sarg.) plantation, interspersed with naturally generated Japanese spruce (Picea jezoensis Sieb. et Zucc.) and mixed broad-leaved species (Betula spp.). In 2001, for trees with breast height diameter (DBH) larger than 0.05 m, stand density was 1087 stems ha−1 and basal area density was 23.2 m2ha−1, of which larch accounted for 81%. The for-est canopy was about 15 m in height, and the overstory canopy leaf area index (LAI) reached its peak at 5.6 m2m−2. The forest floor was densely covered with perennial buck-ler fern (Dryopteris crassirhizoma) but lacked other under-story species and moss. In late June, the average height, biomass, and LAI of the understory species were 0.5 m, 2.7 t ha−1, and 3.6 m2m−2, respectively. Defoliation started in mid-October, and the soil was covered by snow for about 4 months from mid-December to mid-April. Snow depth was 0.6 to 1.0 m in midwinter.
2.2 Climate
Climate records between 1979 and 2000 from two weather stations of Japan Meteorology Agency about 10 km away from the study site, Tomakomai and Shikotsuko, showed that the mean annual precipitation was approximately 1500 mm, and the mean annual temperature was 7.1◦C, with the mean monthly temperature ranging from−4.5◦C in January to 19.8◦C in August.
2.3 Soil characteristics
Relay Driver P
IRGA
Datalogger
Chambers WT F1
S R
Data
Program
Signal
F2 Air tank
Power
Charger
Battery
PAir
2
Fig. 1. Schematic illustration of the multi-channel automated cham-ber system for continuous measurement of soil CO2 efflux. The dashed square means a water proofed aluminum casing (Field Ac-cess Case). Bold arrows indicate the direction of chamber air-flow. Abbreviations: Power = DC 12 V or AC 85–240 V for the system; Charger = AC-DC convert for charging and controlling a 12 V (7.2 A·h) lead-acid battery that drives the system; Cmp = air compressor;PAir= compressed air from the air tank to the pneu-matic cylinders for opening and closing the chamber lids; F2= air filter (0.5 mm mesh); S = sample air from the chamber; P = sample pump; WT= water trap; F1= air filter (1 µF mesh); IRGA = infrared gas analyzer;R= sampled air returned to the chamber.
3 Soil CO2efflux measurement
3.1 Automated chamber system
Liang et al. (2003) designed a multi-channel automated chamber system that applied a steady-state technique to con-tinuously measure Rs. However, the pressure inside the chamber was 0.22 Pa higher than that outside the chamber, which is likely to lead to underestimation of the actual Rs (Fang and Moncrieff, 1998). Therefore, we have modified and improved this system using a flow-through, non-steady-state design. In brief, the system comprises a control unit that is contained within a waterproof field access case (0.70 m long×0.50 m wide×0.35 m high), and can drive maximum 24 automated chambers. The main components of the con-trol unit are an infrared gas analyzer (IRGA, 820; LI-COR, Lincoln, NE, USA), a datalogger (CR10X, Campbell Scientific Inc., Logan, UT, USA), a gas sampler, and an air compressor (Fig. 1). The automated chambers (0.9 m long ×0.9 m wide ×0.5 m tall) are constructed of clear PVC (1 mm thick) glued to a frame constructed from plastic-coated
steel pipe (30-mm-square cross-section) (Fig. 2a). Between measurements, the two sections of the chamber lid are ver-tically raised to allow precipitation and leaf litter to reach the enclosed soil surface, thus keeping the soil conditions as natural as possible. The chamber lids are raised and closed by two pneumatic cylinders (SCM-20B, CKD Corp., Nagoya, Japan) at a pressure of about 0.2 MPa, which is gen-erated by a micro-compressor (M-10, Hitachi Ltd., Tokyo, Japan; Fig. 1). During the measurement, the chamber is closed and the chamber air is mixed by two micro-blowers (MF12B, Nihon Blower Ltd., Tokyo, Japan). The chamber air is circulated through the IRGA by a micro-diaphragm pump (5 L min−1; CM-50, Enomoto Ltd., Tokyo, Japan), and CO2concentration is monitored by the IRGA. The average power consumption of the whole system is 13 W; thus, the system can be continuously driven by three 75-W solar cells with three 100-A·h deep-cycle batteries.
In June 2002, we installed 16 chambers at the site ran-domly on the forest floor within a circular area 40 m in di-ameter (Fig. 2a). The 16 chambers were divided into two groups, each with 8 chambers. The first group of cham-bers was used to measure the total soil CO2 efflux (Rs). Understory vegetation inside the chambers was clipped pe-riodically during the growing season. The second group was used to measure heterotrophic respiration (Rh), and the chambers were installed in 1×1 m root exclusion plots. Trenches with a width of 0.005 to 0.01 m were dug down to 0.5 m along the plot boundaries using a root-cutting chain-saw (CSVN671AG, Kioritz Co. Ltd., Tokyo, Japan) and then PVC sheets (4 mm thick) were installed in the trenches to a depth of 0.50 m to prevent root penetration.
Over the course of an hour, the 16 chambers were closed sequentially by a home-made relay board controlled by the datalogger (Fig. 1). We set the sampling period for each chamber to 225 s. Therefore, the chambers were open for 94% of the time: during each 1-h cycle each chamber was open for 56.25 minutes and closed for 3.75 minutes. Thus, most of rainfall and leaf litter could enter the chambers, and the interior of each chamber had good exposure to any at-mospheric turbulence. Soil temperature at 0.05 m depth in-side each chamber was measured with home-made thermo-couples and volumetric soil moisture at 0.10 m depth was monitored with TDR sensors (CS615, Campbell Scientific), and recorded by the datalogger via a multiplexers (AM25T, Campbell Scientific). Moreover, air pressure at 0.30 m height around the center of the measurement plots was monitored with a pressure transducer (PX2760, Omega Engineering, Inc., Stamford, CT, USA). The datalogger acquired outputs from the IRGA and the other sensors at 1-s intervals and recorded the averaged values every 5 s. Soil CO2efflux (Rs, µmol m−2s−1) was calculated with the following equation:
Rs=
V P (1−W )
RST δC
Fig. 1.
Fig. 2. (a) Image of the multi-channel automated chamber systems installed at the site and (b) a set of infrared gas analyzers (IRGA sensors) vertically installed at different depths of soil.
whereV is the effective chamber-head volume (m3), S is the measured soil surface area (m2), P is the air pressure (hPa),T is the air temperature (K), andWis the water vapor mole fraction (mmol mol−1) inside the chambers;δC/δt is the rate of change in the CO2 mole fraction (µmol mol−1 s−1) calculated by the least-square method, andRis the gas constant (8.314 Pa m3K−1mol−1). Note that the pressure is not the pressure inside the IRGA cell but the pressure inside the chambers and we assumed that there was null pressure difference between the inside and outside of the chambers. 3.2 Soil CO2gradient system
We applied the soil CO2 gradient method for continuous measurements of topsoil and subsoil CO2effluxes (Hirano et
al., 2003b; Liang et al., 2004; Tang et al., 2003). We inserted CO2 probes (18.5 mm diameter, 155 mm long) of IRGAs (GMT222, Vaisala, Helsinki, Finland) into the soil to directly measure soil CO2concentration profiles. The probes were enclosed in polytetrafluoroehylence (PTFE) socks, which are porous water proofing (Liang et al., 2004), to prevent damage by rainwater, and then they were put into PVC (inner diame-ter 22 mm) casings to measure CO2 concentrations at only specific soil depths. A fine (0.5 mm) mesh stainless steel screen was set at the opening at the bottom of the casing to prevent soil particles from entering the casing. In addi-tion, temperature and pressure were measured in each casing with a thermocouple and a pressure transmitter (MPX4115, FreeScale Semiconductor, Austin, Texas, USA) via a plastic tube connected to the casing, respectively.
In June 2002, we installed two sets of sensors each with four CO2probes at two locations 0.60 m apart at 0, 0.02, 0.11 and 0.13 m depths. The measuring ranges of the probes were 0–2000 ppm for 0 and 0.02 m and 0-10000 ppm for 0.11 and 0.13 m. The probes were vertically installed to minimize soil disturbance (Fig. 2b). We defined 0 m depth as the soil sur-face under the litter layer (Oi and Oe horizons). To avoid heating of the soil adjacent to the probes, all probes were powered on hourly at 24 min past the hours, and operated for only 7 min. After warm-up of 5 min, CO2concentration was measured for 2 min and recorded every 10 s with a datalog-ger (CR10X). The temperature and pressure inside the cas-ing were recorded simultaneously. Soil temperature at 0.02, 0.05, 0.10 and 0.15 m depths and volumetric soil moisture at 0.10 m depth were also recorded. The probes were removed for drying and calibration every two months.
The two replicates of CO2concentration were averaged at each depth and corrected for temperature and pressure ac-cordingly to the manufacturer’s instruction and converted to CO2molar density (µmol m−3) . Then, soil CO2efflux (Fs) was calculated by Fick’s first law under the assumption of horizontal homogeneity,
Fs= −Ds
∂C
∂z (2)
was calculated using Campbell’s function (Campbell, 1985):
Ds=D0B
T
soil+273.15 273.15
1.751013 Ps
, (3)
where D0 is the CO2 diffusion coefficient in air (1.39×10⁻⁵m2s−1) at 1013 hPa and 273.15 K, T
soil is the soil temperature (◦C) at 0.02 or 0.10 m depth, andPsis the air pressure (hPa) inside the sensor casing. B is the rela-tive soil gaseous diffusion coefficient, which was determined from air-filled porosity (e) of soil using their power relation-ship (B=0.82e2.03,r2=0.94) (Currie, 1960). The relation-ship was obtained with undisturbed soil cores by the diffu-sion chamber method (Currie, 1960). ewas determined as residual of the volume fractions of solid and water (θ). The
Dsin A horizon fluctuated between 0.015 and 0.045 cm2s−1 with soil temperature and moisture, which is in the middle range of 0.022 to 0.052 cm2s−1for Japanese forest soils (42 ecosystems) (Ishitsuka and Sakata, 2006).
3.3 Data analysis
Hourly measurements of the 8 chambers used for each pro-cess (Rs andRh) were averaged to obtain the mean efflux, and coefficients of variation (CV) were calculated to show spatial variation. To examine the temperature response of soil CO2efflux, we performed a regression analysis using an exponential model:
Rs=aebTsoil, (4)
whereRsis the CO2efflux at soil temperatureTsoilat a depth of 0.05 m,ais the efflux at 0◦C, andb is the sensitivity of the soil CO2efflux to temperature. The value ofb was also used to calculate theQ10coefficient:
Q10=e10b, (5)
which is the relative increase in CO2efflux with a 10◦C in-crease in soil temperature.
Although chamber data were missing for the snow-covered period for 127 days from January 1 to April 17 and December 12 to December 31 in 2003, more than 95% of data were available for the snow-free period. Also, more than 95% of gradient flux data were available throughout the year. The data gaps were filled withRsestimated from Eq. (4) by using soil temperature. Root respiration (Rr) was estimated by subtractingRhfromRs.
4 Results and discussion
4.1 Seasonal variations in soil CO2efflux (Rs)
Rs measured by both the chamber and gradient systems showed notable seasonal patterns (Fig. 3). After snow disap-pearance on 17 AprilRsincreased rapidly until around DOY
Day of year 2003
0 100 200 300
D aily s o il e ff lu x ( g C m -2d -1) 0 2 4 6
8 Soil efflux
Topsoil efflux b c Dail y s o il ef fl ux (g C m -2d -1) 0 2 4 6
8 Soil effluxHeterotrophic respiration
Rainfall (vertical bars)
S o il te mp er at u re ( oC) 0 20 40 60 80 0 20 40 60 80 Soil temperature Soil moisture S o il mo is tu re ( % ) Dail y ra in fa ll (mm) a
Fig. 3. Seasonal variations in daily means or sums of (a) soil tem-perature at a depth of 0.05 m (solid line), precipitation (bars) and volumetric soil moisture at a depth of 0.1 m (dashed line), (b) to-tal soil respiration (solid line) and heterotrophic respiration (gray dashed line) measured with the automated chamber system, (c) and total soil respiration (solid line) and topsoil (Oaand A horizons) ef-flux (gray dashed line) measured with the gradient system. For the chamber method, measurements were conducted between DOY 108 and 345. Other values were estimated by using theQ10function of Eq. (4).
(day of year) 220 with soil temperature. Rs remained high during late summer between DOY 220 and 260. PeakRs val-ues were about 6 and 7 gC m−2d−1by the chamber and the gradient systems, respectively. Then,Rs decreased steadily with soil temperature until the ground was covered by snow. The pattern in the snow-free season is consistent with that in 2001 (Liang et al., 2004) and RE patterns with the peak in August (Hirata et al, 2007). Heterotrophic respiration (Rh) showed a similar seasonal variation to that ofRs. Also, top-soil respiration (Ft) varied almost in parallel withRs.
0 2 4 6 8 10
y = 0.868 * e^(0.114x) R2= 0.916
y = 0.399 * e^(0.105x) R2= 0.741
y = 0.438 * e^(0.125x) R2= 0.944
(a)
0 2 4 6 8
0 5 10 15 20
y = 0.61 * e^(0.148x) R2= 0.856
y = 0.418 * e^(0.131x) R2= 0.81
(b)
Soil temperature at 5-cm depth ( OC)
So
il
C
O
2
e
ffl
ux
(
mo
l m
-2 s -1)
Fig. 4. Relationships between soil temperature at a depth of 0.05 m and (a) total soil CO2efflux (black symbols and line), heterotrophic (red symbols and line) and root (green symbols and line) respira-tions measured by the chamber method, and (b) total soil CO2 ef-flux (black symbols and line) and topsoil (Oaand A horizons) CO2 efflux (red symbols and line) measured by the gradient technique, on an hourly basis. The best-fitted exponential curves are shown.
4.2 Responses of soil CO2efflux to soil temperature and
moisture
For the snow-free period for 8 month (Fig. 4), soil CO2 effluxes increased exponentially with temperature andQ10 value was estimated to be about 3.1, 3.5, 2.9 and 3.6 forRs,
Rh,RrandFt, respectively. TheQ10ofRswas quite larger than the global meanQ10ofRs(ranging 1.43–2.03; Raich et al., 2002; Zhou et al., 2009). Generally,Q10varies between 1 and 5, and is negatively correlated with temperature and positively correlated with soil moisture (Lloyd and Taylor, 1994). Therefore, the highQ10is attributable mainly to high soil moisture, ranging between 25 and 55% with 95% confi-dence interval of 30–40%, and relatively low air temperature with an annual mean of 7.1◦C. The Q10 was lower forRr than forRhin this site. The result is inconsistent with the report for a temperate mixed forest at the Harvard Forest, in which theQ10ofRr(4.6) was significantly greater than that ofRh(2.5) (Boone et al., 1998). Our finding suggests that
0 0.5 1 1.5 2
(a)
R = 0.005 Wsoil + 0.80
r2 = 0.04 (b)
R = 0.010 Wsoil + 0.68 r2 = 0.03
0 0.5 1 1.5
20 25 30 35 40 45 50 55 (c)
R = -0.005 W soil + 1.19 r2 = 0.02
20 25 30 35 40 45 50 55 60 (d)
F = -0.007 Wsoil + 1.44 r2 = 0.02
Volumetric soil moisture (%)
Te
m
p
e
ra
tu
re normal
iz
ed e
fflux
(
R
/
R
(T))
Fig. 5. Temperature normalized soil CO2efflux, ratio between mea-sured soil CO2efflux (Rs) and its temperature fitted value (Rs(T )), versus volumetric soil water content at a depth of 0.1 m. (a) and (b) represent total soil CO2efflux and root respiration measured by the automated chamber system, and (c) and (d) represents total soil CO2efflux and topsoil (Oaand A horizons) CO2efflux measured by the soil CO2gradient system.
the high temperature sensitivity ofRh will offset the forest carbon sequestration in the changing world under elevated atmospheric CO2concentration (Bond-Lamberty and Thom-son, 2010). TheQ10 ofFtfrom Oa and A horizons with a depth of 0.13 m was almost the same as that ofRh, whereas it was larger than that ofRs. Rs includes CO2 efflux from litter layer (Oeand Oi layers) with lowQ10values around 2 (Kim et al., 2005b) and that from C horizon, which is almost independent of temperature at a depth of 0.5 m (Hirano et al., 2003b). This fact can explain the difference inQ10 between
RsandFt.
0 1 2 3 4 5 6
0 2 4 6 8 10 12
Rs
Rh
Rr
Ft
Q10
o
f s
o
il
CO
2
ef
fl
ux
Month of 2003
Fig. 6. Seasonal changes inQ10 of soil CO2 efflux (Rs, dots with solid line), heterotrophic respiration (Rh, triangles with dashed line), root respiration (Rr, circles with dotted line), and topsoil CO2 efflux (Ft, squares with dot-dashed line) for the snow-free season from April through December.
4.3 Seasonal variations inQ10of soil CO2efflux
To investigate the mechanism by which temperature affects soil CO2 efflux, we determinedQ10 values monthly. Fig-ure 6 shows seasonal variations inQ10ofRs,Rh,RrandFt. The Q10 of Rr peaked in June when productivities of fine roots and the rhizosphere were highest, suggesting thatRris controlled mainly by canopy processes (e.g. photosynthesis) through metabolism of recently fixed carbohydrates (Tang et al., 2005; Moyano et al., 2008; Sampson et al., 2007; Irvine et al., 2008; Baldocchi et al., 2006; Yuste et al., 2004; Has-selquist et al., 2010). The fact that ecosystem photosynthesis (GPP) of this larch forest also peaked in June (Hirata et al., 2007) supports this suggestion. Rr showed the lowestQ10 in August (i.e., midsummer). In contrast, theQ10ofRh re-mained relatively constant at around 3 throughout the grow-ing season but increased drastically from late autumn (Oc-tober) to early winter (December), accompanied by a large decrease in temperature. The increase inQ10 ofRhin late autumn was attributable to fresh litter supply through defo-liation (Kim et al., 2005a). Precipitation was abundant for the growing season in this site, and no evidence for seasonal drought was observed. Thus, the different seasonality ofQ10 betweenRrandRhsuggests that the temperature response of
Rrhas a different mechanism from that ofRh.
There is an increasing evidence thatQ10 ofRsis not sea-sonally constant and tends to increase with decreasing tem-perature and increasing soil moisture (Chen et al., 2009a). Recent field studies have also observed significant seasonal variations inQ10ofRs(Chen et al., 2009a; Janssens and Pi-legaard, 2003; Liu et al., 2006b; Phillips et al., 2010; Xu and Qi, 2001). By partitioningRs intoRrandRh, we found that the seasonality of theQ10ofRswas almost parallel with that
20 30 40 50 60 70 80
0 50 100 150 200 250 300 350
R
h/
R
s,
R
r/
R
s (%
)
Day of year 2003
Rh/Rs, Rr/Rs
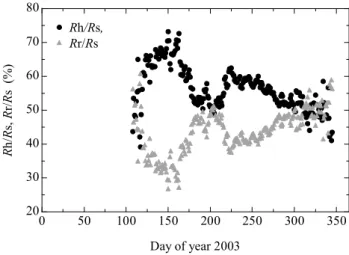
Fig. 7. Seasonal variations in the contributions of heterotrophic res-piration (Rh, triangles) and root respiration (Rr, circles) to total soil respiration (Rs) measured by the chamber method on daily basis.
of theQ10 of Rr (Fig. 6). The summer depression in Q10 was also reported by Janssens and Pilegaard (2003), whereas they suspected that the depression was caused by summer drought stress. The similar seasonal variations in theQ10of
RsandRrsuggest that the large seasonal change inRr dom-inates the seasonal pattern ofRsduring the growing season. The relative stability of theQ10ofRhis consistent with both laboratory results and theoretical predictions (Davidson and Janssens, 2006). The seasonalQ10 variation indicates that aQ10 function based on annual data will under- or overe-stimate Rs on shorter timescales. Thus, empirical models should be parameterized at a time resolution similar to that required by the output of each model.
4.4 Root respiration (Rr) and heterotrophic respiration
(Rh)
DistinguishingRr fromRh is an important first step in in-terpreting field measurements, because Rr and Rh can re-spond differently to the environment (Cisneros-Dozal et al., 2007; Moyano et al., 2008; Irvine et al., 2008; Ryan and Law, 2005). In this larch forest, the relative contributions ofRrand
RhtoRsshowed distinct seasonal patterns (Fig. 7), which is consistent with the suggestion of Hanson et al. (2000) that the proportions ofRr andRhtoRs vary seasonally and among ecosystems.
at a high rate from early June through mid-August (Hirata et al., 2007), which probably provided substrate for root and associated rhizosphere (Vargas et al., 2010; Tang et al., 2005; Moyano et al., 2008; Hasselquist et al., 2010). Thus, Rr contributed more (around 50%) to Rs between early June and early August (DOY 161 to 215), when the plants grew rapidly. From early August to mid-September (DOY 216 to 258), high temperatures probably both inhibited photosyn-thesis and enhanced decomposition of organic matter, allow-ing the heterotrophic contribution to reach a second peak. As the temperature decreased from the beginning of Septem-ber, theRh contribution decreased but the Rr contribution remained at a relatively high level owing to the higher allo-cation of photosynthate (i.e., starch) to roots and ectomycor-rhizal fungi (Liang et al., 2004; Liu et al., 2006a; Kurganova et al., 2007; Hasselquist et al., 2010). In the end of Septem-ber, the contributions of Rr and Rh became equal, which lasted until December. On the other hand, the contribution ofFttoRsshowed a simpler seasonal variation (data are not shown). TheFtcontribution linearly increased from 60% to 90% by late April for 4 months and gradually decreased to 70% by late November. During December, it decreased to 45%. The seasonal variation is similar with that in a neigh-boring deciduous broadleaf forest (Hirano et al., 2003b; Hi-rano, 2005).
During the whole growing season for 5 months, between DOY 135 and 288, the average contribution of Rh to Rs was 57%. During the non-growing season,RrandRheach accounted for roughly half of Rs. Hanson et al. (2000) reviewed that, in forests, heterotrophic contributions were ranging from 40% during the growing season to 54% annu-ally. The root exclusion method by trenching, which was used in this study to distinguishRrfrom Rh, can overesti-mate Rh in the short term (e.g., within the first treatment year) owing to the decomposition of dead roots, whereas it can underestimateRhin the long term (e.g., over one year) because no new fine root litter is supplied.
4.5 Impact of rainfall events on soil CO2efflux
Several studies have detected a sudden increase in soil respi-ration during pulsed rain events especially in arid ecosystems (Lee et al., 2004; Xu et al., 2004; Irvine et al., 2005; Kelli-her et al., 2004; Chen et al., 2009b; Inglima et al., 2009; Baldocchi et al., 2006). In this study, both the automated chamber and the gradient approaches revealed episodic CO2 emissions (Fig. 3).Rsrapidly responded to the onset of rain and increased by approximately 70% following a rain event with more than 20 mm of precipitation. After the rain, Rs returned to the pre-rain rate in several hours. Our results are consistent with the findings of rain simulation studies (Lee et al., 2004; Chen et al., 2009b), and field observations (In-glima et al., 2009; Xu et al., 2004; Baldocchi et al., 2006). Lee et al. (2004) reported that a 170-mm rainstorm enhanced
Rs up to fivefold, andRs returns to the pre-rain level within
one hour after the rain. Kelliher et al. (2004) reported that, in a young ponderosa pine forest,Rswas increased threefold by a simulated rain event and returned to the pre-rain levels within 24 h after the rain. In the same forest, Irvine and Law (2002) showed that the intensity of rain events had a substan-tial effect on interannual variation inRs, because heavy rain events resulted in prolonged elevation ofRs.
The rapid response of Rs to pulsed rain events suggests that continuous measurements are crucial for accurate, quan-titative assessment ofRs(Vargas et al., 2010). Periodic mea-surements by the manual chamber method, which are gener-ally conducted only under fine-weather conditions, undoubt-edly underestimate Rs under rainy conditions, because the pulse signals of Rs are missed. The underestimation can strongly affect ecosystem carbon balance (Lee et al., 2004; Xu et al., 2004; McCulley et al., 2007). For instance, if we estimate annualRsfrom soil temperature using two exponen-tial models (Eq. 4) fitted to data on all days and no-rain days, respectively, the latter model ignoring rainy data underesti-mates annualRsby 24 gC m−2or 2%, which is equivalent to 11% of the annual NEE of this forest (Hirata et al., 2007). 4.6 Seasonal and annul sums of soil CO2efflux (Rs)
Rs measured with the chamber system summed up to 855 gC m−2for about 8 months of the snow-free season. The seasonal sum of Rs measured by the gradient method for the same period was 896 gC m−2, whereas it must be under-estimated, because the gradient method could not measure CO2efflux from the litter layer (Qi andQehorizons). CO2 efflux from the litter layer at this site can be estimated at 60 gC m−2for the snow-free season in 2002 from the results of Kim et al. (2005a). If its interannual variation is negli-gible,Rs comes to 956 gC m−2 by adding the litter contri-bution, which is larger than that by the chamber method by 12%. The overestimation by the gradient method is consis-tent with the result in 2001 (Liang et al., 2004). However, it is worth noting that the difference between the two methods is considerably smaller than those reported by, for example, Vargas et al. (2008) and Pingintha et al. (2010), who showed that the gradient effluxes were 23% and 90% larger than that by the chamber method, respectively. In contrast, Baldocchi et al. (2006) reported that gradient effluxes were only 77% of chamber measurements. Because each hourlyRs by the gradient method always fell within the range of 8 measure-ments ofRsby the chamber method, the difference between the two methods is attributable to spatial variation inRs; the coefficient of variation (CV) was 21% forRsand 20% forRh on average.
by extrapolating Eq. (4) fitted for the snow-free season only, whith overestimated the winterRsby by 26 gC m−2. As a re-sult, when the chamber method and the gradient method are adopted for the snow-free and snowy seasons, respectively, the annualRs is determined to be 934 gC m−2y−1. The an-nualRsstands in the middle class of that of temperate forest (Bond-Lamberty and Thomson, 2010). The winterRs for 4 months accounted for 8.5% of the annualRs. In a neighbor-ing broadleaf forest, the winterRs accounted for 8–10% of the annualRs (Hirano 2005; Kim et al., 2005a). The con-tribution of the winterRs was slightly larger than those of forests, shrubs and meadow glasslands in North China (Wang et al., 2010). In our earlier study (Liang et al., 2004), we ob-tained an annualRs of 665 g C m−2y−1with a steady-state chamber system at this site in 2001. The large difference of 269 gC m−2in the annualR
smay be attributed to the positive pressure of 0.22 Pa inside the steady-state chamber system, which led to a systematic underestimation ofRs (Fang and Moncrieff, 1998; Widen and Lindroth, 2003).
Based on the gradient measurement, the relative contribu-tion to the annualRsfrom topsoil, subsoil, and litter was 72, 22 and 6%, respectively. Such a proportion indicates that the organic soil layer with a depth of 0.13 m produced 72% of total CO2emitted to the atmosphere. The vertical distribu-tion of CO2efflux can be explained by those of soil carbon content and root biomass, which were localized in surface soil (Sakai et al., 2007). The annual ecosystem respiration (RE) of this site was 1493 gC m−2y−1in 2003 (Hirata et al., 2007). The annualRsof 934 gC m−2y−1accounted for 63% of the RE. The ratio ofRsto RE is compatible with those of European forests (Janssens et al., 2001b). Liang et al. (2005) reported that the annual sum of the stem respiration of larch trees was 78–80 gC m−2y−1in this forest in 2002. Consider-ing the contribution of broadleaf species, the total stem respi-ration may be estimated to be about 100 gC m−2y−1. Then, we can attribute the residual of RE (i.e., 459 gC m−2y−1) to the aboveground respiration of tree canopy and understory species as well as the decomposition of coarse woody debris.
5 Conclusions
The concurrent employment of gradient method along with chamber method provide not only the soil effluxes during the snow-covered period but also further insight into their partitioning. Soil CO2 effluxes of the larch forest, includ-ing total soil respiration (Rs), heterotrophic respiration (Rh), autotrophic (root) respiration (Rr) and top soil respiration (Ft), were strongly affected by soil temperature. Overall, no constraints of soil moisture on any soil CO2efflux were found, whereas soil respiration showed pulsed increase after rain events. The contribution ofRrtoRs changed season-ally, and peaked in early summer when canopy photosynthe-sis and plant growth were active. The vertical distribution of soil CO2efflux reflected those of soil carbon content and
root biomass. On an annual basis,Rraccounted for 43% of
Rs, andRsaccounted for 63% of ecosystem respiration mea-sured by the eddy covariance technique.
Acknowledgements. We thank Koh Inukai and Yasuyuki Kitamori (Econixe, Hokkaido) for their very efficient management of the Tomakomai flux site, and the Hokkaido Regional Office of the Forest Agency for allowing the use of the larch forest. We also thank two anonymous reviewers and the handling editor (Joon Kim) for their constructive suggestions to improve this manuscript. This work was supported by the Global Environmental Research Fund (B-073), Ministry of the Environment, Japan and Grants-in-Aid for Scientific Research (No. 13480150) from JSPS. This is a contribution to the A3 Foresight Program (CarboEastAsia) funded by the Japan Society for the Promotion of Science.
Edited by: J. Kim
References
Baldocchi, D., Tang, J. W., and Xu, L. K.: How switches and lags in biophysical regulators affect spatial-temporal variation of soil respiration in an oak-grass savanna, J. Geophys. Res., 111, G02008, doi:10.1029/2005JG000063, 2006.
Bond-Lamberty, B. and Thomson, A.: Temperature-associated in-creases in the global soil respiration record, Nature, 464, 579– 582, doi:10.1038/nature08930, 2010.
Boone, R. D., Nadelhoffer, K. J., Canary, J. D., and Kaye, J. P.: Roots exert a strong influence on the temperature sensitivity of soil respiration, Nature, 396, 570–572, 1998.
Campbell, G. S.: Soil Physics with BASIC: Transport Models for Soil-Plant Systems, Elsevier, New York, USA, 150 pp., 1985. Chen, J. M., Huang, S. E., Ju, W., Gaumont-Guay, D., and Black,
T. A.: Daily heterotrophic respiration model considering the di-urnal temperature variability in the soil, J. Geophys. Res., 114, G01022, doi:10.1029/2008JG000834, 2009a.
Chen, S. P., Lin, G. H., Huang, J. H., and Jenerette, G. D.: De-pendence of carbon sequestration on the differential responses of ecosystem photosynthesis and respiration to rain pulses in a semiarid steppe, Global Change Biol., 15, 2450–2461, 2009b. Cisneros-Dozal, L. M., Trumbore, S. E., and Hanson, P. J.: Effect of
moisture on leaf litter decomposition and its contribution to soil respiration in a temperate forest, J. Geophys. Res., 112, G01013, doi:10.1029/2006JG000197, 2007.
Currie, J. A.: Gaseous diffusion in porous media Part 1. – A non-steady state method, Br. J. Appl. Phys., 11, 314–317, 1960. Davidson, E. A. and Janssens, I. A.: Temperature sensitivity of soil
carbon decomposition and feedbacks to climate change, Nature, 440, 165–173, 2006.
Drewitt, G. B., Black, T. A., Nesic, Z., Humphreys, E. R., Jork, E. M., Swanson, R., Ethier, G. J., Griffis, T., and Morgenstern, K.: Measuring forest floor CO2fluxes in a Douglas-fir forest, Agr. For. Meteorol., 110, 299–317, 2002.
Fang, C. and Moncrieff, J. B.: An open-top chamber for measuring soil respiration and the influence of pressure difference on CO2 efflux measurement, Func. Ecol., 12, 319–325, 1998.
W., Lindsay, K., Matthews, H. D., Raddatz, T., Rayner, P., Re-ick, C., Roeckner, E., Schnitzler, K. G., Schnur, R., Strassmann, K., Weaver, A. J., Yoshikawa, C., and Zeng, N.: Climate-carbon cycle feedback analysis: Results from the (CMIP)-M-4 model intercomparison, J. Climate, 19, 3337–3353, 2006.
Gaumont-Guay, D., Black, T. A., McCaughey, H., Barr, A. G., Kr-ishnan, P., Jassal, R. S., and Nesic, Z.: Soil CO2efflux in con-trasting boreal deciduous and coniferous stands and its contribu-tion to the ecosystem carbon balance, Glob. Change Biol., 15, 1302–1319, 2009.
Goulden, M. L. and Crill, P. M.: Automated measurements of CO2 exchange at the moss surface of a black spruce forest, Tree Phys-iol., 17, 537–542, 1997.
Gower, S. T. and Richards, J. H.: Larches: deciduous conifers in an evergreen world, BioScience, 40, 818–826, 1990.
Hanson, P. J., Edwards, N. T., Garten, C. T., and Andrews, J. A.: Separating root and soil microbial contributions to soil respira-tion: A review of methods and observations, Biogeochemistry, 48, 115–146, 2000.
Hasselquist, N. J., Vargas, R., and Allen, M. F.: Using soil sens-ing technology to examine interactions and controls between ec-tomycorrhizal growth and environmental factors on soil CO2 dynamics, Plant Soil, 331, 17–29, 10.1007/s11104-009-0183-y, 2010.
Hirano, T., Hirata, R., Fujinuma, Y., Saigusa, N., Yamamoto, S., Harazono, Y., Takada, M., Inukai, K., and Inoue, G.: CO2and water vapor exchange of a larch forest in northern Japan, Tellus, 55B, 244–257, 2003a.
Hirano, T., Kim, H., and Tanaka, Y.: Long-term half-hourly measurement of soil CO2 concentration and soil respiration in a temperate deciduous forest, J. Geophys. Res., 108, 4631, doi:4610.1029/2003JD003766, 2003b.
Hirano, T.: Seasonal and diurnal variations in topsoil and sub-soil respiration under snowpack in a temperate deciduous forest, Global Biogeochem. Cy., 19, 2005.
Hirata, R., Hirano, T., Saigusa, N., Fujinuma, Y., Inukai, K., Ki-tamori, Y., Takahashi, Y., and Yamamoto, S.: Seasonal and in-terannual variations in carbon dioxide exchange of a temperate larch forest, Agric. For. Meteorol., 147, 110–124, 2007. Inglima, I., Alberti, G., Bertolini, T., Vaccari, F. P., Gioli, B.,
Miglietta, F., Cotrufo, M. F., and Peressotti, A.: Precipitation pulses enhance respiration of Mediterranean ecosystems: the bal-ance between organic and inorganic components of increased soil CO2efflux, Global Change Biol., 15, 1289–1301, 2009. IPCC: Climate Change 2007: The Physical Science Basis.
Con-tribution of Working Group I to the Fourth Assessment Report of the Intergovernmental Panel on Climate Change edited by: Solomon, S., Qin, D., Manning, M., Chen, Z., Marquis, M., Av-eryt, K. B., Tignor, M., and Miller, H. L., Cambridge University Press, Cambridge, UK and New York, NY, USA, 996 pp., 2007. Irvine, J. and Law, B. E.: Contrasting soil respiration in young and old-growth ponderosa pine forests, Global Change Biol., 8, 1183–1194, 2002.
Irvine, J., Law, B. E., and Kurpius, M. R.: Coupling of canopy gas exchange with root and rhizosphere respiration in a semi-arid forest, Biogeochemistry, 73, 271–282, 2005.
Irvine, J., Law, B. E., Martin, J. G., and Vickers, D.: Interannual variation in soil CO2efflux and the response of root respiration to climate and canopy gas exchange in mature ponderosa pine,
Global Change Biol., 14, 2848–2859, 2008.
Ishitsuka, S. and Sakata, T.: Estimate equation of gas diffusion co-efficient of forest soils in Japan, (in Japanese with English ab-stract), Jpn. J. For. Environ., 48, 9–15, 2006.
Janssens, I. A., Kowalski, A. S., and Ceulemans, R.: Forest floor CO2 fluxes estimated by eddy covariance and chamber-based model, Agric. For. Meteorol., 106, 61–69, 2001a.
Janssens, I. A., Lankreijer, M., Matteccui, G., Kowalski, A. S., Buchmann, N., Epron, D., Pielegaard, K., Kutsch, W., Long-doz, B., Grunbald, T., Montagnani, L., Dore, S., Rebmann, C., Moors, E. J., Grelle, A., Rannik, U., Morgenstern, K., Oltchev, S., Clement, R., Gudmundsson, J., Minerbi, S., Berbigier, P., Ibron, A., Moncrieff, J., Aubinet, M., Berhofer, C., Jensen, N. O., Vesala, T., Granier, A., Schulze, E. -D., Lindroth, A., Dolman, A. J., Jarvis, P. G., Ceulemans, R., and Valentini, R.: Productivity overshadows temperature in determining soil and ecosystem res-piration across European forests, Global Change Biol., 7, 269– 278, 2001b.
Janssens, I. A. and Pilegaard, K.: Large seasonal changes inQ10
of soil respiration in a beech forest, Glob. Change Biol., 9, 911– 918, 2003.
Jassal, R. S., Black, T. A., Cai, T. B., Morgenstern, K., Li, Z., Gaumont-Guay, D., and Nesic, Z.: Components of ecosystem respiration and an estimate of net primary productivity of an intermediate-aged Douglas-fir stand, Agric. For. Meteorol., 144, 44–57, 2007.
Kelliher, F. M., Ross, D. J., Law, B. E., Baldocchi, D. D., and Rodda, N. J.: Limitations to carbon mineralization in litter and mineral soil of young and old ponderosa pine forests, For. Ecol. Manage., 191, 201–213, 2004.
Kim, H., Hirano, T., Koike, T., and Urano, S.: Contribution of litter CO2production to total soil respiration in two deciduous forsts, Phyton, 45, 385–388, 2005a.
Kim, H., Hirano, T., and Urano, S.: Seasonal variation in CO2 pro-duction of leaf litter from different deciduous forests at the early decomposition stage, J. Agric. Meteorol., 61, 91–104, 2005b. Klimek, B., Choczynski, M., and Juszkiewicz, A.: Scots pine
(Pinus sylvestris L.) roots and soil moisture did not affect soil thermal sensitivity, Euro. J. Soil Biol., 45, 442–447, doi:10.1016/j.ejsobi.2009.06.008, 2009.
Kurganova, I. N., Yermolaev, A. M., de Gerenyu, V. O. L., Lar-ionova, A. A., Kuzyakov, Y., Keller, T., and Lange, S.: Car-bon balance in the soils of abandoned lands in Moscow region, Eurasian Soil Sci., 40, 51–58, 2007.
Law, B. E., Ryan, M. G., and Anthoni, P. M.: Seasonal and annual respiration of a ponderosa pine ecosystem, Glob. Change Biol., 5, 169–182, 1999.
Law, B. E., Falge, E., Gu, L., Baldocchi, D. D., Bakwin, P., Berbigier, P., Davis, K., Dolman, A. J., Falk, M., Fuentes, J. D., Goldstein, A., Granier, A., Grelle, A., Hollinger, D., Janssens, I. A., Jarvis, P., Jensen, N. O., Katul, G., Mahli, Y., Matteucci, G., Meyers, T., Monson, R., Munger, W., Oechel, W., Olson, R., Pi-legaard, K., Paw, K. T., Thorgeirsson, H., Valentini, R., Verma, S., Vesala, T., Wilson, K., and Wofsy, S.: Environmental con-trols over carbon dioxide and water vapor exchange of terrestrial vegetation, Agric. For. Meteorol., 113, 97–120, 2002.
Lee, X., Wu, H. J., Sigler, J., Oishi, C., and Siccama, T.: Rapid and transient response of soil respiration to rain, Glob. Change Biol., 10, 1017–1026, 2004.
Liang, N., Inoue, G., and Fujinuma, Y.: A multichannel automated chamber system for continuous measurement of forest soil CO2 efflux, Tree Physiol. 23, 825–832, 2003.
Liang, N., Nakadai, T., Hirano, T., Qu, L. Y., Koike, T., Fujinuma, Y., and Inoue, G.: In situ comparison of four approaches to es-timating soil CO2 efflux in a northern larch (Larix kaempferi Sarg.) forest, Agric. For. Meteorol., 123, 97–117, 2004. Liang, N., Fujinuma, Y., and Inoue, G.: Measurement of wood CO2
efflux using a multichannel automated chamber system, Phyton, 45, 109–115, 2005.
Liu, H. S., Li, L. H., Han, X. G., Huang, J. H., Sun, J. X., and Wang, H. Y.: Respiratory substrate availability plays a crucial role in the response of soil respiration to environmental factors, Appl. Soil Ecol., 32, 284–292, 2006a.
Liu, Q., Edwards, N. T., Post, W. M., Gu, L., Ledford, J., and Lenhart, S.: Temperature-independent diel variation in soil respi-ration observed from a temperate deciduous forest, Glob. Change Biol., 12, 2136–2145, 2006b.
Lloyd, J. and Taylor, J. A.: On the Temperature-Dependence of Soil Respiration, Func. Ecol., 8, 315–323, 1994.
Luyssaert, S., Schulze, E. D., Borner, A., Knohl, A., Hessenmoller, D., Law, B. E., Ciais, P., and Grace, J.: Old-growth forests as global carbon sinks, Nature, 455, 213–215, 2008.
McCulley, R. L., Boutton, T. W., and Archer, S. R.: Soil respiration in a subtropical savanna parkland: Response to water additions, Soil Sci. Soc. Am. J., 71, 820–828, 2007.
Moyano, F. E., Kutsch, W. L., and Rebmann, C.: Soil respiration fluxes in relation to photosynthetic activity in broad-leaf and needle-leaf forest stands, Agric. For. Meteorol., 148, 135–143, 2008.
Phillips, S. C., Varner, R. K., Frolking, S., Munger, J. W., Bubier, J. L., Wofsy, S. C., and Crill, P. M.: Interannual, seasonal, and diel variation in soil respiration relative to ecosystem respiration at a wetland to upland slope at Harvard Forest, J.Geophys. Res., 115, G02019, doi:10.1029/2008JG000858, 2010.
Pingintha, N., Leclerc, M. Y., Beasley, J. P., Zhang, G. S., and Sen-thong, C.: Assessment of the soil CO2gradient method for soil CO2efflux measurements: comparison of six models in the cal-culation of the relative gas diffusion coefficient, Tellus, 62B, 47– 58, doi:10.1111/j.1600-0889.2009.00445.x, 2010.
Raich, J. W., Potter, C. S., and Bhagawati, D.: Interannual variabil-ity in global soil respiration, 1980–94, Glob. Change Biol., 8, 800–812, 2002.
Ruehr, N. K., Knohl, A., and Buchmann, N.: Environmental vari-ables controlling soil respiration on diurnal, seasonal and annual time-scales in a mixed mountain forest in Switzerland, Biogeo-chemistry, 98, 153–170, doi:10.1007/s10533-009-9383-z, 2010. Ryan, M. G. and Law, B. E.: Interpreting, measuring, and modeling soil respiration, Biogeochemistry, 73, 3–27, doi:10.1007/s10533-004-5167-7, 2005.
Sakai, Y., Takahashi, M., and Tanaka, N.: Root biomass and dis-tribution of a Picea-Abies stand and a Lafix-Betula stand in pumiceous Entisols in Japan, J. For. Res., 12, 120–125, 2007. Sampson, D. A., Janssens, I. A., Yuste, J. C., and Ceulemans, R.:
Basal rates of soil respiration are correlated with photosynthesis in a mixed temperate forest, Glob. Change Biol., 13, 2008–2017, 2007.
Savage, K. E. and Davidson, E. A.: A comparison of manual and automated systems for soil CO2flux measurements: trade-offs between spatial and temporal resolution, J. Exp. Botany, 54, 891– 899, 2003.
Tang, J., Baldocchi, D. D., Qi, Y., and Xu, L. K.: Assessing soil CO2efflux using continuous measurements of CO2profiles in soils with small solid-state sensors, Agric. For. Meteorol., 118, 207–220, 2003.
Tang, J., Baldocchi, D. D., and Xu, L.: Tree photosynthesis modu-lates soil respiration on a diurnal basis, Glob. Change Biol., 11, 1298–1304, 2005.
Tang, J. W., Bolstad, P. V., Desai, A. R., Martin, J. G., Cook, B. D., Davis, K. J., and Carey, E. V.: Ecosystem respiration and its components in an old-growth forest in the Great Lakes region of the United States, Agric. For. Meteorol., 148, 171–185, 2008. Vargas, R. and Allen, M. F.: Dynamics of fine root, fungal
rhi-zomorphs, and soil respiration in a mixed temperate forest: Inte-grating sensors and observations, Vadose Zone J., 7, 1055–1064, doi:10.2136/vzj2007.0138, 2008.
Vargas, R., Detto, M., Baldocchi, D. D., and Allen, M. F.: Multi-scale analysis of temporal variability of soil CO2production as influenced by weather and vegetation, Glob. Change Biol., 16, 1589–1605, doi:10.1111/j.1365-2486.2009.02111.x, 2010. Wang, W., Peng, S., Wang, T., and Fang, J.: Winter soil CO2
ef-flux and its contribution to annual soil respiration in different ecosystems of a foerst-steppe ecotone, north China, Soil Biol. Biochem., 42, 451–458, 2010.
Widen, B., and Lindroth, A.: A calibration system for soil carbon dioxide efflux measurement chambers: Description and applica-tion, Soil Sci. Soc. Am. J., 67, 327–334, 2003.
Xu, L. K., Baldocchi, D. D., and Tang, J. W.: How soil moisture, rain pulses, and growth alter the response of ecosystem respi-ration to temperature, Glob. Biogeochem. Cycles, 18, GB4002, doi:10.1029/2004GB002281, 2004.
Xu, M. and Qi, Y.: Spatial and seasonal variations ofQ10 deter-mined by soil respiration measurements at a Sierra Nevadan for-est, Glob. Biogeochem. Cy., 15, 687–696, 2001.
Yuste, J. C., Janssens, I. A., Carrara, A., and Ceulemans, R.: An-nualQ10of soil respiration reflects plant phenological patterns as well as temperature sensitivity, Glob. Change Biol., 10, 161– 169, 2004.