HESSD
9, 8105–8136, 2012CREST-Snow Field Experiment: analysis
of snowpack properties
T. Lakhankar et al.
Title Page
Abstract Introduction
Conclusions References
Tables Figures
◭ ◮
◭ ◮
Back Close
Full Screen / Esc
Printer-friendly Version Interactive Discussion
Discussion
P
a
per
|
Dis
cussion
P
a
per
|
Discussion
P
a
per
|
Discussio
n
P
a
per
|
Hydrol. Earth Syst. Sci. Discuss., 9, 8105–8136, 2012 www.hydrol-earth-syst-sci-discuss.net/9/8105/2012/ doi:10.5194/hessd-9-8105-2012
© Author(s) 2012. CC Attribution 3.0 License.
Hydrology and Earth System Sciences Discussions
This discussion paper is/has been under review for the journal Hydrology and Earth System Sciences (HESS). Please refer to the corresponding final paper in HESS if available.
CREST-Snow Field Experiment: analysis
of snowpack properties using
multi-frequency microwave remote
sensing data
T. Lakhankar1, J. Mu ˜noz1, P. Romanov1, A. M. Powell2, N. Krakauer1, W. Rossow1, and R. Khanbilvardi1
1
NOAA-CREST, The City College of New York, 160 Convent Ave, New York, NY, USA
2
The Center for Satellite Applications and Research, NESDIS/ NOAA, Camp Springs, MD, USA
Received: 30 May 2012 – Accepted: 22 June 2012 – Published: 4 July 2012 Correspondence to: T. Lakhankar ([email protected])
HESSD
9, 8105–8136, 2012CREST-Snow Field Experiment: analysis
of snowpack properties
T. Lakhankar et al.
Title Page
Abstract Introduction
Conclusions References
Tables Figures
◭ ◮
◭ ◮
Back Close
Full Screen / Esc
Printer-friendly Version Interactive Discussion
Discussion
P
a
per
|
Dis
cussion
P
a
per
|
Discussion
P
a
per
|
Discussio
n
P
a
per
|
Abstract
The CREST-Snow Analysis and Field Experiment (CREST-SAFE) was carried out dur-ing winter 2011 at the research site of the National Weather Service office, Caribou ME, USA. In this ground experiment, dual polarized microwave (37 and 89 GHz) ob-servations are conducted along with detailed synchronous obob-servations of snowpack
5
properties. The objective of this long term field experiment is to improve our under-standing of the effect of changing snow characteristics (grain size, density, tempera-ture) under various meteorological conditions on the microwave emission of snow and hence to improve retrievals of snow cover properties from satellite observations in the microwave spectral range. In this paper, we presented the overview of field experiment
10
and preliminary analysis of the microwave observations for the first year of experiment along with support observations of the snowpack properties obtained during the 2011 winter season. SNTHERM and HUT (Helsinki University of Technology) snow emission model were used to simulate snowpack properties and microwave brightness temper-atures respectively. Simulated brightness tempertemper-atures were compared with observed
15
brightness temperature from radiometer under different snow conditions. On the time series, large difference in the brightness temperature were observed for fresh com-pared to aged snow even under the same snow depth, suggesting a substantial impact of other parameters such as: snow grain size and density on microwave observations. A large diurnal variation in the 37 and 89 GHz brightness temperature with small
de-20
HESSD
9, 8105–8136, 2012CREST-Snow Field Experiment: analysis
of snowpack properties
T. Lakhankar et al.
Title Page
Abstract Introduction
Conclusions References
Tables Figures
◭ ◮
◭ ◮
Back Close
Full Screen / Esc
Printer-friendly Version Interactive Discussion
Discussion
P
a
per
|
Dis
cussion
P
a
per
|
Discussion
P
a
per
|
Discussio
n
P
a
per
|
1 Introduction
The storage of water in snowpack affects the surface runoffand soil moisture, and is therefore important at the regional scale for various applications such as flood predic-tion and water resource management. Rain on snow together with warm air temper-atures can lead to fast snow melt. These conditions are responsible for the majority
5
of spring floods in mid- and high latitude areas (Erman et al., 1988; McCabe et al., 2007; Papa et al., 2007; Singh et al., 1997). Snowpack is a complex medium with large spatial and temporal variability, and can consist of several layers with different den-sities and grain size distributions. An adequate knowledge of snow depth and snow water equivalent (SWE) is necessary to run hydrological, meteorological, and climate
10
models (McCabe et al., 2007).
Satellite observations in the microwave spectral range have been used for the global monitoring of snow cover properties for more than three decades. Microwave emission from snowpack depends on the snow grain size, density, depth, snowpack and soil temperature, along with snow and soil wetness (Grody, 2008a). Deeper snow promotes
15
increased scatter of the microwave signal and hence results in a lower brightness tem-perature of the scene (Ulaby and Stiles, 1980). For given snow depth, scattering of mi-crowave radiation depends on snow grain size, which increases as snow ages causing reduction in brightness temperature (Grody, 2008). Further, as a time progress smaller grains locked together to form bigger grains. This increase in grain size as snow ages
20
gives rise to the snow density (Azar et al., 2008). During diurnal and synoptic melting and refreezing cycles, grains of relatively fresh and dry snow are transformed into large rounded polycrystalline grains (snow metamorphism), which causes a reduction in the brightness temperature. In addition, the snowpack temperature and evolution of soil temperature throughout the winter season dominates microwave emission (Brucker et
25
HESSD
9, 8105–8136, 2012CREST-Snow Field Experiment: analysis
of snowpack properties
T. Lakhankar et al.
Title Page
Abstract Introduction
Conclusions References
Tables Figures
◭ ◮
◭ ◮
Back Close
Full Screen / Esc
Printer-friendly Version Interactive Discussion
Discussion
P
a
per
|
Dis
cussion
P
a
per
|
Discussion
P
a
per
|
Discussio
n
P
a
per
|
be critical to interpreting microwave signals during the spring melting and refreezing period (Chang et al., 2003).
Several research studies have used the brightness temperature from combination of 19, 37 and 85/89 GHz microwave frequencies from satellite-mounted instruments including the Special Microwave Imager (SSM/I) and Advanced Microwave Scanning
5
Radiometer (AMSR-E), for estimation of snow depth and snow water equivalent (Du-rand et al., 2008; Grody and Basist, 1996; Kelly et al., 2003; Romanov et al., 2000; Simic et al., 2004). Earlier snow depth retrieval algorithms (Chang et al., 2003; Foster et al., 1997) provided an “instantaneous” daily snow depth estimate based on diff er-ences in brightness temperature in microwave frequencies. Several models have been
10
proposed to describe the relationships between microwave emission and snow param-eters such as mean snow grain size, density, and depth (Grody, 2008; Kelly et al., 2003; Pulliainen et al., 1999; Wiesmann and M ¨atzler, 1999).
Accurate estimation of snow grain size and density (Kelly et al., 2003), soil tempera-ture (Brucker et al., 2011) and other parameters from snow thermo dynamic model will
15
be needed to improved performance of snow emission model (Langlois et al., 2009). In situ observations of the microwave emission of snow are critical to the development and validation of algorithms to retrieve snow depth or SWE from microwave measurements. Previous snow field experiments (Chang et al., 1981; Elder et al., 2009; Hewison and English, 1999; Langlois et al., 2007; Macelloni et al., 2005) that have used microwave
20
radiometers to study snowpack microwave emission properties. Such experimentation plays an important role in understanding the complex influence on microwave retrievals of change in snow characteristics (grain size, density, snow temperature) under various meteorological conditions.
This paper presents the overview of CREST-Snow Analysis and Field Experiment
25
HESSD
9, 8105–8136, 2012CREST-Snow Field Experiment: analysis
of snowpack properties
T. Lakhankar et al.
Title Page
Abstract Introduction
Conclusions References
Tables Figures
◭ ◮
◭ ◮
Back Close
Full Screen / Esc
Printer-friendly Version Interactive Discussion
Discussion
P
a
per
|
Dis
cussion
P
a
per
|
Discussion
P
a
per
|
Discussio
n
P
a
per
|
the winter season. The principal point is that the ground microwave observations are conducted along with detailed synchronous observations and modeled snowpack prop-erties. That to relate the observed changes in the microwave emission of snow-covered land surface to changes in the state and physical properties of the snow pack and of the soil beneath the snowpack. The effect of snowpack temperature (related to dry
5
and wet snow conditions) on microwave brightness temperature can be examined and interpreted.
2 Study area
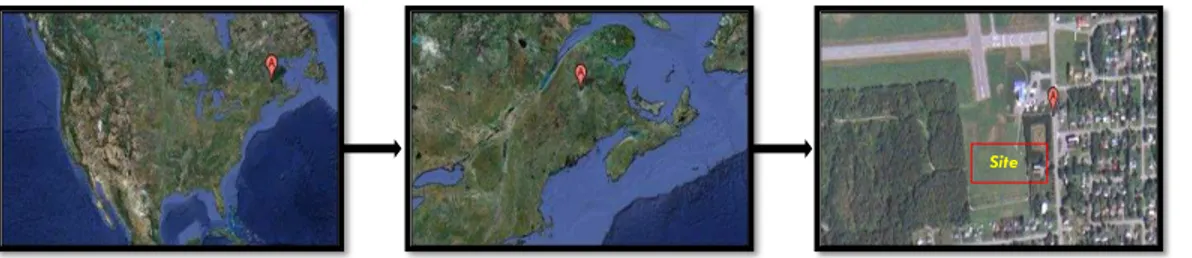
The measurement site (Fig. 1) is located near the National Weather Service office and Caribou Municipal Airport at Caribou, Maine, USA (46◦52′59′′N, 68◦01′07′′W, 190 m 10
elevation). Caribou, with a cool, humid continental climate, offers ideal conditions for snow studies. Historically the cold season lasted from mid-December to early March, with an average daily high temperature below 0◦C. The season in which snow is
rel-atively likely to be on ground, spans from mid-November to early April. The mean annual snowfall in Caribou is approximately 116 inches (2.9 m). The winter season
ac-15
cumulated snowfall record in Caribou was 197.8 inches (5.02 m) during the 2007–2008 winter season. Measurement of radiometric and in-situ observations of the snowpack properties began on 10 February 2010, and are reported here for the subsequent win-ter season.
3 Instrumentation 20
3.1 Microwave radiometers
HESSD
9, 8105–8136, 2012CREST-Snow Field Experiment: analysis
of snowpack properties
T. Lakhankar et al.
Title Page
Abstract Introduction
Conclusions References
Tables Figures
◭ ◮
◭ ◮
Back Close
Full Screen / Esc
Printer-friendly Version Interactive Discussion
Discussion
P
a
per
|
Dis
cussion
P
a
per
|
Discussion
P
a
per
|
Discussio
n
P
a
per
|
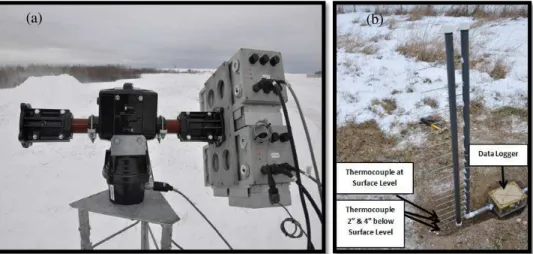
are mounted on top of a trailer at about 4 m height (Fig. 2a) and are pointed at the surface at an incidence angle of 55◦. The value of the observation angle was selected
to match the observation geometry of Special Sensor Microwave Imager (SSMI) on-board DMSP satellites and The Advanced Microwave Scanning Radiometer for EOS (AMSR-E) onboard Aqua satellite Measurements of the microwave brightness
temper-5
ature at two frequencies are taken routinely at one minute interval These radiometers are specifically designed to function as a transportable, scientific instrument optimized for snow signature measurements. The assembly consists of the two radiometers, an-tenna, the azimuth and elevation rotator, and the mounting pedestal. These radiome-ters have a 6-degree half-power beamwidth (HPBW) antenna. The radiomeradiome-ters are
10
enclosed in a fabricated and machined aluminum casing for robustness, light weight, and superior heat dissipation. System gain and receiver temperature are measured continuously and applied to the transfer function in real time to generate accurate brated brightness temperatures with no lengthy calibration interruptions. A 4 point cali-bration and non-linear transfer function are used to compensate for small, finite system
15
linearity errors.
3.2 Snow temperature profiler
A temperature profiler (Fig. 2b) is built with 16 Watlow Rigid Sheath Thermocouples to measure air/snow temperature at predefined depth intervals. The thermocouples are placed at 2 to 4 inch intervals. The Watlow rigid sheath thermocouples have a 3 / 16 inch
20
diameter sheath, 24 gauge stranded fiberglass lead with stainless steel overbraid, grounded junction, and split lead termination. These thermocouples are connected with two battery powered Madgetech OctTemp Dataloggers. Madgetech OctTemp dat-aloggers are all-in-one compact, portable, easy to use devices to record up to 500 000 measurements per channel. The storage medium is nonvolatile solid state memory,
25
HESSD
9, 8105–8136, 2012CREST-Snow Field Experiment: analysis
of snowpack properties
T. Lakhankar et al.
Title Page
Abstract Introduction
Conclusions References
Tables Figures
◭ ◮
◭ ◮
Back Close
Full Screen / Esc
Printer-friendly Version Interactive Discussion
Discussion
P
a
per
|
Dis
cussion
P
a
per
|
Discussion
P
a
per
|
Discussio
n
P
a
per
|
3.3 Snow depth and heat flux datasets
A number of additional datasets in support of the measurements at the CREST-SAFE have been collected. The reference data for the snow depth consisted of daily in-situ snow depth observations performed at the NWS weather station in Caribou, Maine. Snow grain size and snow density vertical profile at 15 cm intervals were measured on
5
10 March 2011. Sensible and latent heat flux were used in this study to understand the heat transfer and temperature gradients across the snowpack and their impact on the microwave emission. Latent heat flux associated with energy transfer across the snow surface and air interface is a function of specific humidity. Similarly, sensible heat flux is related to magnitude temperature exchanges between the atmosphere and
10
the snow surface. Surface energy flux data (sensible and latent heat flux) for the site location were obtained from National Operational Hydrologic Remote Sensing Cen-ter’s Snow Model (NSM). NSM is an energy-and-mass-balance, spatially-uncoupled, vertically-distributed, multi-layer snow model, ingesting ground-based, airborne, satel-lite, numerical weather prediction (NWP) model, and radar data to produce hourly
grid-15
ded snowpack state variables.
4 Radiometric observations and interpretations
4.1 Temporal analysis of snowpack response
Radiometric brightness temperature, snowpack temperature, radiation flux and snow depth data acquired during the time period from the beginning of January to the end of
20
HESSD
9, 8105–8136, 2012CREST-Snow Field Experiment: analysis
of snowpack properties
T. Lakhankar et al.
Title Page
Abstract Introduction
Conclusions References
Tables Figures
◭ ◮
◭ ◮
Back Close
Full Screen / Esc
Printer-friendly Version Interactive Discussion
Discussion
P
a
per
|
Dis
cussion
P
a
per
|
Discussion
P
a
per
|
Discussio
n
P
a
per
|
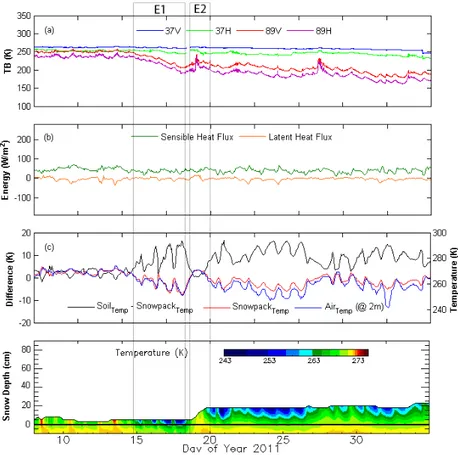
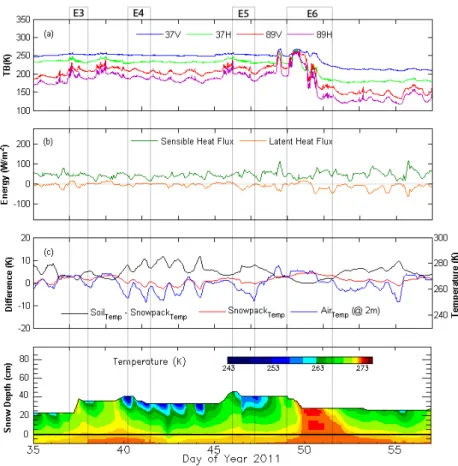
The observation time series were examined to quantitatively examine changes in the physical and emissive properties of the snow pack and to establish the relationship of the meteorological and snow physical parameters with recorded microwave brightness temperature. The winter observation period was divided into three phases: accumula-tion (Fig. 3), subfreezing and melting (Fig. 4) and melting and refreezing phase (Fig. 5).
5
Each plot shows time series of (a) radiometric observations using the 37 and 89 GHz radiometer in horizontal and vertical polarization (referred hereafter as 37 H, 37 V, 89 H and 89 V), (b) sensible and latent heat flux, (c) integrated average snowpack temper-ature from tempertemper-ature profiler, air tempertemper-ature at 2 m from soil surface, and the dif-ference between the soil temperature (at 10 cm depth) and the snowpack temperature
10
and (d) snowpack temperature gradient with respect to snow depth.
4.1.1 Snow accumulation phase
A temperature gradient in the snowpack developed due to low air temperature at the snow surface compared to the insulated base of the snowpack. The base tempera-ture of the snowpack fluctuated between 268–273 K, with cooler temperatempera-tures in early
15
winter and temperatures close to the melting point (273 K) in late winter. The diurnal variation of brightness temperature during the snow accumulation phase was smaller due to slow snow metamorphism compared to the later winter period.
In January and early February snow is accumulated during snowfall events, due to consistently below freezing temperatures without melting. During this period, the
ob-20
served snowpack temperature ranged mostly within 265–270 K, indicating that melting did not take place. Diurnal variations in brightness temperature corresponding to air temperature and snowpack temperature change were observed.
We have found that 89 GHz is more responsive to snowpack temperature compared to 37 GHz. Figure 3 illustrates changes in the snowpack properties and corresponding
25
HESSD
9, 8105–8136, 2012CREST-Snow Field Experiment: analysis
of snowpack properties
T. Lakhankar et al.
Title Page
Abstract Introduction
Conclusions References
Tables Figures
◭ ◮
◭ ◮
Back Close
Full Screen / Esc
Printer-friendly Version Interactive Discussion
Discussion
P
a
per
|
Dis
cussion
P
a
per
|
Discussion
P
a
per
|
Discussio
n
P
a
per
|
the snowpack was thin (5 cm). The reduction of TB in 89 GHz band at both vertical and horizontal polarization was primarily associated with the change in surface temperature accompanied with the change in snow grain size. Good correlation (R=0.86) was observed between soil temperature versus brightness temperature (37 V and 89 V) in vertical polarization compared to horizontal polarization (R=0.79) from DOY 7 to 18.
5
The observed brightness temperature at 37 H shows some sensitivity to changes in the soil temperature (top 10 cm of soil below snow layer), whereas TB in the 37 V band remains insensitive to soil temperature.
The first major snow storm on DOY 19–20 added 12.5 cm of snow on site, which increased the snowpack depth to 17.5 cm (Event E2 in Fig. 3). The snowfall caused
no-10
ticeable fluctuations and a general increase in the brightness temperature at 89 GHz. We believe that BT fluctuations at 89 GHz are caused by falling snow particles and by the quick change of the snowflake shapes as they hit the ground or the top snow layer. That the BT fluctuations at 89 GHz correspond to snowfall events was confirmed through the hourly precipitation record obtained from NCDC. The increase of the
bright-15
ness temperature at 89 GHz immediately after the snowfall event is due to the greater microwave scattering of the fresh snow as compared to soil or aged snow.
The snow depth remained at around 20 cm with little snow melt due to temperatures below the freezing level. Even though there was no significant change in the snow depth, the BT at 89 VH gradually decreased over time. This reduction is apparently
20
related to changes in the snowpack properties particularly to the increase of the grain size. The range of brightness temperatures measured in the 89 GHz channels could help to distinguish between fresh and aged snow (Grody, 2008; Kongoli et al., 2004).
The increased polarization difference observed after DOY 20 at both 37 and 89 GHz frequencies is the response to increased snow depth. This difference was mostly due to
25
HESSD
9, 8105–8136, 2012CREST-Snow Field Experiment: analysis
of snowpack properties
T. Lakhankar et al.
Title Page
Abstract Introduction
Conclusions References
Tables Figures
◭ ◮
◭ ◮
Back Close
Full Screen / Esc
Printer-friendly Version Interactive Discussion
Discussion
P
a
per
|
Dis
cussion
P
a
per
|
Discussion
P
a
per
|
Discussio
n
P
a
per
|
below freezing temperature on DOYs 21–33 caused slow snow metamorphic process resulting in gradual increase of the grain size. The temperature gradient of snowpack was close to linear with temperatures changing from about 270 K at the bottom of snow (soil surface) to∼250 K at the top of the snow surface. During this period, brightness
temperatures gradually decreased by 10 K and 15 K for 37 GHz at vertical and
horizon-5
tal polarization, respectively. This fact shows that brightness temperature at horizontal polarization is more sensitive to the increase in the grain size in thick snowpacks than the brightness temperature at vertical polarization.
Through the snow accumulation period average modeled values of latent and sensi-ble heat flux values were 38.0 W m−2and 2.95 W m−2(negative) respectively. This was 10
associated with low air temperature that reduces near surface moisture gradient. The latent and sensible heat flux were very stable thorough this period. The lower value of latent heat flux is due to cooler air reducing surface moisture gradient preventing heat loss through sublimation.
4.1.2 Subfreezing and melting 15
The time series (Figs. 3 and 4) for both frequencies illustrated that the main contribu-tion to variacontribu-tions in the recorded brightness temperature for both dry and wet snow is primarily variation of snowpack properties. Snow metamorphism, which transforms smaller grains into larger grains, is slow when below freezing temperatures persist. In the middle of February (DOYs 35–57), the soil temperature beneath the snowpack
20
warmed up by 1–3◦ and reached the temperature ranged over 270–272 K. This
in-crease in temperature should have stimulated metamorphic process that cause the formation of larger snow grains and eventually lead to the melt of snow at the bottom of the snowpack. The second major snow storm (E3 in Fig. 4) was observed on DOY 37, and added 15 cm of snow for an aggregate 38 cm of snow depth. This increase of
25
HESSD
9, 8105–8136, 2012CREST-Snow Field Experiment: analysis
of snowpack properties
T. Lakhankar et al.
Title Page
Abstract Introduction
Conclusions References
Tables Figures
◭ ◮
◭ ◮
Back Close
Full Screen / Esc
Printer-friendly Version Interactive Discussion
Discussion
P
a
per
|
Dis
cussion
P
a
per
|
Discussion
P
a
per
|
Discussio
n
P
a
per
|
and vertical polarizations. The reduction in snow depth at events E4 and E5 without snow melting is mainly due to high wind gust at the speed around 30 and 36 miles per hours respectively.
In the second half of February (DOY 49–51), a storm system with heavy clouds moved into the study area bringing higher relative humidity. This caused relatively
5
higher sensible and latent heat flux (E6 in Fig. 4). This higher sensible heat flux caused the snow temperature profile to collapse to the melting point, indicating snowmelt and wet snowpack formation. Warm daytime air temperatures with increased sensible heat flux of approximately 100 W m−2brought the snowpack temperature to above the
freez-ing level and caused about 13 cm snow melt. This snowmelt in the top layer brought
10
the brightness temperatures of 37 and 89 GHz closer, with the convergence and slightly higher value for Tb at 37 GHz associated with the increase in wetness. Refreezing of melted snow in the top layer formed a 5 cm thick ice layer after this warming episode. During the melting and refreezing period, the average modeled values of latent and sensible heat flux were 46.15 W m−2 and
−8.38 W m−2. The sensible and latent heat 15
flux have different magnitudes but opposite sign through the mid-winter except during melting events (E6).
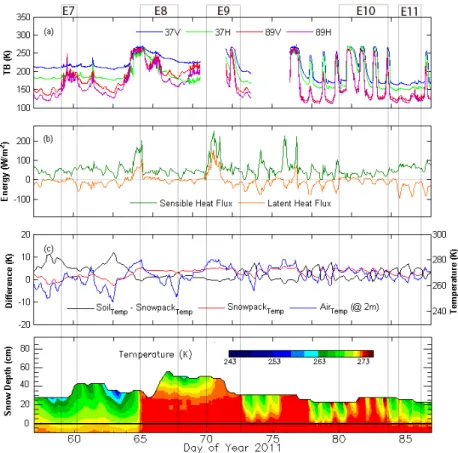
4.1.3 Melting and refreezing phase
In the month of March, two major snow storms affected the study site. The combination of above freezing temperatures during daytime and below freezing temperatures at
20
nights have caused multiple freezing and melting events in the snowpack. The melting and refreezing caused a large variation in the microwave brightness temperature during this period. The ice layer that formed after the snowmelt on DOY 50 (E6 in Fig. 4) was buried under a fresh snowfall of 15 cm that occurred on the DOY 59 (E7 in Fig. 5). The temperature profile does not provide any evidence of the ice layer since the thickness
25
HESSD
9, 8105–8136, 2012CREST-Snow Field Experiment: analysis
of snowpack properties
T. Lakhankar et al.
Title Page
Abstract Introduction
Conclusions References
Tables Figures
◭ ◮
◭ ◮
Back Close
Full Screen / Esc
Printer-friendly Version Interactive Discussion
Discussion
P
a
per
|
Dis
cussion
P
a
per
|
Discussion
P
a
per
|
Discussio
n
P
a
per
|
Strong snow melting and refreezing events were observed in the middle of March 2011 starting from DOY 70. The sharp increase in the brightness temperature during melting is caused by liquid water in the top layer of snowpack. In the case of wet snow, the collapsing of 37 and 89 GHz brightness temperatures shows the effect of real part of the dielectric constant of wet snow related to liquid water content and independent of
5
snow grain size (Tiuri et al., 1984). During melting and refreezing, the trends in the 37 and 89 GHz brightness temperatures were consistent and correlated with the snowpack temperature (Event E10 in Fig. 5). This is likely associated with the presence of liquid water in the snowpack. The degree of difference between the BTs for each polarization also appears to change with the daily temperature changes.
10
The snow melt processes are complex and difficult to distinguish using single mi-crowave frequencies as water coated snow particles are highly emissive when com-pared to dry or wet soil (Grody, 1988). The smaller difference in horizontal and vertical polarized brightness temperature of melting snow (E8, E9 and E10 in Fig. 5) is almost equal to that seen in the dry snow condition (Fig. 3). This melting and refreezing can
15
build a relatively thick ice layer, which during cold days keeps the microwave emission much lower (Event E11 in Fig. 5).
Through the melting and refreezing phase average modeled values of sensible heat flux was 51.0 W m−2with larger variations (standard deviation 35.8) through the period.
Similarly, latent heat flux also attains higher peak (145 W m−2) during melting phase 20
caused by warmer air temperature and heavy evaporation. These variations in upper and lower peaks of latent and sensible heat flux were clearly noticed during melting and refreezing period.
This time series analysis suggests that the wetness of snow is an important param-eter when understanding snow response during melting and refreezing of snow. The
25
HESSD
9, 8105–8136, 2012CREST-Snow Field Experiment: analysis
of snowpack properties
T. Lakhankar et al.
Title Page
Abstract Introduction
Conclusions References
Tables Figures
◭ ◮
◭ ◮
Back Close
Full Screen / Esc
Printer-friendly Version Interactive Discussion
Discussion
P
a
per
|
Dis
cussion
P
a
per
|
Discussion
P
a
per
|
Discussio
n
P
a
per
|
4.2 Classification analysis of brightness temperature for snowpack conditions
As it was shown above, the microwave brightness temperature at 37 and 89 GHz varies with changing snowpack physical properties and is independent of variation in the snow depth. The temporal variation in snowpack properties was analyzed by classifying the snowpack in to the categories. The snowpack properties were classified based on the
5
radiometric observations as correlated with in situ observations into the following snow categories: (a) Fresh Snow (Shallow) (b) Fresh Snow (Deep) (c) Aged Snow, (d) Melt-ing Snow, and (e) RefreezMelt-ing Snow. Supervised classification analysis was carried out to understand and discriminate between different snow conditions based on po-larization and frequency differences of microwave observations in the 37 and 89 GHz
10
channels.
Typical signatures for a variety of snow categories can be derived from the cluster means and ranges for the polarization and frequency differences for the 37 and 89 GHz channels. Figure 6 shows the brightness temperature classification of five snow con-ditions. The brightness temperature statistics in terms of range, mean, and standard
15
deviation for the snow categories are given in Table 1. The fresh dry snow and refreez-ing snow conditions are better distrefreez-inguished from other clusters compared to the aged and wet snow conditions.
Figure 6 clearly shows the decrease in BT for fresh and aged snow covered surfaces. This decrease is a unique feature for snow and can therefore be used as reliable
indi-20
cator of dry snow (Grody, 1988). Higher BT values of the 37 and 89 GHz with smaller depolarization factors, which were associated with the melting snow conditions, can be correlated with observed higher snow temperatures. The brightness temperature val-ues for melting (wet) snow conditions are higher and can be easily distinguished from other three snow conditions. These higher values are due to liquid water in wet snow
25
HESSD
9, 8105–8136, 2012CREST-Snow Field Experiment: analysis
of snowpack properties
T. Lakhankar et al.
Title Page
Abstract Introduction
Conclusions References
Tables Figures
◭ ◮
◭ ◮
Back Close
Full Screen / Esc
Printer-friendly Version Interactive Discussion
Discussion
P
a
per
|
Dis
cussion
P
a
per
|
Discussion
P
a
per
|
Discussio
n
P
a
per
|
snow conditions. The refrozen snow conditions were distinct from the others at 37 GHz due to lower brightness temperatures linked with larger snow crystals formed during melting and refreezing which reduce the emission. The distinct microwave signature of melting and refreezing conditions could be due to a combination of greater absorption by the water and less scattering since the water is no longer in the original snowflake
5
structure, which has many more ice facets to scatter the radiation.
Aged snow clearly separated from fresh snow for lower and higher depth through independent or co-polarized measurements. These preliminary analysis shows assur-ance that these snow classes can be reliably discriminated or identified using available microwave measurements. However, we would like reserve our recommendation and
10
proposing algorithm till we process two more winter seasons radiometric and snow observations.
4.3 Simulation and comparison of microwave brightness temperature
SNTHERM (SNow THERmal Model) is a one-dimensional mass and energy balance model (Jordan, 1991) used to simulate the snow grain size and density in the
ab-15
sence of their daily field measurements. Meteorological data including solar radiation, air temperature, humidity, wind speed, and precipitation obtained from neighboring Na-tional Weather Service Office were used as an input to SNTHERM to simulate snow grain size, density and snowpack temperature. The simulated snowpack temperature from SNTHERM was compared with observed in-situ snowpack temperature.
Simu-20
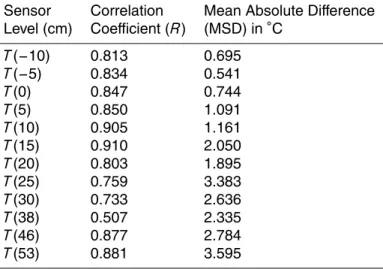
lated snowpack temperature shown good correlation with observed in-situ snowpack temperature (Fig. 7). The correlation coefficient is higher than 0.8 and means absolute difference is less than 1◦C for sensors below surface level for measured soil
temper-ature (Table 2). However, as sensors close to snow surface shows larger difference (2–3◦C) in snowpack temperature were observed. SNTHERM temperatures of soil (5 25
HESSD
9, 8105–8136, 2012CREST-Snow Field Experiment: analysis
of snowpack properties
T. Lakhankar et al.
Title Page
Abstract Introduction
Conclusions References
Tables Figures
◭ ◮
◭ ◮
Back Close
Full Screen / Esc
Printer-friendly Version Interactive Discussion
Discussion
P
a
per
|
Dis
cussion
P
a
per
|
Discussion
P
a
per
|
Discussio
n
P
a
per
|
This good correlation between snowpack temperatures prompted to use other SNTHERM simulated variables such as: snow grain size and density, in microwave snow emission model for estimating brightness temperature.
Brightness temperatures over the study area were simulated for the 37 and 89 GHz frequency HUT (Helsinki University of Technology) snow emission model (Pulliainen et
5
al., 1999). The HUT snow emission model is a semi-empirical model based on radiative transfer theory. The model describes the snowpack as a homogenous layer, using ef-fective values for parameters influencing scatter such as snow depth, density and grain size. The simulated snow grain size and density from SNTHERM were used along with measured snowpack temperature and snow depth as an input to HUT Model to
esti-10
mate the brightness temperatures. The measured soil temperature at the soil surface and 5 cm depth were averaged and used as the soil temperature input to the HUT model.
The predicted brightness temperature from the HUT model was compared to the observed radiometric brightness temperature (Fig. 8) for the range on input parameters
15
given in Table 3. Atmospheric effects on the estimated brightness temperature were neglected, since the microwave data were acquired from a ground-mounted radiometer a minimal distance from snow characteristics being measured. It should be noted that the observed brightness temperatures were averaged for each of the 5 distinct snow categories. Figure 7 shows how the combination of the HUT model and SNTHERM
20
was able to simulate the microwave emission from the characterized snowpack with relatively good accuracy, and showed potential to discriminate between different snow conditions. However, uncertainties related to the averaging of the model inputs need to be investigated. Notably, errors in the simulation (Table 4) show a correlation with the variability in the input parameters: the larger the variability, the bigger the error.
HESSD
9, 8105–8136, 2012CREST-Snow Field Experiment: analysis
of snowpack properties
T. Lakhankar et al.
Title Page
Abstract Introduction
Conclusions References
Tables Figures
◭ ◮
◭ ◮
Back Close
Full Screen / Esc
Printer-friendly Version Interactive Discussion
Discussion
P
a
per
|
Dis
cussion
P
a
per
|
Discussion
P
a
per
|
Discussio
n
P
a
per
|
5 Conclusions
In the initial phase of the CREST-SAFE field experiment, carried out during January to March 2011 and reported here, microwave and surface observations were collected to analyze snowpack transitions from dry to wet through melting conditions and their impact on passive microwave retrievals. We found that both snow grain size and snow
5
temperatures have significant effects on brightness temperature at the 37 and 89 GHz channels. The simulated snowpack temperature using SNTHERM were shown good correlation with observed in-situ snowpack temperature. This type of long term field experiment allows the research community to improve our understanding of microwave radiative transfer during melting-refreezing, snow metamorphism, and under various
10
meteorological conditions.
More investigation is needed to quantify the thickness of ice layers at the surface and within the snowpack and its impact on microwave emission. The effects of sensible heat flux, relative humidity and other meteorological parameters (including the wind effects which will speed up the melting and refreezing processes) on changes of the snow
15
grain size are still not understood completely and need more data and analysis. The largest discrepancies between our measurements and models of snowpack evolution and microwave radiative transfer models were seen during the snowmelt season, when large diurnal variations in microwave brightness temperature were observed, associ-ated with melting-refreezing cycles. More research is required to understand and
sim-20
ulate the snowpack properties’ effects on microwave measurements in order to enable accurate retrieval of ground snow conditions from satellite microwave measurements.
Since the work reported here, the CREST-SAFE facility has been expanded by adding new instruments to measure solar radiation, soil moisture (at 2.5, 5, and 10 cm), snow skin temperature, air temperature, humidity, snow weight, snow depth, and
25
HESSD
9, 8105–8136, 2012CREST-Snow Field Experiment: analysis
of snowpack properties
T. Lakhankar et al.
Title Page
Abstract Introduction
Conclusions References
Tables Figures
◭ ◮
◭ ◮
Back Close
Full Screen / Esc
Printer-friendly Version Interactive Discussion
Discussion
P
a
per
|
Dis
cussion
P
a
per
|
Discussion
P
a
per
|
Discussio
n
P
a
per
|
will include quantifying the thickness of ice layers at the surface and within the snow-pack caused by melting and refreezing of snow and ice and their effect on microwave emissivity. The effect of within-snowpack temperature gradients on snow grain size and microwave emission will also be investigated further using multilayer snowpack radia-tive transfer models. Also, the impact of the seasonal behavior of snow grain size on
5
brightness temperature will be better quantified. The continuation of long term obser-vations of in situ snow properties combined with microwave radiances will facilitate the assessment of current snow retrieval algorithms and their capability to infer snow properties under different meteorological conditions.
Acknowledgements. This study was supported and monitored by National Oceanic and
At-10
mospheric Administration (NOAA) under Grant NA06OAR4810162. The views, opinions, and findings contained in this report are those of the authors and should not be construed as an of-ficial National Oceanic and Atmospheric Administration or U.S. Government position, policy, or decision. The authors also acknowledge Peter Rahe and Bill Desjardins from NOAA’s National Weather Service in Caribou, Maine for their help in the experiment setup. Thanks to Fred
Sol-15
heim and team from the Radiometric Corporation for their quick help in instrument calibration and operation and thank J. Pulliainen and Juha Lemmetyinen from Helsinki University of Tech-nology for providing the HUT model. Thanks to Marouane Temimi for useful discussion and comments on preparation of the experiment and this manuscript.
References 20
Azar, A. E., Ghedira, H., Romanov, P., Mahani, S., Tedesco, M., and Khanbilvardi, R.: Appli-cation of Satellite Microwave Images in Estimating Snow Water Equivalent, J. Am. Water Resour. As., 44, 1347–1362, doi:10.1111/j.1752-1688.2008.00227.x, 2008.
Brucker, L., Royer, A., Picard, G., Langlois, A., and Fily, M.: Hourly simulations of the microwave brightness temperature of seasonal snow in Quebec, Canada, using
25
a coupled snow evolution-emission model, Remote Sens. Environ., 115, 1966–1977, doi:10.1016/j.rse.2011.03.019, 2011.
HESSD
9, 8105–8136, 2012CREST-Snow Field Experiment: analysis
of snowpack properties
T. Lakhankar et al.
Title Page
Abstract Introduction
Conclusions References
Tables Figures
◭ ◮
◭ ◮
Back Close
Full Screen / Esc
Printer-friendly Version Interactive Discussion
Discussion
P
a
per
|
Dis
cussion
P
a
per
|
Discussion
P
a
per
|
Discussio
n
P
a
per
|
Chang, A. T. C., Kelly, R. E. J., Foster, J. L., and Hall, D. K.: Global SWE monitoring using AMSR-E data, Geoscience and Remote Sensing Symposium, 2003, IGARSS 2003, Pro-ceedings., 1, 680–682, doi:10.1109/IGARSS.2003.1293880, 2003.
Durand, M., Kim, E. J., and Margulis, S. A.: Quantifying Uncertainty in Modeling Snow Mi-crowave Radiance for a Mountain Snowpack at the Point-Scale, Including Stratigraphic
Ef-5
fects, IEEE T. Geosci. Remote, 46, 1753–1767, doi:10.1109/TGRS.2008.916221, 2008. Elder, K., Cline, D., Liston, G. E., and Armstrong, R.: NASA Cold Land Processes Experiment
(CLPX 2002/03): Field Measurements of Snowpack Properties and Soil Moisture, J. Hydrom-eteorol., 10, 320–329, doi:10.1175/2008JHM877.1, 2009.
Erman, D. C., Andrews, E. D., and Yoder-Williams, M.: Effects of Winter Floods on Fishes in the
10
Sierra Nevada, Can. J. Fish Aquat. Sci., 45, 2195–2200, 1988.
Foster, J. L., Chang, A. T. C., and Hall, D. K.: Comparison of Snow Mass Estimates from a Prototype Passive Microwave Snow Algorithm, a Revised Algorithm and a Snow Depth Cli-matology, Remote Sens. Environ., 62, 132–142, 1997.
Grody, N.: Surface identification using satellite microwave radiometers, IEEE, T. Geosci.
Re-15
mote, 26, 850–859, 1988.
Grody, N.: Relationship between snow parameters and microwave satellite measurements: Theory compared with Advanced Microwave Sounding Unit observations from 23 to 150 GHz, J. Geophys. Res., 113, 1–17, doi:10.1029/2007JD009685, 2008.
Grody, N. C. and Basist, A. N.: Global identification of snowcover using SSM/I measurements,
20
IEEE T. Geosci. Remote, 34, 237–249, doi:10.1109/36.481908, 1996.
Hewison, T. J. and English, S. J.: Airborne retrievals of snow and ice surface emissivity at millimeter wavelengths, IEEE T. Geosci. Remote, 37, 1871–1879, doi:10.1109/36.774700, 1999.
Jordan, R.: A One-Dimensional Temperature Model for a Snow Cover: Technical
Documenta-25
tion for SNTHERM.89., U.S. Army Corps of Engineers, Cold Regions Research and Engi-neering Laboratory, 1991.
Kelly, R. E., Chang, A., Tsang, L., and Foster, J. L.: A prototype AMSR-E global snow area and snow depth algorithm, IEEE T. Geosci. Remote, 41, 230–242, 2003.
Kongoli, C., Grody, N. C., and Ferraro, R. R.: Interpretation of AMSU microwave measurements
30
HESSD
9, 8105–8136, 2012CREST-Snow Field Experiment: analysis
of snowpack properties
T. Lakhankar et al.
Title Page
Abstract Introduction
Conclusions References
Tables Figures
◭ ◮
◭ ◮
Back Close
Full Screen / Esc
Printer-friendly Version Interactive Discussion
Discussion
P
a
per
|
Dis
cussion
P
a
per
|
Discussion
P
a
per
|
Discussio
n
P
a
per
|
Langlois, A., Barber, D. G., and Hwang, B. J.: Development of a winter snow water equivalent algorithm using in situ passive microwave radiometry over snow-covered first-year sea ice, Remote Sens. Environ., 106, 75–88, doi:10.1016/j.rse.2006.07.018, 2007.
Langlois, A., Kohn, J., Royer, A., Cliche, P., Brucker, L., Picard, G., Fily, M., Derk-sen, C., and Willemet, J. M.: Simulation of Snow Water Equivalent (SWE) Using
5
Thermodynamic Snow Models in Qu ´ebec, Canada, J. Hydrometeorol., 10, 1447–1463, doi:10.1175/2009JHM1154.1, 2009.
Macelloni, G., Paloscia, S., Pampaloni, P., Brogioni, M., Ranzi, R., and Crepaz, A.: Monitor-ing of meltMonitor-ing refreezMonitor-ing cycles of snow with microwave radiometers: the Microwave Alpine Snow Melting Experiment (MASMEx 2002–2003), IEEE T. Geosci. Remote, 43, 2431–2442,
10
doi:10.1109/TGRS.2005.855070, 2005.
McCabe, G. J., Hay, L. E., and Clark, M. P.: Rain-on-Snow Events in the Western United States, B. Am Meteorol. Soc., 88, 319–328, doi:10.1175/BAMS-88-3-319, 2007.
Papa, F., Prigent, C., and Rossow, W. B.: Ob’ River flood inundations from satellite observations: A relationship with winter snow parameters and river runoff, J. Geophys. Res., 112, 1–11,
15
doi:10.1029/2007JD008451, 2007.
Pulliainen, J., Grandell, J., and Hallikainen, M. T.: HUT snow emission model and its applicability to snow water equivalent retrieval, IEEE T. Geosci. Remote, 37, 1378–1390, 1999.
Romanov, P., Gutman, G., and Csiszar, I.: Automated monitoring of snow cover over North America with multispectral satellite data, J. Appl. Meteorol., 39, 1866–1880, 2000.
20
Rosenfeld, S. and Grody, N. C.: Metamorphic signature of snow revealed in SSM/I measure-ments, IEEE T. Geosci. Remote, 38, 53–63, doi:10.1109/36.823901, 2000.
Simic, A., Fernandes, R., Brown, R., Romanov, P., and Park, W.: Validation of VEGETATION, MODIS, and GOES+SSM/I snow-cover products over Canada based on surface snow depth observations, Hydrol Process., 18, 1089–1104, doi:10.1002/hyp.5509, 2004.
25
Singh, P., Spitzbart, G., Hubl, H. and Weinmeister, H. W.: Hydrological response of snow-pack under rain-on-snow events: a field study, J. Hydrol., 202, 1–20, doi:10.1016/S0022-1694(97)00004-8, 1997.
Tiuri, M., Sihvola, A., Nyfors, E., and Hallikaiken, M.: The complex dielectric constant of snow at microwave frequencies, IEEE J. Oceanic Eng., 9, 377–382, doi:10.1109/JOE.1984.1145645,
30
HESSD
9, 8105–8136, 2012CREST-Snow Field Experiment: analysis
of snowpack properties
T. Lakhankar et al.
Title Page
Abstract Introduction
Conclusions References
Tables Figures
◭ ◮
◭ ◮
Back Close
Full Screen / Esc
Printer-friendly Version Interactive Discussion
Discussion
P
a
per
|
Dis
cussion
P
a
per
|
Discussion
P
a
per
|
Discussio
n
P
a
per
|
Ulaby, F. T. and Stiles, W. H.: The Active and Passive Microwave Response to Snow Parameters 2. Water Equivalent of Dry Snow, J. Geophys. Res., 85, 1045–1049, doi:10.1029/JC085iC02p01045, 1980.
Wiesmann, A. and M ¨atzler, C.: Microwave Emission Model of Layered Snowpacks, Remote Sens. Environ., 70, 307–316, doi:10.1016/S0034-4257(99)00046-2, 1999.
HESSD
9, 8105–8136, 2012CREST-Snow Field Experiment: analysis
of snowpack properties
T. Lakhankar et al.
Title Page
Abstract Introduction
Conclusions References
Tables Figures
◭ ◮
◭ ◮
Back Close
Full Screen / Esc
Printer-friendly Version Interactive Discussion
Discussion
P
a
per
|
Dis
cussion
P
a
per
|
Discussion
P
a
per
|
Discussio
n
P
a
per
|
Table 1.Observed statistics of brightness temperature (K) for snow conditions.
Snow Class 37 H 37 V 89 H 89 V
min max Mean Std min max Mean Std min Max Mean Std min max Mean Std
HESSD
9, 8105–8136, 2012CREST-Snow Field Experiment: analysis
of snowpack properties
T. Lakhankar et al.
Title Page
Abstract Introduction
Conclusions References
Tables Figures
◭ ◮
◭ ◮
Back Close
Full Screen / Esc
Printer-friendly Version Interactive Discussion
Discussion
P
a
per
|
Dis
cussion
P
a
per
|
Discussion
P
a
per
|
Discussio
n
P
a
per
|
Table 2.Statistical comparison of observed and modeled (SNTHERM) soil and snowpack tem-perature above and below soil surface.
Sensor Correlation Mean Absolute Difference Level (cm) Coefficient (R) (MSD) in◦C
T(−10) 0.813 0.695 T(−5) 0.834 0.541
T(0) 0.847 0.744
T(5) 0.850 1.091
T(10) 0.905 1.161
T(15) 0.910 2.050
T(20) 0.803 1.895
T(25) 0.759 3.383
T(30) 0.733 2.636
T(38) 0.507 2.335
T(46) 0.877 2.784
HESSD
9, 8105–8136, 2012CREST-Snow Field Experiment: analysis
of snowpack properties
T. Lakhankar et al.
Title Page
Abstract Introduction
Conclusions References
Tables Figures
◭ ◮
◭ ◮
Back Close
Full Screen / Esc
Printer-friendly Version Interactive Discussion
Discussion
P
a
per
|
Dis
cussion
P
a
per
|
Discussion
P
a
per
|
Discussio
n
P
a
per
|
Table 3.Range of input parameters used to estimate the brightness temperature (K) from HUT snow emission model.
Property Fresh (LD) Fresh (HD) Aged Melting Refreezing Reference Min Max Mean Std Min Max Mean Std Min Max Mean Std Min Max Mean Std Min Max Mean Std Snow Density(g cm−3) 0.10 0.20 0.14 0.02 0.05 0.28 0.17 0.04 0.10 0.34 0.26 0.03 0.10 0.41 0.34 0.08 0.10 0.41 0.34 0.08 SNTHERM
HESSD
9, 8105–8136, 2012CREST-Snow Field Experiment: analysis
of snowpack properties
T. Lakhankar et al.
Title Page
Abstract Introduction
Conclusions References
Tables Figures
◭ ◮
◭ ◮
Back Close
Full Screen / Esc
Printer-friendly Version Interactive Discussion
Discussion
P
a
per
|
Dis
cussion
P
a
per
|
Discussion
P
a
per
|
Discussio
n
P
a
per
|
Table 4.Comparison of observed and simulated brightness temperature for snow conditions using HUT snow emission model.
Simulated Brightness Difference between Snow Class Temperature Observed and Simulated
37 H 37 V 89 H 89 V 37 H 37 V 89 H 89 V Fresh (LD) 264.3 267.3 261.0 264.0 −11.1 −4.3 −23.4 −13.4
Fresh (HD) 242.0 248.0 173.1 176.8 −9.2 2.4 12.1 27.4
Aged 220.0 232.0 141.0 145.5 −41.0 −19.4 −13.8 1.8
Melting 231.0 262.0 251.0 264.0 8.9 −9.4 −27.1 −25.6
HESSD
9, 8105–8136, 2012CREST-Snow Field Experiment: analysis
of snowpack properties
T. Lakhankar et al.
Title Page
Abstract Introduction
Conclusions References
Tables Figures
◭ ◮
◭ ◮
Back Close
Full Screen / Esc
Printer-friendly Version Interactive Discussion
Discussion
P
a
per
|
Dis
cussion
P
a
per
|
Discussion
P
a
per
|
Discussio
n
P
a
per
|
Site
HESSD
9, 8105–8136, 2012CREST-Snow Field Experiment: analysis
of snowpack properties
T. Lakhankar et al.
Title Page
Abstract Introduction
Conclusions References
Tables Figures
◭ ◮
◭ ◮
Back Close
Full Screen / Esc
Printer-friendly Version Interactive Discussion
Discussion
P
a
per
|
Dis
cussion
P
a
per
|
Discussion
P
a
per
|
Discussio
n
P
a
per
|
(a) (b)
HESSD
9, 8105–8136, 2012CREST-Snow Field Experiment: analysis
of snowpack properties
T. Lakhankar et al.
Title Page
Abstract Introduction
Conclusions References
Tables Figures
◭ ◮
◭ ◮
Back Close
Full Screen / Esc
Printer-friendly Version Interactive Discussion
Discussion
P
a
per
|
Dis
cussion
P
a
per
|
Discussion
P
a
per
|
Discussio
n
P
a
per
|