ACPD
8, 12343–12370, 2008Ozone prediction by means of a fuzzy reasoning approach
A. Nebot et al.
Title Page
Abstract Introduction
Conclusions References
Tables Figures
◭ ◮
◭ ◮
Back Close
Full Screen / Esc
Printer-friendly Version
Interactive Discussion
Atmos. Chem. Phys. Discuss., 8, 12343–12370, 2008 www.atmos-chem-phys-discuss.net/8/12343/2008/ © Author(s) 2008. This work is distributed under the Creative Commons Attribution 3.0 License.
Atmospheric Chemistry and Physics Discussions
Ozone prediction based on
meteorological variables: a fuzzy
inductive reasoning approach
A. Nebot1, V. Mugica2, and A. Escobet3
1
Universitat Polit `ecnica de Catalunya, Barcelona, Spain
2
Universidad Aut ´onoma Metropolitana-Azcapotzalco, Mexico D. F., Mexico
3
Universitat Polit `ecnica de Catalunya, Manresa, Spain
Received: 21 May 2008 – Accepted: 29 May 2008 – Published: 25 June 2008 Correspondence to: A. Nebot ([email protected])
ACPD
8, 12343–12370, 2008Ozone prediction by means of a fuzzy reasoning approach
A. Nebot et al.
Title Page
Abstract Introduction
Conclusions References
Tables Figures
◭ ◮
◭ ◮
Back Close
Full Screen / Esc
Printer-friendly Version
Interactive Discussion
Abstract
MILAGRO project was conducted in Mexico City during March 2006 with the main objective of study the local and global impact of pollution generated by megacities. The research presented in this paper is framed in MILAGRO project and is focused on the study and development of modeling methodologies that allow the forecasting of daily 5
ozone concentrations. The present work aims to develop Fuzzy Inductive Reasoning (FIR) models using the Visual-FIR platform. FIR offers a model-based approach to modeling and predicting either univariate or multivariate time series. Visual-FIR offers an easy-friendly environment to perform this task. In this research, long term prediction of maximum ozone concentration in the downtown of Mexico City Metropolitan Area is 10
performed. The data were registered every hour and include missing values. Two modeling perspectives are analyzed, i.e. monthly and seasonal models. The results show that the developed models are able to predict the diurnal variation of ozone, including its maximum daily value in an accurate manner.
1 Introduction
15
With the expectation to determine the temporal and spatial
mag-nitude of the plume of pollutants in megacities, the MILAGRO
(http://www.windows.ucar.edu/tour/link=/milagro/megacities.html) project took place in March 2006 using Mexico City Metropolitan Area (MCMA) as a case study, in order to better understand how and when pollutants from the city are eliminated by 20
the atmosphere, and their regional and global impacts. Although the ozone levels have been reduced in the last years, the Mexican standard for maximum ozone concentration (0.11 ppm, hourly average) is exceeded around 61% of the days of the year with concentrations up to 0.29 ppm (GDF, 2005). Unlike the majority of the cities in the northern hemisphere, where the troposphere ozone phenomenon is only 25
ACPD
8, 12343–12370, 2008Ozone prediction by means of a fuzzy reasoning approach
A. Nebot et al.
Title Page
Abstract Introduction
Conclusions References
Tables Figures
◭ ◮
◭ ◮
Back Close
Full Screen / Esc
Printer-friendly Version
Interactive Discussion
presents favorable conditions for the formation of O3throughout the year.
In these circumstances, it is extremely important and useful to provide early warn-ings of high levels of ozone concentration for an effective air quality management, so the authorities can react as fast as possible to reduce the associated risks to human health. To this end, it is necessary to have accurate and reliable forecasts of future 5
high ozone levels. Therefore, the construction of ozone models capable to predict the daily maximum concentration levels of this gas in the atmosphere is of interest not only for environmental scientists but also for government agencies and policy makers.
There are many different models available for local scale predictions of air quality and for ozone level forecasting. Some of these use classical methods based on numerical 10
algorithms and statistical approaches (Comrie, 1997; Soja and Soja, 1999; Koc¸ak et al., 2000; Chenevez and Jensen, 2001; Slini et al., 2002; Lengyel et al., 2004; Lu et al., 2004; Sousa et al., 2006; G ´omez-Sanchis et al., 2006). Others use the chemi-cal/physical knowledge (Stohl et al., 1996). In recent years other paradigms such as neural networks (NN) (Wieland and Wotawa, 1999; Abdul-Wahab and Al-Alawi, 2002; 15
Wang et al., 2003; Wang and Lu, 2006a, 2006b), decision trees or association rules (Wotawa and Wotawa, 2001; Rohli et al., 2003) have been used for the same purpose. It can be found, also, modeling efforts that use fuzzy logic (Peton et al., 2000; G ´omez et al., 2003; Onkal-Engin et al., 2004; Ghiaus, 2005) or hybrid NN and fuzzy logic ap-proaches (Morabito and Versaci, 2003; Heo and Kim, 2004; Yildirim and Bayramoglu, 20
2006). Ozone is the pollutant that has received more attention from the modeling and prediction perspective, due to the harmful effects that cause in humans and its in-creasing levels in big cities. Both, daily and hourly models are found in the literature. However, daily models are more common and a small number of works deal with hourly models. Another interesting aspect is the prediction term, i.e. short vs. long term pre-25
ACPD
8, 12343–12370, 2008Ozone prediction by means of a fuzzy reasoning approach
A. Nebot et al.
Title Page
Abstract Introduction
Conclusions References
Tables Figures
◭ ◮
◭ ◮
Back Close
Full Screen / Esc
Printer-friendly Version
Interactive Discussion
contains as input the variable ozone. Almost all the works present short term prediction models. However, from our point of view, long term prediction models are more useful when the goal is to prevent possible environmental contingencies.
The main goal of this paper is to develop fuzzy inductive reasoning ozone forecast models for the centre area of MCMA. This research analyses two different modeling 5
perspectives. On the one hand, the identification of ozone models for a specific month of the year. On the other hand, the identification of ozone models for a specific season of the year. For the first study, March is used, because is the month when the MILA-GRO campaign took place. For the second study the dry season (March until June) is selected, due to the same reason, i.e. is the MILAGRO project season. The num-10
ber of variables considered, the high frequency of the signals (hourly models) and the fact that it is intended to perform long term predictions, increases the complexity of the application. An additional problem is the presence of missing values in the registered data due to the fails in the monitoring station.
2 Description of fuzzy inductive reasoning methodology
15
The conceptualization of the FIR methodology arises of the General System Problem Solving (GSPS) approach proposed by Klir (Klir and Elias, 2002). This methodology of modeling and simulation is able to obtain good qualitative relations between the variables that compose the system and to infer future behavior of that system. It has the ability to describe systems that cannot easily be described by classical mathematics or 20
statistics, i.e. systems for which the underlying physical laws are not well understood. The Fuzzy Inductive Reasoning (FIR) methodology, offers a model-based approach to predicting either univariate or multi-variate time series (Nebot et al., 2003; Carvajal and Nebot, 1998). A FIR model is a qualitative, non-parametric, shallow model based on fuzzy logic. Fuzzy logic-based methods have not been applied extensively in en-25
ACPD
8, 12343–12370, 2008Ozone prediction by means of a fuzzy reasoning approach
A. Nebot et al.
Title Page
Abstract Introduction
Conclusions References
Tables Figures
◭ ◮
◭ ◮
Back Close
Full Screen / Esc
Printer-friendly Version
Interactive Discussion
Heo and Kim, 2004; Yildirim and Bayramoglu, 2006; Peton et al., 2000; Onkal-Engin et al., 2004), where different hybrid methods that make use of fuzzy logic are presented for this task.
Visual-FIR is a tool based on the Fuzzy Inductive Reasoning (FIR) methodology (runs under Matlab environment), that offers a new perspective to the modeling and 5
simulation of complex systems. Visual-FIR designs process blocks that allow the treat-ment of the model identification and prediction phases of FIR methodology in a com-pact, efficient and user friendly manner (Escobet et al., 2007).
The FIR model consists of its structure (relevant variables) and a set of input/output relations (history behavior) that are defined as if-then rules. Feature selection in FIR is 10
based on the maximization of the models’ forecasting power quantified by a Shannon entropy-based quality measure. The Shannon entropy measure is used to determine the uncertainty associated with forecasting a particular output state given any legal input state. The overall entropy of the FIR model structure studied,Hs, is computed as described in Eq. (1).
15
Hs =−X
∀i
p(i)·Hi, (1)
wherep(i) is the probability of that input state to occur andHi is the Shannon entropy relative to theithinput state. A normalized overall entropyHnis defined in Eq. (2).
Hn=1− Hs
Hmax (2)
Hn is obviously a real-valued number in the range between 0.0 and 1.0, where higher 20
values indicate an improved forecasting power. The model structure with highestHn
value generates forecasts with the smallest amount of uncertainty.
ACPD
8, 12343–12370, 2008Ozone prediction by means of a fuzzy reasoning approach
A. Nebot et al.
Title Page
Abstract Introduction
Conclusions References
Tables Figures
◭ ◮
◭ ◮
Back Close
Full Screen / Esc
Printer-friendly Version
Interactive Discussion
(5NN) fuzzy inferencing algorithm (Cellier et al., 1995) the five rules with the smallest distance measure are selected and a distance-weighted average of their fuzzy mem-bership functions is computed and used to forecast the fuzzy memmem-bership function of the current state, as described in Eq. (3).
Memboutnew= 5 X
j=1 wrel
j ·Memboutj (3)
5
The weightswrel
j are based on the distances and are numbers between 0.0 and 1.0. Their sum is always equal to 1.0. It is therefore possible to interpret the relative weights as percentages.
3 Methodology
3.1 Data 10
The data used for this study stems from the MILAGRO project and the Atmospheric Monitoring System of Mexico City (SIMAT in Spanish) that measures contaminants and atmospheric variables from 36 stations distributed through the 5 regions of the Mexico City metropolitan area (SIMAT, 2007). The registered variables are the criteria pollutants, including ozone, as well as temperature, relative humidity, wind speed and 15
wind direction meteorological variables, 24 h per day, every day of the year. The web page of SIMAT (SIMAT, 2007) offers a data base with meteorological and contaminant registers since 1986 up to date.
This study is centered on the modeling of ozone in the Merced station of SIMAT, lo-cated at the downtown of MCMA. The data measured from January 2002 to December 20
2006, were used for the forecast models.
ACPD
8, 12343–12370, 2008Ozone prediction by means of a fuzzy reasoning approach
A. Nebot et al.
Title Page
Abstract Introduction
Conclusions References
Tables Figures
◭ ◮
◭ ◮
Back Close
Full Screen / Esc
Printer-friendly Version
Interactive Discussion
hour of day, were hourly instantaneous observations, not the maximum or the mean of minute registered data.
3.2 Fuzzy models development
In this study two modeling approaches have been defined. The first one studies the modeling of the ozone behavior during a specific month of the year. The second one 5
is centered on the ozone modeling of a certain season of the year. Some model-ing aspects that are common to both perspectives are described. The first step after data loading is to convert quantitative values in fuzzy data, to this end, it is necessary to specify two discretization parameters, i.e. number of classes per system variable (granularity) and the membership functions (landmarks) that define its semantics. In 10
this study all the variables, except HD and O3, were discretized into two classes. Hour of day (HD) and ozone (O3) variables were discretized into three classes following the recommendation of environmental experts. The interval values (landmarks) associated to each class for all the variables are shown in Table 2.
The next step is to find the model structure, i.e. perform feature selection in order 15
to discover the input variables that are more relevant to predict future ozone behavior. The input variables used are shown in Table 1. Notice that all variables, except O3, shown in the first column of Table 1 are included in the study in three different time delays (column 3), i.e. present time (t), one sample time in the past (t−δt) and two sample times in the past (t−2δt). Remember that in this study the sample time, δt, 20
ACPD
8, 12343–12370, 2008Ozone prediction by means of a fuzzy reasoning approach
A. Nebot et al.
Title Page Abstract Introduction Conclusions References Tables Figures ◭ ◮ ◭ ◮ Back Close
Full Screen / Esc
Printer-friendly Version
Interactive Discussion
3.3 Model evaluation
Several statistical indices were used to evaluate the performance of each of the FIR ozone models. These are: the root mean square error, the mean absolute error, the false alarm rate and the detection rate. The root mean square error (RMSE) is de-scribed in Eq. (4).
5 RMSE= v u u u t N P
i=1
(yi(t)−yˆi(t))2
N (4)
whereˆy(t) is the predicted output,y(t) the system output andNthe number of samples. The mean absolute error (MAE) is defined in Eq. (5).
MAE=1
N
N X
i=1
|yi(t)−yˆi(t)| (5)
The false alarm rate (FAR) is defined as the ratio of false alarms with respect the to-10
tal number of alarms predicted by the model. The detection rate (DR) is the ratio of detected exceedences with respect the number of total observed exceedences. Fol-lowing the work of Lin and Cobourn (Lin and Cobourn, 2007), in this study the threshold for alarms was 80 ppb while the exceedence threshold was 85 ppb. The difference of 5 ppb corresponds to the tolerance accepted to prevent some very close predictions 15
from being considered wrong-classified events.
4 Results
4.1 Monthly models
ACPD
8, 12343–12370, 2008Ozone prediction by means of a fuzzy reasoning approach
A. Nebot et al.
Title Page
Abstract Introduction
Conclusions References
Tables Figures
◭ ◮
◭ ◮
Back Close
Full Screen / Esc
Printer-friendly Version
Interactive Discussion
as training data whereas March of 2006 was used as test data to show the performance of the models identified for ozone forecasting during the month of March. The total data set contains 2976 registers, from which 399 are missing values. Missing data is distributed through all the variables except hour of day. In order to avoid the generation of inexistent relationships, a five raw gap of missing values have been added in the 5
concatenation of March data of different years.
Table 3 presents the best model structures found in the feature selection process of FIR methodology. The first column of Table 3 presents the relevant input variables encountered for the best models. The rest of the columns shows the RMSE, MAE, FAR and DR indices when these FIR models were used to predict the test data set, i.e. 10
March 2006. Notice that the variables hour of day, wind direction and ozone are se-lected in all the models obtained, meaning that these variables are very relevant. Wind speed variable is also considered as important to increment the accuracy of the pre-diction, when the number of relevant variables grows. Notice that the temperature and the relative humidity were not selected, meaning that they do not influence significantly 15
on the ozone behavior during the month of March.
Figure 1 shows the prediction results obtained using the FIR model presented in the first row of Table 3. The continuous line corresponds to the real data whereas the dashed line represents the predicted signal. As seen in Fig. 1 the RMSE obtained is of 0.0137, a small value if we take into account that a long term prediction is performed. 20
Table 3 present the MAE, FAR and DR statistics for the monthly models. Small values of RMSE and MAE were obtained for the best three models structures presented. The number of false alarms is quite low (the maximum is 0.16 and the minimum 0.05) and the detection rate has also good values (the maximum is 0.90 and the minimum 0.71). These values compare favorably to those reported in (Lin and Cobourn, 2007) 25
and (Chaloulakou et al., 1999) for ozone forecast models. As discussed by Lin and Cobourn in their paper, a DR above 50% should already be considered good results.
mod-ACPD
8, 12343–12370, 2008Ozone prediction by means of a fuzzy reasoning approach
A. Nebot et al.
Title Page
Abstract Introduction
Conclusions References
Tables Figures
◭ ◮
◭ ◮
Back Close
Full Screen / Esc
Printer-friendly Version
Interactive Discussion
els that are able to predict ozone behavior not only one hour ahead, but some days ahead, in such a way that prevention measures can be taken before a contingency takes place. That is the reason why we decided to test the ozone models by predicting the contaminant during a complete month in a unique run. If these models are used in real life, a prediction of maximum one week in advance is recommended, due to the 5
fact that the ozone prediction is based on the atmospheric data forecast. The plot of Fig. 1 shows that the FIR model is capable of properly forecasting the high frequencies of the signal, and it is capable of forecasting ozone concentration behavior in quite an accurate way one month in advance. However, it is interesting to look closer to ozone maximum values for each day, since the prediction of ozone maximum values per day 10
is not very accurate after one week, using the long term prediction approach. There are high levels of ozone not reached by the FIR models in either of the modeling per-spectives, for instance, days 8, 11 and 30. The first row of Table 5 presents the number of March days that fall in each error deviation percentage. The error deviation percent-age is computed from the difference between the maximum ozone value predicted per 15
day and the maximum ozone value observed for the same day, when the FIR monthly model of 6 relevant variables is used, i.e. prediction signal shown in Fig. 1. From the Table 5, it can be seen that nineteen days have an error deviation percentage lower than 20%, whereas the error deviation percentage is greater or equal to 20% for the rest of the days, i.e. eleven days.
20
4.2 Seasonal models
In this section a model that simulates the ozone pattern in the Dry season was iden-tified. The data measured in January, February and April was used as training data, whereas the test set corresponds to the data registered in March. The total training data set contains 2136 registers, from which 160 are missing values.
25
ACPD
8, 12343–12370, 2008Ozone prediction by means of a fuzzy reasoning approach
A. Nebot et al.
Title Page
Abstract Introduction
Conclusions References
Tables Figures
◭ ◮
◭ ◮
Back Close
Full Screen / Esc
Printer-friendly Version
Interactive Discussion
as the ones obtained by FIR for the March model (see Table 3). Here, as happened in March models, ozone at present time depends on wind direction and ozone levels one hour in the past and on hour of day, wind direction and wind speed values at present time. Therefore, this relation represents a qualitative pattern of ozone behavior in Dry seasons. It does not mater if we decide to use a monthly or a seasonal model 5
perspective, the ozone behavior pattern for the dry period remains the same. The values of the RMSE and MAE are also good for this modeling perspective as shown in Table 4. Moreover, the FAR and DR indices are also good for ozone prediction models. Figure 2 presents the prediction signal obtained when using the model of 6 relevant variables (see Table 4) obtained for the Dry season. As can be seen from the plot, the 10
prediction performance of FIR model is also good for a long term prediction basis. Notice that both modeling perspectives, i.e. monthly and seasonal, are comparable with respect their prediction performance. There are no significant differences between them that make to defend one vs. the other. The false alarm rate increase just a little in one of the models for the Dry season and the detection rate decrease also a little for 15
the Dry season. In this study both modeling options show good modeling power. As happened in the monthly models approach, the prediction performance of the maximum ozone values is reduced considerably after the first week, due to the fact that we use long term prediction. The second row of table 5 presents the error deviation percentages of the maximum ozone values predicted per day, when the FIR seasonal 20
model of 6 relevant variables is used, i.e. prediction signal shown in Fig. 2. From the table it can be seen that seventeen days have an error deviation percentage lower than 20%, whereas the error deviation percentage is greater or equal to 20% for the rest of the days, i.e. thirteen days.
The results presented in Table 5 for both modeling perspectives confirm that, even 25
ACPD
8, 12343–12370, 2008Ozone prediction by means of a fuzzy reasoning approach
A. Nebot et al.
Title Page
Abstract Introduction
Conclusions References
Tables Figures
◭ ◮
◭ ◮
Back Close
Full Screen / Esc
Printer-friendly Version
Interactive Discussion
in a unique run.
4.3 Daily models
In this section, the FIR models identified in the previous sections are used to perform daily predictions. The 8, 11 and 30 March were the days selected in this study because they are the ones in which the predicted maximum ozone values are less accurate, i.e. 5
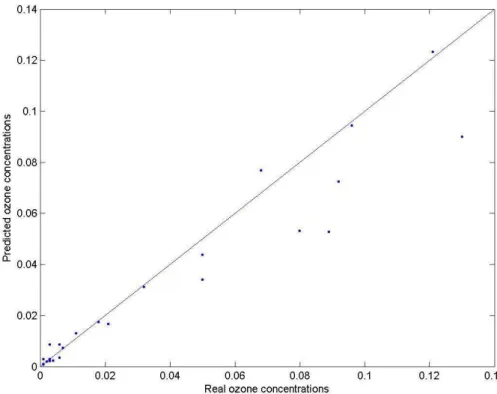
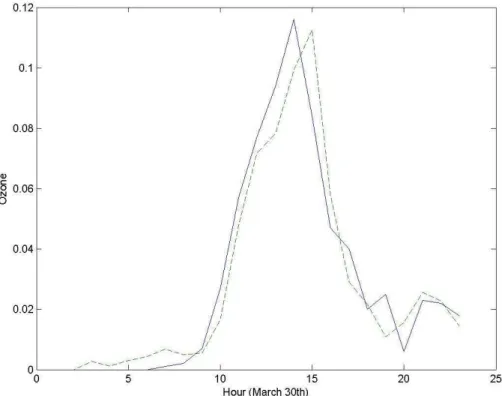
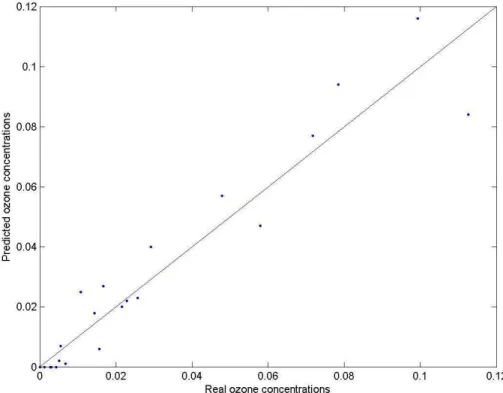
have higher errors when a long term run of one month is carried out. Table 6 presents the test RMSE of the predictions obtained when using the three FIR models obtained previously, for each of the days studied. The errors achieved are quite low and, now, ozone picks are reached more efficiently, as can be seen in Figs. 3 and 5. These figures show the observed vs. the predicted signals for days 8 and 30, respectively. 10
The predicted maximum values of ozone are much better than the ones obtained when one month long term predictions were preformed (see Figs. 1 and 2). Figures 4 and 6 show the scattered plot of the predictions presented in Figs. 3 and 5, respectively. As it can be seen from these figures, the predicted values fit quite well the observed values. For the three days studied the error deviation percentages are less than 15%, i.e., 5%, 15
14.6% and 3% for 8, 11, and 30 March, respectively.
As ozone formation is a non-linear process, methodologies that are able to deal with complex non-linear systems are needed. The FIR methodology is able to find and weight relationships that are difficult to subjectively be obtained and quantified. In comparison with statistical models, such as regression models which tend to under 20
predict high concentrations, fuzzy systems can predict extreme values more effectively. On the other side although fuzzy systems are complex and not commonly understood, once the model is developed, a forecaster does not need specific expertise to operate it, then it can be used by government agencies to prevent episodes of high ozone levels and take control action to diminish health risks to the population.
ACPD
8, 12343–12370, 2008Ozone prediction by means of a fuzzy reasoning approach
A. Nebot et al.
Title Page
Abstract Introduction
Conclusions References
Tables Figures
◭ ◮
◭ ◮
Back Close
Full Screen / Esc
Printer-friendly Version
Interactive Discussion
5 Conclusions
This paper was focused in the development of fuzzy inductive reasoning ozone forecast models, through the discovering of behavior patters of this pollutant in the downtown of Mexico City within the framework of MILAGRO project. Two different modeling per-spectives were studied, i.e. monthly models and seasonal models. It has been shown 5
that FIR methodology is capable of capturing the dynamic behavior of the system under study and to accurately predict the ozone signal in the downtown of MCMA in a long term basis. The two modeling approaches (monthly and seasonal) investigated with respect to the causal relations selected, lead us to the one and the same conclusion. In both cases, the FIR modeling process identifies hour of day, previous values of wind 10
direction and previous values of ozone as the most relevant variables for the predic-tion of future ozone concentrapredic-tion. However, we can go further in the conclusions of this research. The FIR models have found that wind speed becomes also important to predict ozone levels during the Dry season.
The prediction accuracy of maximum ozone daily values when a long term prediction 15
of one month in advance is performed was not good enough after the first week predic-tion. An experiment was carried out on the basis of a one day long term prediction, i.e., 24 h predicted in a unique run. The accuracy of FIR models in the ozone peaks of one day signals was noticeably increased. Visual-FIR is a friendly tool that can be used for any agency in order to prevent contingencies as well to develop long term strategies 20
without knowledge of fuzzy logic or qualitative modeling.
Acknowledgements. The research presented in this paper has been financially supported by Generalitat de Catalunya, under grant 2006-BE-00168.
References
Abdul-Wahab, S. A. and Al-Alawi, S. M.: Assessment and prediction of tropospheric ozone
25
ACPD
8, 12343–12370, 2008Ozone prediction by means of a fuzzy reasoning approach
A. Nebot et al.
Title Page Abstract Introduction Conclusions References Tables Figures ◭ ◮ ◭ ◮ Back Close
Full Screen / Esc
Printer-friendly Version
Interactive Discussion
2002.
Carvajal, R. and Nebot, A.: Growth model for white shrimp in semi-intensive farming using inductive reasoning methodology, Comput. Electron. Agr., 19, 187–210, 1998.
Cellier, F. E., Nebot, A., Mugica, F., and De Albornoz, A.: Combined qualitative/quantative simulation models of continuous-time processes using fuzzy inductive reasoning techniques,
5
Int. J. Gen. Sys., 24(1–2), 95–116, 1995.
Chaloulakou, A., Assimacopoulos, D., and Lekkas, T.: Forecasting daily maximum ozone con-centrations in the Athens Basin, Environ. Monit. Assess., 56, 97–112, 1999.
Chenevez, J. and Jensen, C. O.: Operational ozone forecast for the region of Copenhagen by the Danish Meteorological Institute, J. Atmos. Environ., 35, 4567–4580, 2001.
10
Comrie, A. C.: Comparing Neural Networks and Regression Models for Ozone Forecasting, Air and Waste Management, 47, 653–663, 1997.
Escobet, A., Nebot., A., and Cellier, F. E.: Visual-FIR as a tool for model identification and prediction of dynamical complex systems, Simul. Model. Pract. Th., 16, 76–92, 2008. Ghiaus, C.: Linear fuzzy-discriminant analysis applied to forecast ozone concentration classes
15
in sea-breeze regime, Atmos. Environ., 39, 4691–4702, 2005.
Gobierno del Distrito Federal (GDF): Informe de la calidad del aire y tendencias 2004 Zona Metropolitana de la Ciudad de M ´exico, 2005.
G ´omez, P., Nebot, A., Ribeiro, S., Alqu ´ezar, R., Mugica, F., and Wotawa, F.: Local maximum ozone concentration prediction using soft computing methodologies, Syst. Anal. Model. Sim.,
20
43(8), 1011–1031, 2003.
G ´omez-Sanchis, J., Mart´ın-Guerrero, J. D., Soria-Olivas, E., Vila-Franc ´es, J., Carrasco, J. L., and del Valle-Tasc ´on, S.: Neural networks for analysing the relevance of input variables in the prediction of tropospheric ozone conecntration, Atmos. Environ., 40, 6173–6180, 2006. Heo, J. S. and Kim, D. S.: A new method of ozone forecasting using fuzzy expert and neural
25
network system, Sci. Total Environ., 325, 221–237, 2004.
Klir, G. and Elias, D.: Architecture of Systems Problem Solving, 2nd Ed., Plenum Press, NY, 2002.
Koc¸ak, K., Saylan, L., and Sen, O.: Nonlinear time series prediction of O3 concentration in Istanbul, Atmos. Environ., 34, 1267–1271, 2000.
30
ACPD
8, 12343–12370, 2008Ozone prediction by means of a fuzzy reasoning approach
A. Nebot et al.
Title Page Abstract Introduction Conclusions References Tables Figures ◭ ◮ ◭ ◮ Back Close
Full Screen / Esc
Printer-friendly Version
Interactive Discussion
ground-level ozone predictions, J. Atmos. Environ., 41(16), 3502–3513, 2007.
Lu, W. Z., Wang, W. J., Wang, X. K., Yan, S. H., and Lam, J. C.: Potential assessment of a neural network model with PCA/RBF approach for forecasting pollutant trends in Mong Kok urban air, Hong Kong, Environ. Res., 96, 79–87, 2004.
Mintz, R., Young, B. R., and Svrcek, W. Y.: Fuzzy logic modeling of surface ozone
concentra-5
tions, Comput. Chem. Eng., 29, 2049–2059, 2005.
Morabito, F. C. and Versaci, M.: Fuzzy neural identification and forecasting techniques to pro-cess experimental urban air pollution data, Neural Networks, 16, 493–506, 2003.
Nebot, A., Mugica, F., Cellier, F., and Vallverd ´u, M.: Modeling and simulation of the central nervous system control with generic fuzzy models, Simulation, 79(11), 648–669, 2003.
10
Onkal-Engin, G., Demir, I., and Hiz, H.: Assessment of urban air quality in Istanbul using fuzzy synthetic evaluation, Atmos. Environ., 38, 3809–3815, 2004.
Peton, N., Dray, G., Pearson, D., Mesbah, M., and Vuillot, B.: Modelling and analysis of ozone episodes, Environ. Modell. Softw., 15, 647–652, 2000.
Rohli, R. V., Hsu, S. A., Blanchard, B. W., and Fontenot, R. L.: Short-range prediction of
15
tropospheric ozone concentrations and exceedances for Baton Rouge, Louisiana, Weather Forecast., 18, 371–383, 2003.
SIMAT:www.sma.df.gob.mx/simat/consultas.htm, last access: 23 June 2008.
Slini, T., Karatzas, K., and Moussiopoulos, N.: Statistical analysis of environmental data as the basis of forecasting: an air quality application, Sci. Total Environ., 288, 227–237, 2002.
20
Soja, G. and Soja, A. M.: Ozone indices based on simple meteorological parameters: potentials and limitations of regression and neural network models, Atmos. Environ., 33, 4299–4307, 1999.
Sousa, S. I., Martins, F. G., Pereira, M. C., and Alvim-Ferraz M. C.: Prediction of ozone concen-trations in Oporto City with statistical approaches, Chemosphere, 64(7), 1141–1149, 2006.
25
Stohl, A., Wotawa, G., and Kromp-Kolb, H.: The IMPO modelling system description, sensitivity studies and applications, Universit´’at fur Bodenkultur, Institut fur Meteorologie und Physik, Vienna, Austria, Technical report, 1996.
Wang, D. and Lu, W. Z.: Interval estimation of urban ozone level and selection of influential factors by employing automatic relevance determination model, Chemosphere, 62, 1600–
30
1611, 2006.
As-ACPD
8, 12343–12370, 2008Ozone prediction by means of a fuzzy reasoning approach
A. Nebot et al.
Title Page
Abstract Introduction
Conclusions References
Tables Figures
◭ ◮
◭ ◮
Back Close
Full Screen / Esc
Printer-friendly Version
Interactive Discussion
sess., 12, 313–327, 2006.
Wang, W., Lu, W., Wang, X., and Leung, A. Y. T.: Prediction of maximum daily ozone level using combined neural network ans statistical characteristics, Environ. Int., 29, 555–562, 2003. Wieland, D. and Wotawa, W.: Local maximum ozone concentration prediction using neural
net-works, in: Proceedings of the AAAI Workshop on Environmental Decision Support Systems
5
and Artificial Intelligence, Orlando, Florida, USA, 18–19 July 1999, 47–54, 1999.
Wotawa, F. and Wotawa, G.: From neural networks to qualitative knowledge in ozone forecast-ing, AI Commun., 14, 23–33, 2001.
Yildirim, Y. and Bayramoglu, M.: Adaptive neuro-fuzzy based modelling for prediction of air pollution daily levels in city of Zonguldak, Chemosphere, 63, 1575–1582, 2006.
ACPD
8, 12343–12370, 2008Ozone prediction by means of a fuzzy reasoning approach
A. Nebot et al.
Title Page
Abstract Introduction
Conclusions References
Tables Figures
◭ ◮
◭ ◮
Back Close
Full Screen / Esc
Printer-friendly Version
Interactive Discussion Table 1.Input variables used in the ozone forecast models.
ACPD
8, 12343–12370, 2008Ozone prediction by means of a fuzzy reasoning approach
A. Nebot et al.
Title Page
Abstract Introduction
Conclusions References
Tables Figures
◭ ◮
◭ ◮
Back Close
Full Screen / Esc
Printer-friendly Version
Interactive Discussion Table 2.Interval values (landmarks) associated to each class for input and output variables.
HD RH TM WD WS O3
Class 1 1...12 6...64 5...16.7 0...124 0.01...1.4 0.0...0.05 Class 2 12...17 64...93 16.7...31 124...360 1.4...8.3 0.05...0.1
ACPD
8, 12343–12370, 2008Ozone prediction by means of a fuzzy reasoning approach
A. Nebot et al.
Title Page
Abstract Introduction
Conclusions References
Tables Figures
◭ ◮
◭ ◮
Back Close
Full Screen / Esc
Printer-friendly Version
Interactive Discussion Table 3.FIR model structure (relevant variables) and statistical indices obtained for the March
Monthly Model.
ACPD
8, 12343–12370, 2008Ozone prediction by means of a fuzzy reasoning approach
A. Nebot et al.
Title Page
Abstract Introduction
Conclusions References
Tables Figures
◭ ◮
◭ ◮
Back Close
Full Screen / Esc
Printer-friendly Version
Interactive Discussion Table 4. FIR model structure (relevant variables) and statistical indices obtained for the Dry
Seasonal Models.
ACPD
8, 12343–12370, 2008Ozone prediction by means of a fuzzy reasoning approach
A. Nebot et al.
Title Page
Abstract Introduction
Conclusions References
Tables Figures
◭ ◮
◭ ◮
Back Close
Full Screen / Esc
Printer-friendly Version
Interactive Discussion Table 5.Number of March days that fall in each error deviation percentage. The error deviation
percentage is computed from the difference between the maximum ozone value predicted per day and the maximum ozone value observed for the same day, when the FIR monthly and seasonal models of 6 relevant variables are used.
Deviation percentage <10% >10% and<15% >15% and<20% >20% and<30% >30%
Monthly Model (RMSE=0.0137) 7 6 6 7 4
ACPD
8, 12343–12370, 2008Ozone prediction by means of a fuzzy reasoning approach
A. Nebot et al.
Title Page
Abstract Introduction
Conclusions References
Tables Figures
◭ ◮
◭ ◮
Back Close
Full Screen / Esc
Printer-friendly Version
Interactive Discussion Table 6.Test RMSE obtained for days: 8, 11 and 30 using the three model structures from the
monthly and seasonal models approaches.
Model Structure 8 March RMSEtest 11 March RMSEtest 30 March RMSEtest
WD(t−δt), O3(t−δt), HD(t), WD(t),WS(t) 0.0162 0.012 0.009
WD(t−δt), O3(t−δt), HD(t), WD(t) 0.0136 0.008 0.013
ACPD
8, 12343–12370, 2008Ozone prediction by means of a fuzzy reasoning approach
A. Nebot et al.
Title Page
Abstract Introduction
Conclusions References
Tables Figures
◭ ◮
◭ ◮
Back Close
Full Screen / Esc
Printer-friendly Version
Interactive Discussion Fig. 1. Real vs. predicted signals for March 2006 test data set using model (WD(t−δt),
ACPD
8, 12343–12370, 2008Ozone prediction by means of a fuzzy reasoning approach
A. Nebot et al.
Title Page
Abstract Introduction
Conclusions References
Tables Figures
◭ ◮
◭ ◮
Back Close
Full Screen / Esc
Printer-friendly Version
Interactive Discussion Fig. 2. Real vs. predicted signals for March 2006 test data set using model (WD(t−δt),
ACPD
8, 12343–12370, 2008Ozone prediction by means of a fuzzy reasoning approach
A. Nebot et al.
Title Page
Abstract Introduction
Conclusions References
Tables Figures
◭ ◮
◭ ◮
Back Close
Full Screen / Esc
Printer-friendly Version
Interactive Discussion Fig. 3. Real vs. predicted signals for 8 March 2006 test data set using model (WD(t−δt),
ACPD
8, 12343–12370, 2008Ozone prediction by means of a fuzzy reasoning approach
A. Nebot et al.
Title Page
Abstract Introduction
Conclusions References
Tables Figures
◭ ◮
◭ ◮
Back Close
Full Screen / Esc
Printer-friendly Version
Interactive Discussion δ δ
ACPD
8, 12343–12370, 2008Ozone prediction by means of a fuzzy reasoning approach
A. Nebot et al.
Title Page
Abstract Introduction
Conclusions References
Tables Figures
◭ ◮
◭ ◮
Back Close
Full Screen / Esc
Printer-friendly Version
Interactive Discussion Fig. 5. Real vs. predicted signals for 30 March 2006 test data set using model (WD(t−δt),
ACPD
8, 12343–12370, 2008Ozone prediction by means of a fuzzy reasoning approach
A. Nebot et al.
Title Page
Abstract Introduction
Conclusions References
Tables Figures
◭ ◮
◭ ◮
Back Close
Full Screen / Esc
Printer-friendly Version
Interactive Discussion δ δ