www.atmos-chem-phys.net/13/11351/2013/ doi:10.5194/acp-13-11351-2013
© Author(s) 2013. CC Attribution 3.0 License.
Atmospheric
Chemistry
and Physics
Dry deposition of nitrogen compounds (NO
2
, HNO
3
, NH
3
),
sulfur dioxide and ozone in west and central African
ecosystems using the inferential method
M. Adon1,2, C. Galy-Lacaux1, C. Delon1, V. Yoboue2, F. Solmon1,3, and A. T. Kaptue Tchuente4
1Laboratoire d’Aérologie, UMR5560, CNRS/UPS, Toulouse, France
2Laboratoire de Physique de l’Atmosphère, Université Félix Houphouët-Boigny de Cocody, Abidjan, Côte d’Ivoire 3International Centre for Theoretical Physics, Trieste, Italy
4Geographic Information Science Center of Excellence, South Dakota State University, Brookings, USA
Correspondence to:M. Adon ([email protected]) and C. Galy-Lacaux ([email protected]) Received: 12 March 2013 – Published in Atmos. Chem. Phys. Discuss.: 2 May 2013
Revised: 1 October 2013 – Accepted: 12 October 2013 – Published: 22 November 2013
Abstract. This work is part of the IDAF program
(IGAC-DEBITS-AFRICA) and is based on the long-term monitoring of gas concentrations (1998–2007) established at seven re-mote sites representative of major African ecosystems. Dry deposition fluxes were estimated by the inferential method using on the one hand surface measurements of gas con-centrations (NO2, HNO3, NH3, SO2 and O3) and on the other hand modeled exchange rates. Dry deposition veloci-ties (Vd) were calculated using the big-leaf model of Zhang et al. (2003b). The bidirectional approach is used for NH3 surface–atmosphere exchange (Zhang et al., 2010). Surface and meteorological conditions specific to IDAF sites have been used in the models of deposition. The seasonal and an-nual mean variations of gaseous dry deposition fluxes (NO2, HNO3, NH3, O3and SO2) are analyzed.
Along the latitudinal transect of ecosystems, the an-nual mean dry deposition fluxes of nitrogen compounds range from −0.4 to −0.8 kg N ha−1yr−1 for NO2, from −0.7 to −1.0 kg N ha−1yr−1 for HNO3 and from −0.7
to −8.3 kg N ha−1yr−1 for NH3 over the study
pe-riod (1998–2007). The total nitrogen dry deposition flux (NO2+HNO3+NH3) is more important in forests (−10 kg N ha−1yr−1) than in wet and dry savannas (−1.6 to −3.9 kg N ha−1yr−1). The annual mean dry deposition fluxes of ozone range between−11 and −19 kg ha−1yr−1 in dry and wet savannas, and −11 and −13 kg ha−1yr−1 in forests. Lowest O3 dry deposition fluxes in forests are correlated to low measured O3 concentrations, lower by a
factor of 2–3, compared to other ecosystems. Along the ecosystem transect, the annual mean of SO2dry deposition fluxes presents low values and a small variability (−0.5 to −1 kg S ha−1yr−1). No specific trend in the interannual
vari-ability of these gaseous dry deposition fluxes is observed over the study period.
1 Introduction
Sulfur dioxide (SO2)is one of the important species consid-ering the acid deposition issues, and it is also the precursor of sulfate. Dry deposition estimation of SO2is essential to as-sess ecological impact research, crop growing and air qual-ity research (Tsai et al., 2010). Tropospheric ozone (O3)is known to harm human health, damage vegetation and lead to deterioration of materials. The dry deposition of O3is one of the most important sinks in the boundary layer ozone budget (Rummel et al., 2007).
Monitoring networks have been established around the world to measure wet and dry deposition. The interna-tional program DEBITS (Deposition of Biogeochemically Important Trace Species) was initiated in 1990 as part of IGAC/IGBP (International Global Atmospheric Chem-istry/International Geosphere-Biosphere Programme) “core project” in order to study wet and dry atmospheric deposition in tropical regions (Lacaux et al., 2003). The DEBITS net-work collects data from 25 stations that are distributed within the tropical belt in Africa, Asia and South America, and re-sults are presented in the new IGAC structure or DEBITS II (Pienaar et al., 2005; Bates et al., 2006; http://debits.sedoo. fr). For tropical Africa, the IDAF (IGAC/DEBITS/AFRICA) project started in 1994 and was implemented in partnership with INSU (Institut National des Sciences de l’Univers, in France) and the CNRS (Centre National de la Recherche Sci-entifique, in France) as part of the Environmental Research Observatory (ORE, in France) networks.
The main objectives of IDAF are to measure wet and dry deposition fluxes and to identify the relative contribu-tion of natural and anthropogenic sources, as well as the factors regulating these fluxes. IDAF activity is based on high-quality measurements of atmospheric chemical data (gaseous, precipitation and aerosol chemical compositions) on the basis of multiyear monitoring (http://idaf.sedoo.fr). Within the framework of IDAF, several studies of precipi-tation chemical composition representative of great African ecosystems have been recently published (Galy-Lacaux and Modi, 1998; Galy-Lacaux et al., 2001, 2009; Al-Ourabi and Lacaux, 2002; Lacaux et al., 1993, 2003; Sigha et al., 2003; Yoboue et al., 2005; Mphepya et al., 2004; 2006; Laouali et al., 2012).
To complement these studies, it is appropriate to study and quantify dry deposition fluxes. Direct methods (eddy correlation, chamber method) and indirect methods (infer-ential method, gradient method) are available to determine dry deposition fluxes (Seinfeld and Pandis, 2006). The DEB-ITS committee in charge of deposition studies in IGAC has decided to use indirect dry deposition fluxes determination in tropical sites because of difficulties in operating sophis-ticated direct methods of flux measurements in remote sites (Wolff et al., 2010; Sutton et al., 2007). In this study, dry deposition fluxes are estimated using the inferential method, which is a combination of gaseous concentration measure-ments and modeling of deposition velocities according to the resistance analogy (Wesely, 1989; Zhang et al., 2003b;
and references therein). Bidirectional exchange of NH3and NO2 have been frequently observed over different canopies (Dorsey et al., 2004; Trebs et al., 2006; Walker et al., 2006; Wichink Kruit et al., 2007). There has been some effort in the development of bidirectional exchange models (e.g., Sutton et al., 1998; Flechard et al., 1999; Trebs et al., 2006; Massad et al., 2010; Zhang et al., 2010, Wichink Kruit et al., 2012; Bash et al., 2013; Hamaoui-Laguel et al., 2012); however, the application of these models remains difficult over the dif-ferent canopies of African ecosystems owing to the lack of necessary input parameters. Nevertheless, the two-layer bidi-rectional model of Zhang et al. (2010) is applied in this study to estimate NH3surface–atmosphere exchange fluxes.
In a recent paper, Adon et al. (2010) presented the long-term monitoring of ambient gaseous concentrations within the IDAF program. Our study presented an original database of 10 yr of measurements (1998–2007) of five important atmospheric gases (NO2, HNO3, NH3, O3, SO2) obtained within the IDAF African network at seven sites in west and central Africa.
In the present paper, realistic dry deposition velocities ac-cording to the sites and the species involved are calculated in order to estimate dry deposition fluxes. The big-leaf model of Zhang et al. (2003b) is used to simulate dry deposition veloc-ities representative of major African ecosystems. The results are compared to previous estimates from the literature. For NH3net fluxes, the bidirectional model of Zhang et al. (2010) is used. Then, we present an estimate on a long-term basis (10 yr) of dry deposition fluxes of gases (NO2, HNO3, NH3, O3and SO2)at the scale of major African ecosystems. The monthly, seasonal and annual mean variations of gaseous dry deposition fluxes are analyzed.
2 Sites description and methodology
2.1 Presentation of measurement sites
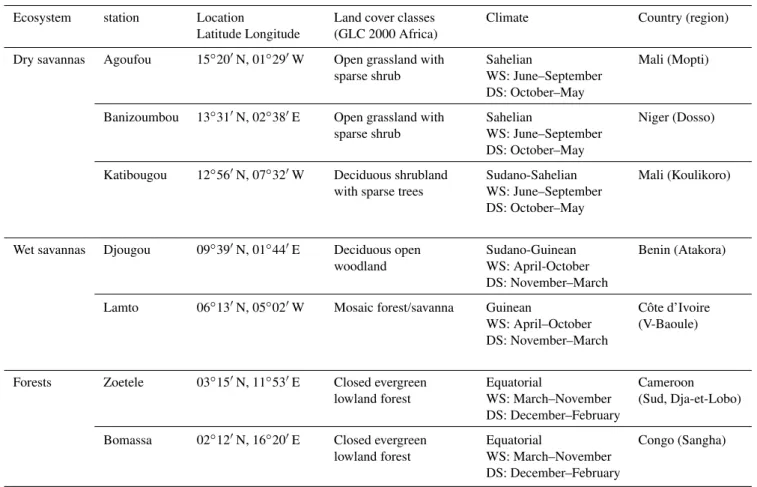
Figure 1 presents the location of the seven IDAF mea-surement stations displayed on the map of African biomes adapted from the land cover product of Mayaux et al. (2004). The IDAF sites of west and central Africa are located to rep-resent a transect of ecosystems, i.e., dry savannas (Agoufou, Banizoumbou, Katibougou), wet savannas (Djougou, Lamto) and equatorial forests (Zoetele, Bomassa). The geographical, ecological and climatic characteristics of the study sites are presented in Table 1. Dry savannas are characterized by a long dry season from October to May and a short wet sea-son from June to September. The mean wet seasea-son extends from April to October in wet savannas and from March to November in forests; other months are the dry season. A de-tailed description of IDAF monitoring stations can be found in Adon et al. (2010).
Table 1.Geographic, ecologic and climatic characteristics of the western and central Africa IDAF sites. WS: wet season; DS: dry season.
Ecosystem station Location
Latitude Longitude
Land cover classes (GLC 2000 Africa)
Climate Country (region)
Dry savannas Agoufou 15◦20′N, 01◦29′W Open grassland with sparse shrub
Sahelian
WS: June–September DS: October–May
Mali (Mopti)
Banizoumbou 13◦31′N, 02◦38′E Open grassland with sparse shrub
Sahelian
WS: June–September DS: October–May
Niger (Dosso)
Katibougou 12◦56′N, 07◦32′W Deciduous shrubland with sparse trees
Sudano-Sahelian WS: June–September DS: October–May
Mali (Koulikoro)
Wet savannas Djougou 09◦39′N, 01◦44′E Deciduous open woodland
Sudano-Guinean WS: April-October DS: November–March
Benin (Atakora)
Lamto 06◦13′N, 05◦02′W Mosaic forest/savanna Guinean
WS: April–October DS: November–March
Côte d’Ivoire (V-Baoule)
Forests Zoetele 03◦15′N, 11◦53′E Closed evergreen lowland forest
Equatorial
WS: March–November DS: December–February
Cameroon (Sud, Dja-et-Lobo)
Bomassa 02◦12′N, 16◦20′E Closed evergreen lowland forest
Equatorial
WS: March–November DS: December–February
Congo (Sangha)
have been monitored since 1998, while measurement of O3 started in 2001 and that of SO2 in 2002. As part of the Long-term Observation Period of the AMMA (African Mon-soon Multidisciplinary Analysis) program, the Djougou and Agoufou sites started operating in 2005. All measurements are still continuing at all the IDAF sites.
2.2 Dry deposition estimate
The inferential method, which combines measured air con-centrations and modeled exchange rates, was employed in this study to estimate the dry deposition fluxes of different gaseous species. The inferential technique has been widely used in other studies for different types of ecosystems (Shen et al., 2009; Pineda and Venegas, 2009; Jin et al., 2006; Zhang et al., 2005, 2009; Delon et al., 2010, 2012; and Pan et al., 2012). This approach is more suited when routine moni-toring data are available but the values of the derived fluxes are clearly dependent on the validity of the dry deposition velocity calculation.
2.2.1 Atmospheric concentration measurements
Atmospheric concentrations of NO2, HNO3, NH3, O3 and SO2 are measured by passive samplers on a monthly
ba-Fig. 1.Vegetation and location map of the seven measurement sta-tions of the IDAF network. Only the seven IDAF stasta-tions of west and central Africa included in the present study are represented.
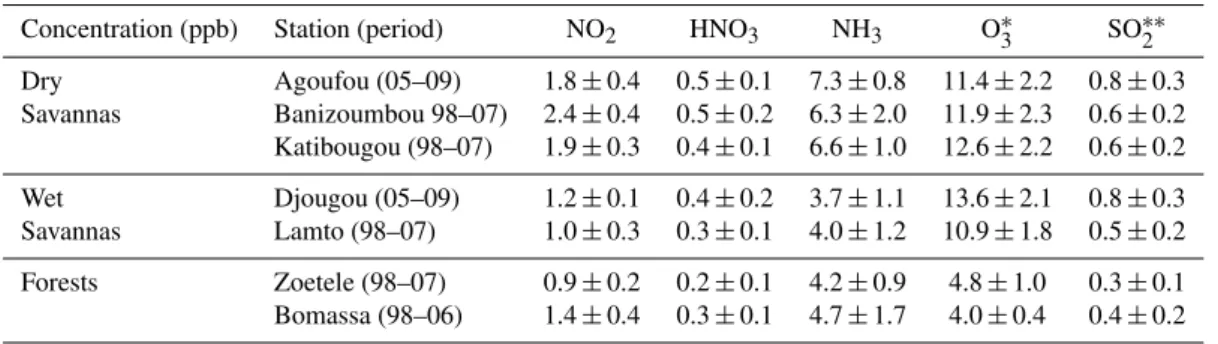
Table 2.Mean annual concentrations (in ppb) at IDAF sites over the study period (1998–2007) (adapted from Adon et al., 2010).
Concentration (ppb) Station (period) NO2 HNO3 NH3 O∗3 SO∗∗2
Dry Agoufou (05–09) 1.8±0.4 0.5±0.1 7.3±0.8 11.4±2.2 0.8±0.3 Savannas Banizoumbou 98–07) 2.4±0.4 0.5±0.2 6.3±2.0 11.9±2.3 0.6±0.2 Katibougou (98–07) 1.9±0.3 0.4±0.1 6.6±1.0 12.6±2.2 0.6±0.2 Wet Djougou (05–09) 1.2±0.1 0.4±0.2 3.7±1.1 13.6±2.1 0.8±0.3 Savannas Lamto (98–07) 1.0±0.3 0.3±0.1 4.0±1.2 10.9±1.8 0.5±0.2 Forests Zoetele (98–07) 0.9±0.2 0.2±0.1 4.2±0.9 4.8±1.0 0.3±0.1 Bomassa (98–06) 1.4±0.4 0.3±0.1 4.7±1.7 4.0±0.4 0.4±0.2
∗O
3starts monitoring in 2001 and∗∗SO2in 2002.
Table 3.Adaptation of land-use categories (LUC) used in the big-leaf model to IDAF sites for the calculation of canopy resistances (Rac,
Rcut,Rst)inVdand range of LAI andZ0(roughness length).
Sites
(type of ecosystem)
Land-use cover (LUC) (resistances)
Min.–max. LAI (m2m−2)
Z0(m)
Agoufou, Banizoumbou (grassland)
Short grass and forbs (Rac,Rcut,Rst,R∗g)a
0.2–1 0.02–0.06
Katibougou (shrubland)
Long grass (Rac, Rcut, Rg∗)a
and broadleaf shrubs with perennial ground cover (Rst)b
0.5–2 0.13–0.16
Djougou, Lamto (tree savanna)
Long grass (Rac, Rcut, Rg)a
and
broadleaf trees with ground cover or savanna (Rst)b
0.5–2 (Djougou) 2–4 (Lamto)
0.13–0.2
Zoetele, Bomassa (forest)
Tropical broadleaf trees (Rac,Rcut,Rst,Rg)a
4–6 (mean 5) 2.5a
aZhang et al. (2003b),bBrook et al. (1999)
∗R
g=400s m−1for Agoufou and Banizoumbou andRg=300s m−1for Katibougou; for the other sites, values suggested by Zhang et al. (2003b) were used.
the validation method according to international standards, have been widely detailed in Adon et al. (2010). To give an indication of the precision of this sampling technique, the covariance of all duplicate samples over the studied period were found to be 20, 9.8, 14.3, 16.6 and 10 % for HNO3, NO2, NH3, SO2and O3, respectively. Furthermore, Adon et al. (2010) presented the evolution of NO2, HNO3, NH3, O3 and SO2concentrations along the period 1998–2007 for each station. Table 2 presents a synthesis of the mean annual gas concentrations for the IDAF sites of west and central Africa (Adon et al., 2010).
2.2.2 Modeling of the dry deposition velocity for each IDAF site
Dry deposition velocities (Vd) were calculated using the big-leaf dry deposition model of Zhang et al. (2003b). The main parameterizations of the resistances in the model are briefly presented in Appendix A. The main input param-eters of this updated deposition model are physiological
(parameters of land-use categories), biophysical (LAI) and meteorological data.
the stomatal resistance, we used the savanna parameters de-scribed in Brook et al. (1999). These parameters arersmin (minimal stomatal resistance),brs (empirical light response coefficient),bvpd (water-vapor-pressure-deficit constant),9 (leaf water potential), Tmin, Tmax and Topt (minimum and maximum temperatures at which stomatal closure occurs and optimum temperature for maximum stomatal opening).
For the soil resistance (Rg), values suggested by Zhang et al. (2003b) were used for IDAF sites excepted in the Sahe-lian domain. Considering the semiarid climate of the Sahel, close to the Sahara (desert) and the steppe vegetation, we as-sumed some values based on published measurement in the literature (Wesely et al., 1989; Brook et al., 1999; Ganzeveld and Lelieved, 1995) (Table 3).
Roughness length (Z0)is needed for calculating friction velocity, which subsequently affects aerodynamic, quasi-laminar and non-stomatal resistances (Zhang et al., 2003b). We have usedZ0 values already simulated at the savanna sites in the framework of a previous study performed with the SVAT (Soil Vegetation Atmosphere Transfer) model ISBA (Interactions between Soil, Biosphere and Atmosphere – Noilhan and Mahfouf, 1996; Noilhan et al., 1989) and ex-plained in Delon et al. (2010) (Table 3).
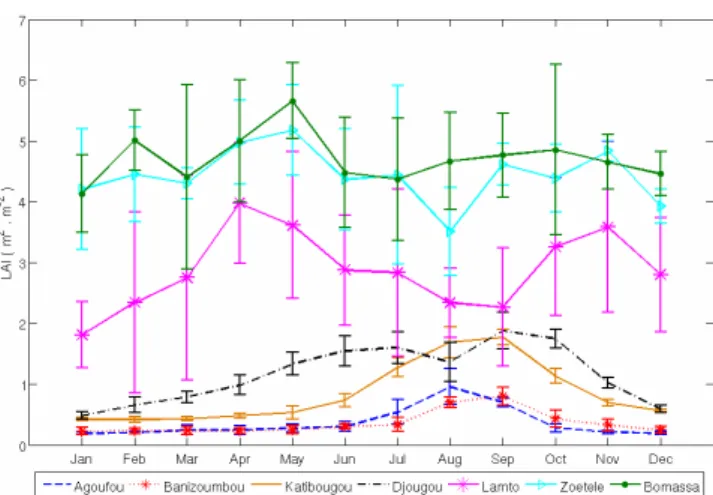
LAIis an important parameter for calculating canopy resis-tances. For the IDAF sites, LAI was obtained from MODIS (MODerate Resolution Imaging Spectroradiometer) satellite data for the period 2000–2007. The MODIS LAI is the ra-tio of one-sided green foliage area per unit horizontal ground area in broadleaf canopies, or the projected needleleaf area per unit ground area in conifer canopies, and is given in m2m−2 (Myneni, 1999). To that end, we used the 1 km MODIS LAI values that are processed over an 8-day period (Yang et al., 2006). The MODIS LAI product has already been validated with field measurements on many sites over the western African region (Fensholt et al., 2004; Samain et al., 2008). The mean seasonal variations of the monthly LAI during the period 2000–2007 for IDAF sites are shown in Fig. 2 and the range values are displayed in Table 3. The MODIS LAI of IDAF specific sites are well compa-rable to the ones of the corresponding land covers of the ECOCLIMAP database (Kaptue et al., 2010). For our sim-ulation of dry deposition velocity, we used the monthly LAI averaged over 8 yr (2000–2007) for savanna sites and a con-stant value of 5 m2m−2for tropical forest sites. We note that Zhang et al. (2003b) and Brook et al. (1999) have used a con-stant LAI of 6 and 4.5 m2m−2, respectively, to simulate dry deposition velocity for tropical forests.
Meteorological datarequired for the simulation are wind speed and temperature at a reference height in the surface layer, surface temperature, solar irradiance at the surface, precipitation, surface pressure, relative humidity and cloud cover fraction. With the exception of cloud cover fraction, meteorological conditions are provided by the forcing devel-oped in the frame of ALMIP (AMMA Land Surface Model Intercomparison Project) from satellite data, described in
38 Fig. 2.Monthly variation of MODIS LAI averaged over the period 2000–2007 for IDAF sites. Vertical bars depict the standard devia-tion over the study period.
Boone et al. (2009). The spatial resolution of this forcing is 0.5◦×0.5◦with a 3 h temporal resolution. For the simulation
of dry deposition velocity, we used a database of 6 yr from 2002 to 2007. Validations of surface temperature and mois-ture have been performed within the ALMIP project (Boone et al., 2009; De Rosnay et al., 2009). However, the forcing in ALMIP is available at 10 m, whereas the concentrations of gases are measured at around 2 m for the savanna sites and 3 m for the forested ecosystems within IDAF network. As a first approximation, a logarithmic decrease of the wind forc-ing from 10 to 2 m, dependforc-ing on the rugosity of the site, has been applied to calculate deposition velocities at 2 m for the savanna sites, as described in Delon et al. (2010, 2012). This approach to reduce the wind from 10 m to the height of 2 m is based on the constant flux assumption (Baldocchi, 1988; Zhang et al., 2009). However for the forested ecosystems, the constant flux assumption cannot be applied below the canopy due to extra sink terms; hence another approximation is done and described below in Sect. 2.2.4.
of monthlyVdis negligible when it is assumed that dew has occurred; for example the RMSE (root-mean-squared error) ofVd(SO2)is 2, 1 and 4 % for dry savanna, wet savanna and forest, respectively (Adon, 2011). Therefore, in this study, we do not take into account the assumption of the occurrence of dew.
Previous studies of nitrogen budget in wet and dry savanna ecosystems have proposed an estimate of N compounds de-position velocities (Delon et al., 2010, 2012). In those stud-ies,Vd were calculated according to the Wesely (1989) re-sistance analogy in the SVAT big-leaf model ISBA, with modifications of the cuticle and ground resistances adapted from Zhang et al. (2003b). The results were obtained at the regional scale at 0.5◦ resolution for the period 2002– 2007, and focused on the reactive nitrogen compounds bud-get (with estimates of emission and deposition (dry+wet) fluxes). The present study is focused on dry deposition only, and integrates all the parameterizations developed by Zhang et al. (2003b), which gives a different but consistent and co-herent estimate ofVdat the local scale, and for more species (same N compounds+O3and SO2). Indeed, we investigate
each specific vegetal cover representative of each IDAF mea-surement sites in this study. Differences between the two ap-proaches are mainly due to the different resolutions of mod-els and to the degree of details involved in the estimation of input parameters such as the ones detailed in the above para-graph. The previous studies of Delon et al. (2010, 2012) give a point of comparison for N compounds’Vdcalculated in the present work, as very few studies are available for African ecosystems. Furthermore, as explicated below, the NH3 bidi-rectional exchange is applied in the present study, which was not the case in the previous studies of Delon et al. (2010, 2012).
We present in this paper the calculation, over the period 2002–2007, of monthly means (from 3-hourly values) depo-sition velocities for O3, SO2, NO2, HNO3 and NH3 for the IDAF sites.
2.2.3 NH3bidirectional exchange and canopy
compensation point
The NH3net fluxes were calculated using the bidirectional air–surface exchange model of Zhang et al. (2010), which is a modification from the original big-leaf model of Zhang et al. (2003b). The main parameterization of this new bidi-rectional exchange model and the method of calculation of the NH3net fluxes in this study are briefly presented in Ap-pendix B.
In this modified model, the main input parameters are stomatal (Ŵst)and ground (Ŵg)emission potentials, leading to stomatal and soil compensation points, respectively, and thus the canopy compensation point (Xcp)(Eq. B3). For each of the LUCs, Zhang et al. (2010) derived representative input values based on literature data.
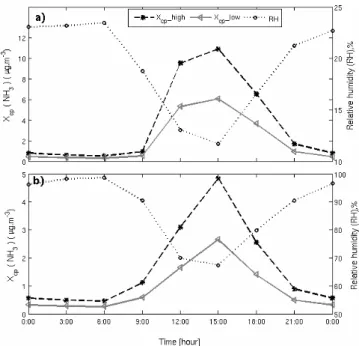
Fig. 3.Mean diurnal variation of the simulated lower (low flux) and upper (high flux) NH3canopy compensation pointXcp(NH3)
asso-ciated with the variation of the relative humidity (RH) at a Sahelian site ((a)Banizoumbou) and a Guinean savanna site ((b)Lamto) in the dry season (January, 2006).
In our simulation and for the seminatural forested ecosys-tem, we used the median values of Ŵst (300) andŴg (20) suggested for tropical forest LUC. The daytime canopy com-pensation point values of NH3 were less than 2 µg m−3, as predicted by Zhang et al. (2010).
For the savannas sites, a sensitivity test showed that the median values suggested for the long grass or short grass and forbs LUC, considered as fertilized, (Ŵg=2000) would give too high daytime values ofXcp(50–300 µg m−3at Ban-izoumbou) in the dry season due to very high ground sur-face temperatures in the afternoon (38–50◦C). However, the African savannas remain either slightly or not fertilized (Bouwman and van der Hoek, 1997; Mosier et al., 1998). Delon et al. (2010) estimated the mean total nitrogen in-put from animal manure for the Sahelian sites from 11 to 23 kg N ha−1yr−1, lower when compared to fertilized veg-etation input in temperate ecosystems (Loubet et al., 2002; Massad et al., 2010). Due to the lack of data for typical trop-ical savanna sites, we chose a range of lower-end values re-ported for grass or unfertilized ecosystems in the literature. Thus, we have chosen values of 100 (low scenario) and 200 (high scenario) forŴst(Spindler et al., 2001; Horvath et al., 2005; Trebs et al., 2006; Personne et al., 2009) and values of 200 (low scenario) and 360 (high scenario) forŴg(Massad et al., 2010; Zhang et al., 2010).
simulation, the maximum ground surface temperature was fixed at 40◦C to avoid too high values ofX
cpfor the “high scenario” in dry savannas. Although low values ofŴst and Ŵgwere used to run the model, the estimatedXcp(NH3) val-ues are within a reasonable range of valval-ues determined for grassland in other studies (Langford et al., 1992; Hesterberg et al., 1996; Spindler et al., 2001; Loubet et al., 2002; Trebs et al., 2006; Zhang et al., 2010). This is due to high surface temperatures mainly at Sahelian sites. Note that theXcp diur-nal values of the Sudano-Guinean site of Djougou are com-parable to those of Sahelian sites (result not shown). Dur-ing the wet season, theXcpdiurnal values are lower due to lower surface temperatures: 0.1–1 µg m−3 during nighttime and 0.3–5 µg m−3during daytime for the savanna sites.
For the NH3net fluxes, we used the two scenarios (lower and upper estimates) presented above compared to the “dry deposition only” scenario (Xcp=0).
2.2.4 Corrections for within-canopy concentration data
for forests
The inferential method requires atmospheric concentrations and turbulence intensity above the canopy to predict rates of dry deposition over the forest. In the IDAF network, gas con-centrations are measured at about 3 m in forests. Moreover, there are very few published within-canopy vertical gas con-centration profiles (HNO3, NH3)in the literature for forest (Flechard et al., 2011). Thus, we have carried out a pilot ex-periment by measuring simultaneously gas concentrations at 10 and 3 m (or 2 m) from the ground in the forested ecosys-tem of Zoetele (and in the wet savanna of Lamto and dry sa-vanna of Banizoumbou) over the period of September 2010 to December 2011.
For the forested ecosystem, NO2, HNO3and SO2monthly concentrations measured simultaneously at 10 and 3 m show no significant trend and are on the same order. Over this pe-riod, mean annual concentrations – at 3 and 10 m, respec-tively – are 0.81 and 0.80 ppb for NO2, 0.2 and 0.3 ppb for HNO3, and 1.8 and 1.6 ppb for SO2. However for NH3and O3, monthly concentrations measured at 10 m are higher and the mean ratio was 1.5 for NH3 and 1.3 for O3 (mean an-nual concentration are 3.6 and 6.1 ppb for NH3and 5.4 and 7.0 ppb for O3 at 3 and 10 m, respectively). This observa-tion is consistent with the approximaobserva-tion made in Flechard et al. (2011) showing that NH3concentrations measured in clearings and below canopy are consistently smaller than above treetops; they thus applied a constant correction factor of 1.3 for NH3concentrations measured below trees. We note that in the dry savanna of Banizoumbou, NH3concentrations measured at 2 m (annual mean 8.1 ppb) are higher than at 10 m (6.3 ppb), indicative of NH3sources in the ground and in the leaf litter in grasslands (Nemitz et al., 2009). For O3, our observations are consistent with ozone vertical profile concentrations that decrease towards the ground, as observed by Krzyzanowski (2004) by measuring ozone concentrations
at different heights in a forest canopy. Contrary to our ob-servation for HNO3and SO2, Hicks (2006) observed a ratio of 1.34 and 1.26, respectively, between concentrations mea-sured above the treetops and within the canopy of forests.
In a first approximation, for forested sites of IDAF (Zoetele and Bomassa), we thus applied a constant correction factor of 1.5 for NH3and 1.3 for O3concentrations measured at 3 m in order to calculate the dry deposition flux at 10 m. For the other gases (NO2, HNO3 and SO2) no correction was applied. The dry deposition fluxes of HNO3and SO2 us-ing the forest-clearus-ing concentrations may be underestimated as discussed by Hicks (2006). In addition, the mean covari-ance of samplers exposed simultaneously at 3 and 10 m were found to be 13, 25.5 and 21 % for NO2, HNO3and SO2 spectively, and these values are comparable of the mean re-producibility of IDAF passive samplers calculated from 1998 to 2007 (9.8, 20 and 16.6 % for NO2, HNO3and SO2, respec-tively). Thus, the small difference in measured concentra-tions between the two heights (3 and 10 m) for NO2, HNO3 and SO2could be included in the global uncertainty for the passive sampler method.
2.3 Uncertainties in dry deposition fluxes estimates
Uncertainties in the estimated dry deposition fluxes result from combined uncertainties in measured gaseous concen-trations and in modeled exchange rates. In this section, rather than quantifying the total uncertainty of the inferential method in the study, we focus on addressing the uncertainties for each contribution of the dry deposition estimates. Part of uncertainties linked to the measurement of gas concentration using IDAF passive samplers have been given by the covari-ance of duplicates (reproducibility), between 10 and 20 % ac-cording to the species (Adon et al., 2010). Other parts are related to the measurement techniques of passive samplers. One of the uncertainties of the dry deposition velocities is re-lated to the wind forcing. The difference between the wind in the forcing and the wind measured in situ is between 5 and 35 % depending on the site. A mean rate of 20 to 30 % de-pending on the site is applied for the wind speed uncertainty, leading to an uncertainty rate for the dry deposition veloc-ity between 10 and 20 % for all sites. Others uncertainties are related to the representation of the soil type in the model indirectly dependent on the roughness length and the soil re-sistances (Zhang et al., 2003b) as well as the choice of plant physical parameters.
In this study, concentrations are measured with passive samplers and are monthly integrated. Dry deposition veloc-ities are simulated 3-hourly and then monthly averaged. As we use monthly means for concentrations and deposition ve-locities, the covariance between the two may induce an addi-tional uncertainty (the missing covariance term), especially for species having strong diurnal variations, in the range of
Fig. 4.Monthly variation of dry deposition velocity (Vd)of NO2, NH3, HNO3, O3and SO2averaged over the period 2002–2007 for IDAF
sites. Vertical bars depict standard deviation over the study period.
For the NH3bidirectional exchange, in addition of the un-certainties related to the model itself (Zhang et al., 2010), the ground emission potential remains the most uncertain in our simulations due to the lack of detailed investiga-tions although flux measurements have often shown signif-icant emission from soils and leaf litter (Sutton et al., 2013; Flechard et al., 2010). The unidirectional approach (Zhang et al., 2003b) used for the other gases could induce other sources of uncertainty.
Additional uncertainties are associated with different pa-rameterizations of dry deposition used in deposition mod-els. The physical, biological and chemical exchange mech-anisms involved in deposition processes are too complex to be explicitly and completely modeled, and as such param-eterizations tend to be empirical in the models (Flechard et al., 2011; Schwede et al., 2011). Moreover, multiple species model intercomparison show factor of 2–5 differences in exchange rates between models depending on the chemical species (Flechard et al., 2011).
3 Results and discussion
3.1 Dry deposition velocities
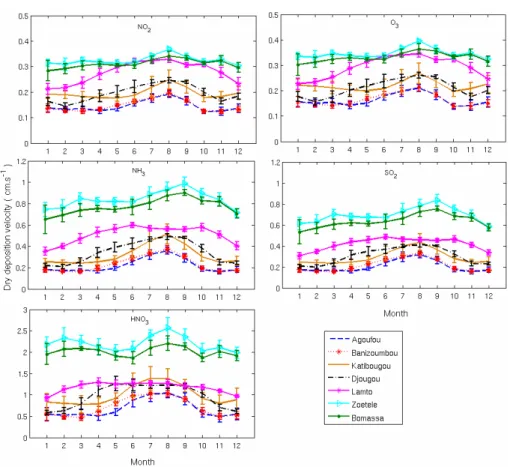
Monthly means (from 3-hourly values) of deposition veloci-ties for O3, SO2, NO2, HNO3and NH3have been calculated for the period 2002–2007 in order to reproduce the seasonal cycle of the deposition processes at each site (Fig. 4). We note a fairly clear distinction between the different ecosys-tems and climatic domains. The monthlyVdvalues of each gas increase from the semiarid savannas (Agoufou, Bani-zoumbou) to the equatorial forested ecosystems (Zoetele, Bomassa) indicating that the dry deposition velocity in-creases with the vegetation density. As a first approximation, along the African ecosystem transect, the Vd gradient thus follows the climatic gradient. In fact, there exists a marked latitudinal gradient over the west and central African zone. Areas with the highest rainfall have the greatest volume of biomass or primary productivity; as a consequence, surface deposition (cuticle) and stomatal uptake become important, and the canopy resistance (Rc)is the main factor determining the deposition rate in vegetative zones (Tsai et al., 2010).
the one of O3 due to similar behavior for a variety of con-ditions and the importance of their stomatal uptake (Zhang et al., 2002a). However, some studies pointed out the impor-tance of the non-stomatal deposition fluxes in the case of O3 (Fowler et al., 2001; Stella et al., 2011). NH3Vdis similar to SO2but slightly higher due to its higher molecular diffusiv-ity. NH3and SO2are reasonably soluble gases in pure wa-ter and are effectively removed at higher rates under moist conditions (Erisman et al., 1993a, b; Erisman and Wyers, 1993). Even if the chemical characteristics of NH3 are not the same as SO2, the NH3Vdis parameterized similar to SO2 in this deposition model (Zhang et al., 2002a, 2003b). HNO3 presents the highestVdamong all the chemical species in this study because of its high solubility and reactivity. Note that in the big-leaf model of Zhang et al. (2003b), SO2and O3are used as base species to scale the dry deposition rate for other chemical species. The monthly means of dry deposition ve-locities range from 0.16 to 0.84 cm s−1for SO2, from 0.14 to 0.40 cm s−1for O3, from 0.16 to 0.99 cm s−1for NH3, from 0.13 to 0.37 cm s−1for NO2and from 0.48 to 2.56 cm s−1for HNO3on the transect dry savannas–wet savannas–forests. In addition,Vd are higher in the wet season for each ecosys-tem, especially in dry savannas, where the dry season is well marked. It is considered that higher deposition velocities in the wet season are mainly caused by non-stomatal uptake of wet canopies (Matsuda et al., 2006; Tsai et al., 2010). The interannual variability ofVdfor the 7 yr period (2002–2007) is low and range from 3 to 12 % for NH3and SO2, from 2 to 11 % for NO2and O3, and from 2 to 17 % for HNO3on the transect of ecosystems. These variations could be attributed to the spatio-temporal variations of meteorological data.
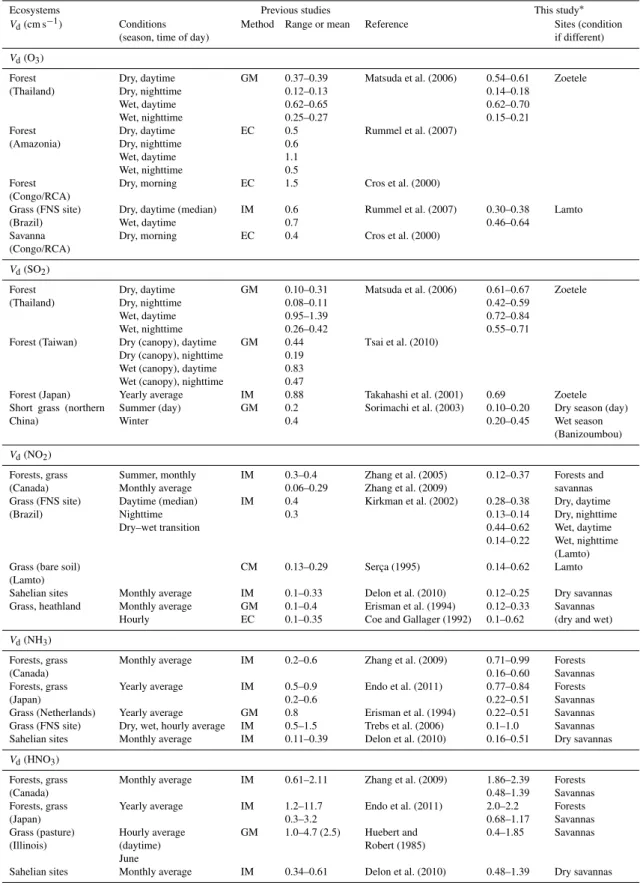
The comparison between our modeled Vd and previous studies is shown in Table 4. The Vd of O3 and SO2 lie well within the range of values determined for other tropical forests (Matsuda et al., 2006, Rummel et al., 2007; Tsai et al., 2010) and grasslands (Takahashi et al., 2001; Sorimachi et al., 2003). The modeledVdof NO2and NH3are within a reasonable range compared to reference values (Zhang et al., 2005, 2009; Trebs et al., 2006; Kirkman et al., 2002; Delon et al., 2010; Endo et al., 2011). The modeledVd of HNO3 on forest and grass were the lowest values of those reported by Endo et al. (2011), Huebert and Robert (1985) and oth-ers studies (e.g., Hanson and Lindberg, 1991; Duyzer and Fowler, 1994; Zhang et al., 2002a) mainly due to lower wind velocities in African ecosystems.
3.2 Dry deposition fluxes
Monthly dry deposition fluxes of NO2, NH3, HNO3, SO2and O3were estimated using the inferential method at west and central African sites of the IDAF network over the study pe-riod (1998–2007). By using the monthlyVdfrom each year and the monthly 6 yr averageVd(2002–2007) for the years that do not haveVddata, the monthly deposition fluxes have been calculated for each year and then averaged over the
study period in order to estimate the mean range values of gaseous deposition fluxes representative of African ecosys-tems.
3.2.1 Nitrogen compounds (NO2, HNO3, NH3)
Table 5 presents a synthesis of the mean seasonal and annual exchange fluxes of nitrogen compounds (NO2, HNO3, NH3) for all the IDAF sites.
Nitrogen dioxide (NO2)
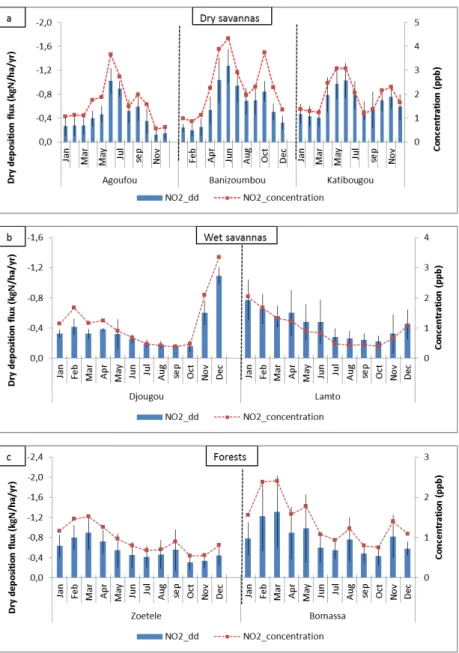
Figure 5 presents the monthly evolution of NO2dry deposi-tion flux (NO2_dd) estimated at the dry savannas of Niger and Mali (Fig. 5a: Banizoumbou, Agoufou, Katibougou), at the wet savannas of Côte d’Ivoire and Benin (Fig. 5b: Lamto, Djougou) and at the evergreen equatorial forests of Cameroon and Congo (Fig. 5c: Zoetele, Bomassa). Vertical bars indicate the standard deviation calculated over the study period (1998–2007). Average monthly evolution of NO2 con-centrations over the same study period is superimposed on the monthly dry deposition fluxes. The axes of fluxes are in-verted for all figures. We note a good correlation between gas concentrations and dry deposition fluxes on the transect dry savannas–wet savannas–forests.
In the dry savannas, maximum flux values are observed in May/June as for concentration values (Fig. 5a). In general, higher deposition fluxes in the wet season are due to both higher measured NO2 concentrations and its higher dry de-position velocity calculated in this season. In the Sahelian sites (Agoufou, Banizoumbou), seasonally averaged dry de-position fluxes are 2 times higher in the wet season than in the dry season (Table 5). Annual average dry deposition fluxes of NO2 are around−0.4 to−0.7 kg N ha−1yr−1in the dry
sa-vannas. These values calculated in these pastoral areas are in the lower range of deposition fluxes calculated for a tropi-cal pasture site in Brazil (Rondonia) (annual NO2deposition flux:−0.76 to−2.4 kg N ha−1yr−1), which is considerably
higher, mainly due to higher NO2 mixing ratios observed (Trebs et al., 2006).
Fig. 5.Evolution of monthly dry deposition fluxes of NO2(NO2_dd) in kg N ha−1yr−1(1998–2007) on the transect dry savannas(a), wet
savannas(b)and forests(c)associated with evolution of NO2concentrations (ppb).
In forests, higher deposition fluxes are observed in Febru-ary and March, i.e., at the end of the dry season and at the beginning of the wet season (Fig. 5c). Seasonal aver-age fluxes are on the same order between the two seasons (Table 5). NO2 concentration measurements tend to show that the biomass burning source during the dry season is equivalent to soil emissions buffered by canopy uptake in forests during the wet season (Adon et al., 2010). Annual average dry deposition fluxes of NO2 in forests (−0.5 to −0.8 kg N ha−1yr−1)are on the same order as in dry savan-nas (Table 5) due to higherVdvalues in forests and higher concentrations measured in dry savannas (Table 2). These values are well within the range of measurements derived by
Hanson et al. (1989), who showed that N deposition from NO2was between−0.008 and−1.9 kg N ha−1yr−1for nat-ural forests. They are also comparable to NO2 deposition fluxes estimated by Zhang et al. (2005) that range from−0.1 to−1.5 kg N ha−1yr−1at seven eastern Canadian rural sites
for a 1 yr period.
Table 4.Comparison of dry deposition velocities (cm s−1)for ozone, sulfur and nitrogen compounds between this study and previous studies.
Ecosystems Previous studies This study∗ Vd(cm s−1) Conditions
(season, time of day)
Method Range or mean Reference Sites (condition if different)
Vd(O3)
Forest (Thailand) Dry, daytime Dry, nighttime Wet, daytime Wet, nighttime GM 0.37–0.39 0.12–0.13 0.62–0.65 0.25–0.27
Matsuda et al. (2006) 0.54–0.61 0.14–0.18 0.62–0.70 0.15–0.21 Zoetele Forest (Amazonia) Dry, daytime Dry, nighttime Wet, daytime Wet, nighttime EC 0.5 0.6 1.1 0.5
Rummel et al. (2007)
Forest (Congo/RCA)
Dry, morning EC 1.5 Cros et al. (2000)
Grass (FNS site) (Brazil)
Dry, daytime (median) Wet, daytime
IM 0.6 0.7
Rummel et al. (2007) 0.30–0.38 0.46–0.64
Lamto
Savanna (Congo/RCA)
Dry, morning EC 0.4 Cros et al. (2000)
Vd(SO2)
Forest (Thailand) Dry, daytime Dry, nighttime Wet, daytime Wet, nighttime GM 0.10–0.31 0.08–0.11 0.95–1.39 0.26–0.42
Matsuda et al. (2006) 0.61–0.67 0.42–0.59 0.72–0.84 0.55–0.71
Zoetele
Forest (Taiwan) Dry (canopy), daytime Dry (canopy), nighttime Wet (canopy), daytime Wet (canopy), nighttime
GM 0.44 0.19 0.83 0.47
Tsai et al. (2010)
Forest (Japan) Yearly average IM 0.88 Takahashi et al. (2001) 0.69 Zoetele Short grass (northern
China)
Summer (day) Winter
GM 0.2 0.4
Sorimachi et al. (2003) 0.10–0.20 0.20–0.45
Dry season (day) Wet season (Banizoumbou)
Vd(NO2)
Forests, grass (Canada) Summer, monthly Monthly average IM 0.3–0.4 0.06–0.29
Zhang et al. (2005) Zhang et al. (2009)
0.12–0.37 Forests and savannas Grass (FNS site)
(Brazil) Daytime (median) Nighttime Dry–wet transition IM 0.4 0.3
Kirkman et al. (2002) 0.28–0.38 0.13–0.14 0.44–0.62 0.14–0.22 Dry, daytime Dry, nighttime Wet, daytime Wet, nighttime (Lamto) Grass (bare soil)
(Lamto)
CM 0.13–0.29 Serça (1995) 0.14–0.62 Lamto
Sahelian sites Monthly average IM 0.1–0.33 Delon et al. (2010) 0.12–0.25 Dry savannas Grass, heathland Monthly average
Hourly
GM EC
0.1–0.4 0.1–0.35
Erisman et al. (1994) Coe and Gallager (1992)
0.12–0.33 0.1–0.62
Savannas (dry and wet)
Vd(NH3)
Forests, grass (Canada)
Monthly average IM 0.2–0.6 Zhang et al. (2009) 0.71–0.99 0.16–0.60
Forests Savannas Forests, grass
(Japan)
Yearly average IM 0.5–0.9 0.2–0.6
Endo et al. (2011) 0.77–0.84 0.22–0.51
Forests Savannas Grass (Netherlands) Yearly average GM 0.8 Erisman et al. (1994) 0.22–0.51 Savannas Grass (FNS site) Dry, wet, hourly average IM 0.5–1.5 Trebs et al. (2006) 0.1–1.0 Savannas Sahelian sites Monthly average IM 0.11–0.39 Delon et al. (2010) 0.16–0.51 Dry savannas
Vd(HNO3)
Forests, grass (Canada)
Monthly average IM 0.61–2.11 Zhang et al. (2009) 1.86–2.39 0.48–1.39
Forests Savannas Forests, grass
(Japan)
Yearly average IM 1.2–11.7 0.3–3.2
Endo et al. (2011) 2.0–2.2 0.68–1.17 Forests Savannas Grass (pasture) (Illinois) Hourly average (daytime) June
GM 1.0–4.7 (2.5) Huebert and Robert (1985)
0.4–1.85 Savannas
Sahelian sites Monthly average IM 0.34–0.61 Delon et al. (2010) 0.48–1.39 Dry savannas
∗In this study, monthly and yearly
Vdare mean values averaged over the study period (1998–2007). Hourly (daytime, nighttime)Vdare diurnal values averaged over a month (January for dry
season and August for wet season) of 2006.
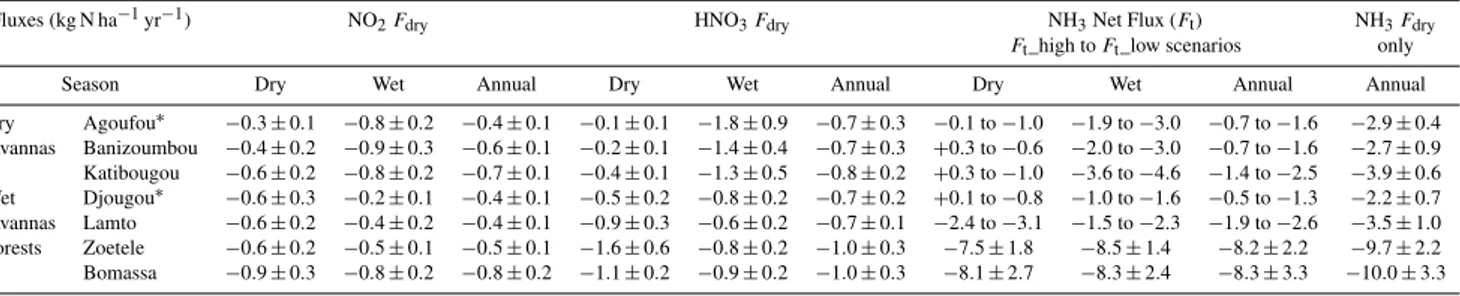
Table 5.Mean seasonal and annual dry deposition fluxes and standard deviation (Fdry)of NO2and HNO3as well as NH3net bidirectional
fluxes (Ft, from high to low scenario estimates) at IDAF sites of west and central Africa over the period 1998–2007. Annual NH3dry
deposition fluxes are added for comparison. Fluxes are expressed in kg N ha−1yr−1.
Fluxes (kg N ha−1yr−1) NO
2Fdry HNO3Fdry NH3Net Flux (Ft) NH3Fdry
Ft_high toFt_low scenarios only Season Dry Wet Annual Dry Wet Annual Dry Wet Annual Annual
Dry Agoufou∗
−0.3±0.1 −0.8±0.2 −0.4±0.1 −0.1±0.1 −1.8±0.9 −0.7±0.3 −0.1 to−1.0 −1.9 to−3.0 −0.7 to−1.6 −2.9±0.4 savannas Banizoumbou −0.4±0.2 −0.9±0.3 −0.6±0.1 −0.2±0.1 −1.4±0.4 −0.7±0.3 +0.3 to−0.6 −2.0 to−3.0 −0.7 to−1.6 −2.7±0.9 Katibougou −0.6±0.2 −0.8±0.2 −0.7±0.1 −0.4±0.1 −1.3±0.5 −0.8±0.2 +0.3 to−1.0 −3.6 to−4.6 −1.4 to−2.5 −3.9±0.6 Wet Djougou∗ −0.6±0.3 −0.2±0.1 −0.4±0.1 −0.5±0.2 −0.8±0.2 −0.7±0.2 +0.1 to−0.8 −1.0 to−1.6 −0.5 to−1.3 −2.2±0.7 savannas Lamto −0.6±0.2 −0.4±0.2 −0.4±0.1 −0.9±0.3 −0.6±0.2 −0.7±0.1 −2.4 to−3.1 −1.5 to−2.3 −1.9 to−2.6 −3.5±1.0 Forests Zoetele −0.6±0.2 −0.5±0.1 −0.5±0.1 −1.6±0.6 −0.8±0.2 −1.0±0.3 −7.5±1.8 −8.5±1.4 −8.2±2.2 −9.7±2.2 Bomassa −0.9±0.3 −0.8±0.2 −0.8±0.2 −1.1±0.2 −0.9±0.2 −1.0±0.3 −8.1±2.7 −8.3±2.4 −8.3±3.3 −10.0±3.3
∗Deposition flux values of Agoufou and Djougou are averaged over the period 2005–2009.
al., 1992; Coe and Gallagher, 1992; Gao et al., 1996). Previ-ous studies reported NO2compensation point concentrations ranging from 0.05 to 3 ppb depending on tree species and en-vironmental conditions (Sparks et al., 2001; Raivonen et al., 2009; Breuninger et al., 2013, and references therein). How-ever, the existence of such a compensation point is question-able (Lerdau et al., 2000; Chaparro-Suarez et al., 2011).
Nitric acid (HNO3)
Monthly evolution of HNO3dry deposition fluxes is similar to that of HNO3concentrations on the transect of ecosystems (Fig. 6a, b, c). In the dry savannas, HNO3 dry deposition fluxes are very low in the dry season, especially at Agoufou and Banizoumbou, and much (4–12 times more) higher in the wet season due to both higher HNO3concentrations and dry deposition velocities in this season for the three sites. Seasonal average fluxes range from−0.1 kg N ha−1yr−1 in
the dry season to−1.8 kg N ha−1yr−1in the wet season
(Ta-ble 5). In the wet savannas, the difference in deposition fluxes between the two seasons is low with higher values in the dry season at Lamto (−0.9 kg N ha−1yr−1)and in the wet season at Djougou (−0.8 kg N ha−1yr−1). The deposition fluxes are
less important in the dry season at Djougou due to smaller HNO3 Vd in this season. In forests, seasonal average de-position fluxes of HNO3 are on the same order between the two seasons (−1 kg N ha−1yr−1)at Bomassa and higher (−1.6 kg N ha−1yr−1)in the dry season of Zoetele due to higher values of HNO3concentrations. Annual mean dry de-position fluxes of HNO3are around−0.7 kg N ha−1yr−1in the dry and wet savannas and−1.0 kg N ha−1yr−1in forests (Table 5). Annual mean HNO3deposition fluxes show a low variability according to the ecosystems, with seasonal differ-ences especially pronounced in the dry savannas. Although HNO3 concentrations (0.3–0.5 ppb) were lower than NO2 (0.9–2.4 ppb) on the African ecosystems transect (Table 2), HNO3 dry deposition fluxes were typically as important as NO2 dry deposition fluxes owing to higher Vd values for HNO3.
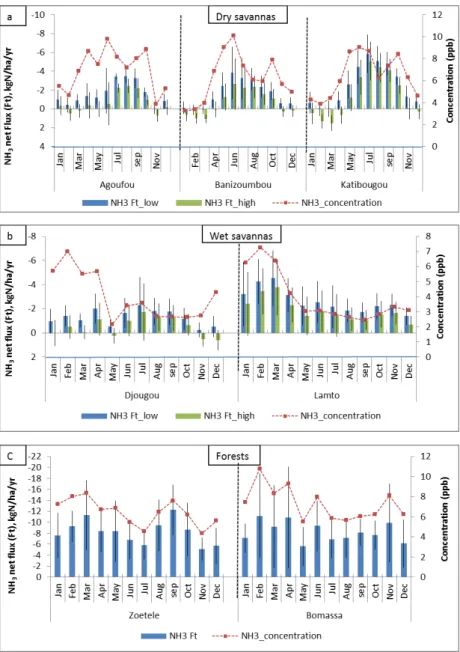
Ammonia (NH3) bidirectional fluxes
Figure 7 presents the monthly evolution of estimated low and high surface–atmosphere exchange fluxes of NH3on the transect of ecosystems. For the forests, only one scenario has been estimated (Sect. 2.2.3). Bidirectional NH3flux sce-narios complemented by a “deposition only” scenario (Xcp (NH3)=0) are presented in Table 5.
In the dry savannas, seasonal mean fluxes of NH3range from a deposition of−1.0 kg N ha−1yr−1to an emission of +0.3 kg N ha−1yr−1 in the dry season and a deposition of −1.9 to−4.6 kg N ha−1yr−1in the wet season (Table 5). The
NH3 net emission fluxes observed in the dry season for our higher scenario estimate are due to higherXcp(NH3)in this season (Fig. 7a, Fig. 3). This is consistent with observations made in some seminatural ecosystems where air concentra-tions are low under very dry condition or at high tempera-tures (Langford and Fehsenfeld, 1992; Erisman et al., 1994; Sutton et al., 1995; Flechard and Fowler, 1998). In the wet season, NH3dry deposition fluxes are more important due to higher measured NH3concentrations and higher NH3Vd simulated during the short vegetative period. Dry savannas are generally pastoral areas; the main sources include bacte-rial decomposition of urea in animal excreta, which is very active in the wet season with the hydrolysis of urea, and emissions from natural soils (Schlesinger and Hartley, 1992; Bouwman et al., 1997, 2002a). Because of the short lifetime of NH3(1–5 days or less), low source height and relatively highVd, a substantial fraction (20–40 %) would likely de-posit near its source (Aneja et al., 2001).
In the wet savannas, seasonal average net fluxes of NH3 range from −3.1 kg N ha−1yr−1 (deposition) to
Fig. 6.Evolution of monthly dry deposition fluxes of HNO3(HNO3_dd) in kg N ha−1yr−1(1998–2007) on the transect dry savannas(a),
wet savannas(b)and forests(c)associated with evolution of HNO3concentrations (ppb).
emission fluxes, like in the dry savannas. Generally, higher concentrations of NH3in the dry season are due to savanna fires, which are a significant source of ammonia in tropical regions (Lobert et al., 1990; Delmas et al., 1995). For the forested ecosystems, only dry deposition occurs due to low compensation point and no significant difference between wet and dry seasons (Fig. 7c). Seasonal NH3dry deposition fluxes are around−8 kg N ha−1yr−1in the dry and wet
sea-sons (Table 5).
Over the study period, annual average dry deposition fluxes of NH3 range from −1.6 to −2.5 kg N ha−1yr−1 in
the dry savannas and from −1.3 to −2.6 kg N ha−1yr−1
in the wet savannas for our lower scenario estimate, and
reduced by 26 to 62 % in the case of our higher sce-nario (Table 5). In the forests, the mean annual NH3 net fluxes are around−8 kg N ha−1yr−1. If NH3were assumed
to be deposited only (i.e., no bidirectional exchange, Xcp (NH3)=0), then the mean annual dry deposition fluxes
would be more important and would range from −2.2 to −3.9 kg N ha−1yr−1in dry and wet savannas and would be
around−10 kg N ha−1yr−1in forests (Table 5).
Fig. 7.Evolution of monthly bidirectional fluxes of NH3in kg N ha−1yr−1(1998–2007) on the transect dry savannas(a), wet savannas(b)
and forests(c)associated with evolution of NH3concentrations (ppb). For the savannas, lower (Ft_low) and higher (Ft_high) scenarios of
NH3net fluxes were estimated.
Total nitrogen dry deposition fluxes from NO2, HNO3
and NH3
Using the two bidirectional NH3exchange scenarios, the an-nual total N (NO2+HNO3+NH3)dry depositions fluxes are estimated to range from−1.8 to−3.9 kg N ha−1yr−1in dry savannas and from−1.6 to−3.8 kg N ha−1yr−1 in wet
sa-vannas and are estimated to be around−10 kg N ha−1yr−1
in forests. On the transect, annual total N dry deposition is more important in forests due to higher NH3 deposi-tion fluxes, and is on the same order in wet savannas and dry savannas. In savannas, N dry deposition is more im-portant at Katibougou for the Sahelian sites and at Lamto
If NH3 were considered to be deposited only (no bidirec-tional exchange), the annual total N dry deposition would range from −4.0 to −5.3 kg N ha−1yr−1 in dry savannas, from−3.2 to−4.6 kg N ha−1yr−1in wet savannas and from −11.2 to−11.7 kg N ha−1yr−1in forests.
Over the study period (1998–2007), the interannual vari-ability of the dry deposition fluxes ranged from 23 to 63 % for NH3(low scenario), from 13 to 30 % for NO2and from 21 to 43 % for HNO3on the transect dry savannas–wet savannas– forests. No specific trend in the variability is observed, as already concluded in the study of Delon et al. (2012). The interannual variability is largely attributable to the variabil-ity of gaseous concentrations due to the potential variation of the intensity of atmospheric sources and the variability of meteorological data.
To give the relative contribution of dry to total deposi-tion fluxes, we calculated total nitrogen wet deposideposi-tion fluxes from the IDAF database (http://idaf.sedoo.fr) for the same study period (1998–2007) for each site (Adon, 2011). The wet deposition flux has been calculated as the product of the ammonium and nitrate concentrations in rain (annual volume-weighted mean VWM) by the annual rainfall (Galy-Lacaux and Modi, 1998; Galy-(Galy-Lacaux et al., 2009, and ref-erences therein). The total N wet (NO−3+NH+4)deposition fluxes estimated range from−1.6 to−3.2 kg N ha−1yr−1in
dry savannas, from−3.5 to−5.2 kg N ha−1yr−1 in wet sa-vannas and are around−4.6 kg N ha−1yr−1in forests. These values are well comparable with those reported by previous studies (Yoboue et al., 2005; Sigha et al., 2003; Laouali et al., 2012) but not exactly in the same period. Using the bidi-rectional scenarios, the total N (dry+wet) deposition fluxes
were estimated to range from−3.4 to −7.1 kg N ha−1yr−1
in dry savannas, from−5.1 to−9.0 kg N ha−1yr−1 in wet
savannas and be around−14.4 kg N ha−1yr−1in forests. We
estimate that dry deposition process in gaseous form con-tributes 31–68 % of the total N deposition fluxes over African ecosystems.
3.2.2 Sulfur dioxide (SO2)
The monthly evolution of SO2dry deposition flux (SO2_dd) on the transect of ecosystems is generally comparable to SO2concentrations over the period 2002–2007 following the same gradient (Fig. 8a–c). We note that the standard devia-tion of monthly mean fluxes is important. In fact, monthly SO2concentrations measured at IDAF sites are low and vary considerably from one year to another for the same month.
If we consider the season, average SO2 dry depo-sition fluxes range in the wet season from −0.8 to −1.0 kg S ha−1yr−1in dry and wet savannas and from−0.7
to−1.1 kg S ha−1yr−1in forests, and in the dry season from −0.3 to−0.5 kg S ha−1yr−1in dry savannas and from−0.8
to −0.9 kg S ha−1yr−1 in wet savannas and forests. Adon
et al. (2010) observed the same order of SO2 concentra-tions in dry and wet seasons in each ecosystem with higher
values in the wet season for dry savannas. This suggests a contribution of soil emission, biosphere and biomass burn-ing sources (Van Breemen, 1982, 1993; Macdonald et al., 2004; Bates et al., 1992; Arndt et al., 1997). The sulfur content of vegetation is lower compared to carbon and ni-trogen elements and SO2emissions factors for combustion processes are lower than those for carbonaceous or nitro-gen species (Lacaux et al., 1995). The 6 yr mean annual dry deposition fluxes of SO2 are−0.7±0.3 kg S ha−1yr−1
at Agoufou, −0.5±0.2 kg S ha−1yr−1 at Banizoumbou
and −0.7±0.3 kg S ha−1yr−1 at Katibougou in dry
sa-vannas; −0.9±0.2 kg S ha−1yr−1 at Djougou and−0.8±
0.4 kg S ha−1yr−1 at Lamto in wet savannas; and −0.8±
0.3 kg S ha−1yr−1at Zoetele; and−1.0±0.5 kg S ha−1yr−1
at Bomassa in forests. Along the ecosystem transect, the an-nual mean of SO2dry deposition fluxes presents low values and a small variability (−0.5 to−1 kg S ha−1yr−1). The in-terannual variability over the 6 yr period is between 25 and 49 % for all the sites and no specific trend is observed.
In general, dry deposition fluxes of SO2 estimated at African ecosystems are lower compared to other tropical ecosystems (Takahashi et al., 2002; Sorimachi et al., 2003) although the Vd modeled are on the same order (Table 4). This is due to low measured concentrations (on the order of 1–2 ppb). Indeed, the remote measurement sites of the IDAF network have not yet been impacted on by anthropogenic ac-tivities or industrial emissions.
3.2.3 Ozone (O3)
The monthly evolution of O3dry deposition fluxes (O3_dd) is similar to that of O3 concentrations on the transect of ecosystems over the period 2001–2007, as in the case of NO2(Fig. 9a–c). In the semiarid savannas, the seasonal cy-cle is cy-clear with maximum O3deposition fluxes in the heart of the wet season due to higher values of both O3 concen-trations and Vd. In fact, high ozone concentrations during the wet season are the result of active photochemical pro-duction of O3 in the boundary layer associated with high NOx concentrations (Stewart et al., 2008). In the Sahelian region, the ozone production in the wet season is mainly related to natural biogenic precursor sources (Adon et al., 2010). The seasonal average deposition fluxes are−6.4±4.1
and −21.0±3.2 kg ha−1yr−1 at Agoufou, −7.2±2.0 and −20.4±3.6 kg ha−1yr−1at Banizoumbou and−13.0±2.5 and−23.0±4.1 kg ha−1yr−1at Katibougou, in dry and wet seasons, respectively. In the wet savannas, the seasonal av-erage O3 deposition fluxes are on the same order with val-ues of−20.3±1.5 and−18.6±3.3 kg ha−1yr−1at Lamto,
and−16.0±3.6 and−17.6±3.8 kg ha−1yr−1 at Djougou,
Fig. 8.Evolution of monthly dry deposition fluxes of SO2(SO2_dd) in kg S ha−1yr−1(2002–2007) on the transect dry savannas(a), wet
savannas(b)and forests(c)associated with evolution of SO2concentrations (ppb).
the mean seasonal deposition fluxes of O3 are−18.8±0.3
and−11.3±0.9 kg ha−1yr−1at Zoetele and−10.1±1.1 and −10.8±0.8 kg ha−1yr−1 at Bomassa, in dry and wet
sea-sons, respectively. We note that these seasonal values are on the same order between the two seasons at Bomassa but they are higher in the dry season at Zoetele due to higher O3 con-centrations measured in this season.
The 7 yr mean annual dry deposition fluxes of O3 range from −11 to −19 kg ha−1yr−1 in dry and wet savan-nas (−11.2±3.3 kg ha−1yr−1 at Agoufou, −12.7±2.4 kg ha−1yr−1 at Banizoumbou and −17.2±2.7 kg ha−1yr−1
at Katibougou, −16.9±3.2 kg ha−1yr−1 at Djougou and −19.3±3.4 kg ha−1yr−1 at Lamto) and from −11 to
−13 kg ha−1yr−1 in forests (−13.2±2.9 kg ha−1yr−1 at
Zoetele and−10.6±0.7 kg ha−1yr−1at Bomassa). The
un-adjusted estimates of O3dry deposition fluxes in forests (if the correction factor was not applied for O3concentrations (see Sect. 2.2.3), the O3deposition fluxes would range from
−8 to−10 kg ha−1yr−1. The interannual variability of O3
Fig. 9.Evolution of monthly dry deposition fluxes of O3(O3_dd) in kg ha−1yr−1 (2001–2007) on the transect dry savannas (a), wet
savannas(b)and forests(c)associated with evolution of O3concentrations (ppb).
of the Sahelian zone (thus, lowVd). The low values of O3dry deposition in forests are correlated to low values of O3 con-centrations that were 2 to 3 times lower than those measured in the other ecosystems (Table 2). Several studies have shown that tropical forests appear to be major O3 sinks, through ground and foliage deposits and loss through chemical reac-tions with hydrocarbons and nitrogen oxides (Rummel at al., 2007; Jacob and Wofsy, 1990; Bakwin et al., 1990; Kaplan et al., 1988).
Few observational studies of O3 deposition fluxes for a long-term period are available over tropical areas, although several studies concerning the diurnal evolution have been conducted in the rainforests (Cros et al., 1992, 2000; Andreae
et al., 1992; Rummel et al., 2007; Matsuda et al., 2005). The modeled O3 Vdin our study are within the range of values determined in other tropical ecosystems (Table 4). In gen-eral, the O3 deposition fluxes estimated in African forests are lower compared to other tropical forests (Mikkelsen et al., 2004; Zeller and Nikolov, 2000); this is due to lower con-centrations measured.
4 Conclusions
and ozone (O3)in major African ecosystems, represented by IDAF sites.
NO2, HNO3, SO2 and O3 were considered to be net de-posited, while surface–atmosphere exchange of NH3is con-sidered to be bidirectional for all ecosystems. Monthly dry deposition fluxes have been estimated by the inferential tech-nique, using air concentrations measured monthly by passive samplers for a long-term period (1998–2007) and modeled exchange rates. Surface and meteorological conditions spe-cific to IDAF sites have been used in the deposition models. Along the transect of ecosystems, simulation results show thatVdincreases with the vegetation density. Thus, the lower values ofVdfor all gases have been obtained in the dry savan-nas and the higher values in the forests. For each ecosystem, the seasonal and annual mean variations of gaseous dry de-position fluxes have been analyzed. Dry dede-position fluxes are more important in the wet season for all the gases in the dry savannas due to higher values of both concentrations andVd in this season. For the wet savannas and forested ecosystems, seasonal dry deposition fluxes are generally on the same or-der between the dry and wet seasons for all the gases except for NO2in the wet savannas, and for HNO3 and O3 at the Zoetele forested site, where flux values are higher in the dry season due to much higher concentrations.
Along the latitudinal transect of ecosystems, the an-nual mean dry deposition fluxes of nitrogen compounds range from −0.4 to −0.8 kg N ha−1yr−1 for NO2, from −0.7 to −1.0 kg N ha−1yr−1 for HNO3, and from −0.7
to −8.3 kg N ha−1yr−1 for NH3 over the study
pe-riod (1998–2007). The total nitrogen dry deposition flux (NO2+HNO3+NH3) is more important in forests (∼ −10 kg N ha−1yr−1)than in wet and dry savannas (−1.6 to−3.9 kg N ha−1yr−1). If NH3 was considered to be de-posited only to the ecosystems, the annual total N dry depo-sition would range from−3.2 to−5.3 kg N ha−1yr−1in dry
and wet savannas, and from−11.2 to−11.7 kg N ha−1yr−1
in forests. Along the ecosystem transect, the annual mean of SO2 dry deposition fluxes presents low values and a small variability (−0.5 to −1 kg S ha−1yr−1). For ozone,
the annual mean dry deposition fluxes range from −11 to −19 kg ha−1yr−1 in dry and wet savannas and from −11
to −13 kg ha−1yr−1 in forests. The lower O3 dry
deposi-tion fluxes in forests are due to low measured O3 concen-trations despite higherVd. Over the study period, the interan-nual variability of gaseous dry deposition fluxes showed no specific trend. Over African ecosystems, our study assumed that gaseous dry deposition contributes to 31–68 % of the to-tal (dry+wet) N deposition fluxes.
This study allowed for estimates of the mean range of gaseous dry deposition fluxes representative of major tropi-cal African ecosystems in west and central Africa. This is one of the major scientific objectives of the IDAF program. It is based on original and unique data from remote and seldom-explored regions. To improve this work, it is important to not only address the uncertainties in the determination of dry
de-position velocities but also use the bidirectional approach for other gases such as NO2; more investigation on the ground emission potential in the case of NH3 surface–atmosphere exchange is needed. Within the IDAF network, we suggest to perform an experimental determination of dry deposition fluxes by other methods (e.g., gradient method, eddy corre-lation) on the measurement sites to be compared with fluxes estimated by the inferential method. Furthermore, we plan to use the model RegCM4 (regional climatic model) (Giorgi et al., 2012; Shalaby et al., 2012) to simulate the regional trends of gaseous dry deposition fluxes and to compare these results to long-term IDAF observations. This work will al-low for providing a high-resolution map of dry deposition at regional scales of the African ecosystems useful for impact studies.
Appendix A
The dry deposition flux (Fdry)can be expressed as a function of a dry deposition velocity (Vd)and an atmospheric concen-tration (Xa):
Fdry= −Vd·Xa. (A1) TheVdis obtained from the sum of three resistances in series as follows:
Vd=(Ra+Rb+Rc)−1, (A2) where Ra is the aerodynamic resistance to transfer of a species as a result of atmospheric turbulence in the surface layer between a heightZand the surface, characterized byZ0 (roughness length). It is computed from the following equa-tion (Padro et al., 1991):
Ra= 1 ku∗
0.74 ln(Z/Z0)−9H(Z/L), (A3) where9His the integrated stability function for heat andk is the von Karman constant (0.4). L is a stability parame-ter (Monin–Obukhov length) and can be computed jointly withu∗(friction velocity) from the basic surface layer equa-tions, requiring only the temperatures at two different heights and the wind at one height. The conditions of application of Eq. (A3) are discussed in Padro et al. (1991). Under very sta-ble conditions, the Richardson number is constrained to an upper limit value of 0.21. In our simulation, after a statistical analysis, the friction velocity is constrained to a lower limit value of 0.1 m s−1for savanna sites and 0.2 m s−1for forest sites.
Rb is the quasi-laminar sublayer resistance above the canopy and it is computed from the following equation (Padro and Edwards, 1991):
Rb= 2 ku∗
whereνis the kinematic viscosity of air andDjis the
molec-ular diffusivity of a speciesj in air.
Rc is the surface or canopy resistance, and characterizes the surface affinity for pollutant uptake. A large part of the uncertainty of the inferential method might be attributed to the parameterization ofRc. Zhang et al. (2003b) proposed a revised parameterization ofRcby including non-stomatal re-sistance (Rns)parameterizations based on study results over five different vegetation types in North America (i.e., Zhang et al., 2002b, 2003a):
1 Rc
= 1−wst
Rst+Rm
+ 1
Rns,
(A5) 1
Rns = 1 Rcut+
1
Rac+Rg, (A6) where the sub-resistancesRst,Rm,Rcut,Rac andRgare re-spectively stomatal, mesophyll, cuticle, in-canopy aerody-namic and soil resistances. wst is the fraction of stomatal blocking under wet conditions. One of the improvements to the model of Zhang et al. (2003b) includes more realis-tic treatment of curealis-ticle resistance, which is parameterized as functions of leaf wetness (dry vs. wet; dew vs. rain), relative humidity, leaf area index (LAI), friction velocity and land-use-specific reference values.Rac is also a function of the LAI, the friction velocity and the land-use specific reference value. Note thatRgandRcutare calculated for SO2and O3 and then scaled for other gases.Rstis calculated using a sun-lit/shade stomatal resistance sub-model (Zhang et al., 2002a). Thus, in this improved parameterization,Rcdepends on the type of canopy, the chemical species and the meteorological conditions. It is important to note thatRc of HNO3is cal-culated in this model and constrained to a lower limit value of 10 s m−1, although previous studies showed that dry de-position of HNO3 is mostly controlled by aerodynamic re-sistances (Zhang et al., 2002a, and references therein). The parameterizations of all these sub-resistances, the land-use categories (LUC) and all related parameters as well as more details can be found in Zhang et al. (2003b).
Appendix B
The net bidirectional flux at a reference height above the canopy can be expressed as
Ft=
(Xa−Xc)
Ra+Rb , (B1)
whereXaandXcare the ambient concentrations at the refer-ence height and at the canopy top, respectively. In the model, Xcitself is expressed as a function ofXa(Zhang et al., 2010). The formulas of resistances are the same as in the original big-leaf model (Zhang et al., 2003b).
Zhang et al. (2010) demonstrated that the differences in the fluxes (1F ) between the new bidirectional model (Ft)
and the only dry deposition big-leaf model (Fdry, Zhang et al., 2003b) can be estimated from the following equation: 1F =Ft−Fdry=Xcp·Vd (B2) withXcpthe canopy compensation point andVdthe deposi-tion velocity calculated from the original big-leaf model.
Xcpcan be estimated from Eq. (B3):
Xcp=
xst
Rst+ xg
Ra+Rg 1 Rst+
1 Rac+Rg+
1 Rcut
−1
,
(B3) wherexstandxgare stomatal and soil compensation points, respectively.xstis a function of stomatal emission potential (Ŵst)and the temperature of the leaf stomata, and thenxg is a function of the ground emission potential (Ŵg)and the temperature of the ground surface. The compensation point increases exponentially with increasing temperature (Zhang et al., 2010).
In this study, as we use monthly measurement concentra-tions for a long period, we infer the NH3net fluxes (Ft)from the following equation:
Ft=1F+Fdry= −Vd(Xa−Xcp), (B4) where1F(> 0) is calculated monthly (from 3-hourly values) directly in the bidirectional model (Eq. B2) andFdry (< 0) calculated monthly by Eq. (A1).
The canopy compensation point (Xcp)is the atmospheric NH3concentration for which the fluxes between the surface and the atmosphere change directions from emission (Ft> 0) to deposition (Ft< 0) (or vice versa).
More details on the parameterizations of this new bidirec-tional model can be found in Zhang et al. (2010).
Acknowledgements. This work is part of the IDAF (IGAC/DEBITS/AFRICA) project, and was funded by the INSU/CNRS “Institut National des Sciences de l’Univers/Centre National de Recherche Scientifique” in France and the API “African Monsoon Multidisciplinary Analyses” (AMMA in 2005). Edited by: A. B. Guenther
The publication of this article is financed by CNRS-INSU.
References