Atmos. Chem. Phys., 11, 12421–12436, 2011 www.atmos-chem-phys.net/11/12421/2011/ doi:10.5194/acp-11-12421-2011
© Author(s) 2011. CC Attribution 3.0 License.
Atmospheric
Chemistry
and Physics
Long-term impacts of aerosols on precipitation and lightning over
the Pearl River Delta megacity area in China
Y. Wang1, Q. Wan2, W. Meng2, F. Liao2, H. Tan1,2, and R. Zhang1
1Department of Atmospheric Sciences, Texas A&M University, College Station, Texas, USA
2Institute of Tropical and Marine Meteorology, China Meteorological Administration, Guangzhou, China
Received: 5 April 2011 – Published in Atmos. Chem. Phys. Discuss.: 18 August 2011 Revised: 19 November 2011 – Accepted: 29 November 2011 – Published: 12 December 2011
Abstract. Seven-year measurements of precipitation, light-ning flashes, and visibility from 2000 to 2006 have been an-alyzed in the Pearl River Delta (PRD) region, China, with a focus on the Guangzhou megacity area. Statistical analy-sis shows that the occurrence of heavy rainfall (>25 mm per day) and frequency of lightning strikes are reversely corre-lated to visibility during this period. To elucidate the effects of aerosols on cloud processes, precipitation, and lightning activity, a cloud resolving – Weather Research and Forecast-ing (CR-WRF) model with a two-moment bulk microphys-ical scheme is employed to simulate a mesoscale convec-tive system occurring on 28 Match 2009 in the Guangzhou megacity area. The model predicted evolutions of composite radar reflectivity and accumulated precipitation are in agree-ment with measureagree-ments from S-band weather radars and automatic gauge stations. The calculated lightning potential index (LPI) exhibits temporal and spatial consistence with lightning flashes recorded by a local lightning detection net-work. Sensitivity experiments have been performed to re-flect aerosol conditions representative of polluted and clean cases. The simulations suggest that precipitation and LPI are enhanced by about 16 % and 50 %, respectively, under the polluted aerosol condition. Our results suggest that elevated aerosol loading suppresses light and moderate precipitation (less than 25 mm per day), but enhances heavy precipitation. The responses of hydrometeors and latent heat release to dif-ferent aerosol loadings reveal the physical mechanism for the precipitation and lightning enhancement in the Guangzhou megacity area, showing more efficient mixed phase processes and intensified convection under the polluted aerosol condi-tion.
Correspondence to:R. Zhang (zhang@ariel.met.tamu.edu)
1 Introduction
Atmospheric aerosols, formed from natural and anthro-pogenic sources (Zhang et al., 2004a; IPCC, 2007; Zhang, 2010), have been closely linked with modification of cloud systems of diverse scales, ranging from isolated convective storms (van den Heever and Cotton, 2006; Fan et al., 2007a, b, 2008; Li et al., 2008a), mesoscale convective systems such as squall lines (Li et al., 2009; Tao et al., 2007) and hurri-canes (Khain et al., 2008), to large scale circulations such as wintertime Pacific storm track (Zhang et al., 2007; Li et al., 2008b) and summertime Asian monsoon (Lau et al., 2006). The impacts of aerosols on cloud systems include di-rect alteration of the solar radiation budget and indidi-rect mod-ification of the cloud dynamics and microphysical proper-ties (Ramanathan et al., 2001; Tie et al., 2003; Khain et al., 2005). However, the nonlinear or non-monotonic nature in the aerosol-cloud-precipitation interaction poses large chal-lenges on quantification of the aerosol effects on cloud sys-tems (Li et al., 2008a; Ntelekos et al., 2009). Currently, the direct and indirect forcing of aerosols on climate is highly uncertain, representing the largest uncertainty in climate pre-dictions (IPCC, 2007).
Substantial effort has been made to examine the aerosol-cloud interaction under different atmospheric conditions us-ing numerical model simulations. Several mechanisms have been proposed to elaborate the role of aerosols on cloud development and precipitation under different dynamic and thermodynamic scenarios. It has been suggested that the aerosol effects on cloud properties vary with convective available potential energy (CAPE) and wind shear (Lee et al., 2008) and depend on the morphology of clouds (Lee et al., 2010). Fan et al. (2007b) indicated that relative humidity plays an important role in the regulating aerosol effects. An-other recent study by Fan et al. (2009) revealed a dominant
role of wind shear on aerosol-cloud interaction. In addition, cold pool produced by evaporative cooling has been demon-strated to considerably modulate the influence of aerosols on the development of convective systems (van den Heever and Cotton, 2006; Tao et al., 2007). Khain (2009) further sug-gested that heat and condensate mass budgets need to be eval-uated when considering the effect of aerosols on precipita-tion. In addition, it has been suggested that the cloud droplet effective radius may increase or decrease with aerosol load-ing, depending on cloud dynamic and thermodynamic condi-tions and aerosol properties (Yuan et al., 2008).
The plausible effect of urban aerosols on lightning en-hancement in thunderstorms was first suggested by West-cott (1995). Orville et al. (2001) examined cloud-to-ground lightning flashes from the National Lightning Detection Net-work (NLDN) in Houston, Texas for a twelve-year period and found a higher lightning flash density near the urban area. Over major urban areas of South Korea, enhancement of cloud-to-ground lightning under high aerosols loading was documented on the basis of the measured lightning flashes and particulate matter (PM) (Kar et al., 2009). However, quantitative assessment of the aerosol effect on lightning is lacking, because of simplistic treatments of aerosol-cloud in-teraction in most the microphysical schemes in atmospheric numerical models and the complexity in representing elec-trification and discharge processes in thunderstorms. Sev-eral mechanisms and parameterizations of cloud electrifica-tion have been proposed and developed on the basis of avail-able laboratory results to simulate the structure and location of charge distributions and lightning occurrence in thunder-storms (Williams et al., 1991, 1994; Altaratz et al., 2005; Mansell et al., 2009).
According to the long-term ground lightning observa-tion and results from the Lightning Imaging Sensor (LIS) database, the Pearl River Delta (PRD) area (113◦–114.5◦E, 21.5◦–23.5◦N) with a cluster of large cities including Guangzhou, Shenzhen, Hong Kong and Macau, exhibits frequent lightning strikes and has a lightning density of 31.4 flashes km−2yr−1, the largest value observed in China (Ma, 2005). Statistical studies revealed that lightning in the PRD area occurs mainly in the spring and summer with dominant negative strikes, consisting of 96.7 % of the to-tal cloud-ground lightning (Yi et al., 2006). The thermody-namic and dythermody-namical conditions in this area are favorable for cloud electrification and lightning formation, since the region is located in the subtropical and coastal area with abundant solar heating and moisture sources. In addition, urbaniza-tion in this area forms a cluster of large cities with the ur-ban land surface characteristics such as increased roughness, decreased moisture availability, and decreased thermal iner-tia, leading to a prominent urban heat island effect. From the perspective of the large-scale dynamics, frequent intru-sions of frontal systems from the northwest during the tran-sition seasons between summer and winter and tropical cy-clones (typhoons) developed over the western Pacific in the
summertime foster strong vertical motion and development of intensive convective systems for heavy precipitation and lightning formation.
With fast economic and social development in the south-ern region of China since the 1970s, elevated anthropogenic pollutants from coal and biomass burning and industry emis-sions have caused severe episodes of air pollution in the PRD area. The occurrence of low visibility (less than 10 km) has remained highly frequent (150 days per year) since 1980, on the basis of the long-term visibility observation (Deng et al., 2008). Aerosol optical depth (AOD) retrieved from the Moderate-resolution Imaging Spectroradiometer (MODIS) satellite shows a typical value of larger than 0.6 in the PRD region, because of the existence of a persistent haze layer, which is also referred to as the Asian Brown Cloud (Wu et al., 2005). In addition to primary emissions of natural and anthropogenic origins, photochemical oxidation of an-thropogenic and biogenic inorganic and organic compounds leads to nucleation and growth of secondary aerosols, con-tributing to PM pollution in this region (Suh et al., 2001; Lei and Zhang, 2001; Zhang et al., 2002a, b, 2004b; Wang et al., 2010). Several major field campaigns of air quality studies, such as the Program of Regional Integrated Experiments of Air Quality in the Pearl River Delta (PRIDE-PRD) 2004 and 2008 (Zhang et al., 2008), have been conducted in this re-gion to monitor the pollution situation and characterize the chemical and meteorological conditions responsible for ac-cumulations of gaseous and PM pollutants of primary and secondary origins. In addition to their effects on visibility, human health, and weather and regional climate, pollution aerosols profoundly impact atmospheric chemistry via multi-phase processes (Molina et al., 1997; Zhang et al., 1996).
Y. Wang et al.: Long-term impacts of aerosols on precipitation and lightning 12423
2 Data sources and model description
Lightning flashes are taken from a local lightning monitor-ing system, which has been established since 2000. This represents a province-wide lighting detection (LD) network consisting of 16 lightning sensors to provide the coverage of lightning flashes for the entire Guangdong Province, with a focus on the Guangzhou megacity area. The LD network de-tects positive and negative cloud-to-ground lightning with a positioning error of less than 1 km and measures the electric-ity current associated with each flash. The precipitation data are taken from 2000 rain gauges in a weather monitoring net-work of automatic weather (WP3103) stations, which mon-itor meteorological elements in real-time, including wind, pressure, rainfall, humidity, and etc. In addition, composite radar reflectivity data from five S-band 10 cm Doppler radars (Chinese CINRAD/SA) are used to validate the model simu-lation.
Although intensive measurements of aerosol properties (number concentration, size, and distribution, etc.) have been conducted in two major air quality field campaigns, i.e. PRIDE-PRD 2004 and 2008, long-term aerosol mea-surements have not continuously made in the region. In-stead, we consider observations of satellite aerosol optical depth (AOD) and visibility in the region as a proxy for pollu-tion condipollu-tions. High-resolupollu-tion (1-km) AOD at the 550 nm channel over the PRD area has been derived from MODIS by the Hong Kong University of Science and Technology (http://envf.ust.hk/); the derivative method has been previ-ously described by Li et al. (2005). The high-resolution AOD data has been validated by sunphotometer in the studies by Li (2005) and Tan (2009). Uncertainty in the MODIS AOD product has been reported to be about 20 %.
Atmospheric visibility is affected by many factors, such as absorbing gaseous pollutants and concentrations, distribu-tions and chemical composition of aerosols. In a homoge-neous atmosphere, the observed visibility (R) is correlated with the extinction coefficient (β)through the Koschmieder formula: R=3.91β−1 (Senfield and Pandis, 2006). Sev-eral previous studies have suggested that the PM amount is well correlated to visibility with a correlation coefficient of above 0.8 over the PRD area (Wu et al., 2005; Deng et al., 2008). Over the PRD area, visibility measurements are based on daily observations in 4 cities, including Guangzhou, Shen-zhen, Zengcheng, and Huiyang. The daily visibility value is averaged from four measurements per day. We have ex-cluded the days with precipitation in producing the statistics of the daily mean visibility. The number of low visibility days caused by light fog (relative humidity (RH)>90 %), which is also excluded from the present work, is less than 3 days per month over the PRD area since 2000, as previ-ously reported by Wu et al. (2007). It should be pointed out that the use of visibility as a proxy for the aerosol content has certain uncertainties. In particular, the aerosol optical prop-erties may also be dependent on the RH, since hygroscopic
aerosols will increase their size as RH increases (Zhang et al., 2008a). Nevertheless, RH measurements have been amined from 2000 to 2006 and the daily averaged RH (in ex-clusion of rainy and foggy days) typically ranged from 65 % to 70 %, indicating that the interannual variation of visibil-ity in the data cannot be explained by the variation of RH. Hence, the visibility results used in this study directly corre-late with the aerosol loading condition in the atmosphere.
As a fundamental component in the high-resolution cloud-resolving model, two-moment bulk microphysical parame-terizations have been widely utilized (Morrison et al., 2005; van den Heever et al., 2006; Lee et al., 2008), consider-ing their better representation of the hydrometeors spectrum, the advantage in investigation of the aerosol-cloud interac-tion compared with the single-moment bulk scheme, and more efficient computational performance than the spectral bin scheme. Li et al. (2008) implemented a two-moment bulk microphysics scheme into a three-dimensional cloud resolv-ing Weather Research and Forecastresolv-ing (CR-WRF) Model version 2.2.1, which is employed in the present work to in-vestigate the effects of aerosols on cloud and precipitation processes. A detailed description of the CR-WRF has been provided elsewhere (Li et al., 2008), and only the details pertinent to this present work are discussed here. Briefly, the number concentration and mass mixing ratio of five hy-drometeors, including cloud, rain, ice, snow, and graupel, are explicitly predicted in the scheme with the assumption of gamma size distribution (Mitchell et al., 1990). Thirty-four microphysical processes are considered in the scheme, including seven autoconversion parameterization options for the warm rain processes and three types of heterogeneous ice nucleation. In contrast to treating the number concentra-tion of cloud droplets or cloud condensaconcentra-tion nuclei (CCN) to be constant in many other two-moment bulk microphysical schemes, three new prognostic variables, i.e. number con-centration, surface area, and mass mixing ratio of aerosols, are implemented in this scheme. The process of aerosol acti-vation into cloud droplet is modeled using the classic K¨ohlar theory and the cloud number concentration is directly pre-dicted from aerosol concentration and ambient relative hu-midity. Under the assumption of a log-normal size distri-bution of aerosols, the model approach with forty-eight bins is used to depict the aerosol spectrum in the scheme. The performances of this microphysical scheme under different conditions have been evaluated and an inter-comparison with other available microphysical schemes in the WRF V2.2.1 has been reported previously (Li et al., 2008a, 2009). To our knowledge, there are rather few updates applied to the dynamic core of the WRF frame in version 2.2.1. Other updates, such as planetary boundary layer and land surface schemes, have limited impacts on the sensitivity study of aerosol-cloud interaction. To verify such an effect, we have implemented our microphysical scheme into WRF V3.1.1 and performed a simulation for the thunderstorm event con-sidered in this work. The results show that the cloud water
38
Fig. 1. (a)Annual mean AOD from the MODIS satellite in 2005 over southern China.(b)Annual mean CG flash density distribution in 2005 from the local lightning detection network in the Guang-dong Province.
path and precipitation exhibit consistency with the results predicted by version 2.2.1.
3 Results and discussions
3.1 Analysis of observations of precipitation, lightning flashes, and visibility
Measurements of precipitation, lightning flashes, and visibil-ity from 2000 to 2006 are analyzed to investigate the relation-ship between rainfall, lightning frequency, and aerosols over the PRD area. The high-resolution annual mean AOD from MODIS provides an overview of the aerosol distribution over the Guangdong Province. Figure 1a depicts the annual mean AOD in 2005, showing that the Guangzhou megacity area has a higher aerosol loading with the AOD value of larger than 0.6, compared with the vicinity of the PRD region, con-sistent with the previous studies (Wu et al., 2005).
Figure 1b displays the annual cloud-ground (CG) flash density distribution in 2005 over the Guangdong Province. The lightning flashes exhibit a high flash density in the Guangzhou megacity area, with the highest flash density of
39
Fig. 2. (a)Correlation between daily visibility and the heavy rain-fall rate over PRD from 2000 to 2006. Both daily visibility and heavy rainfall rate are averaged over the four-month period (from March to June). The heavy rainfall rate is calculated from each rain gauge station with a daily rainfall greater than 25 mm. The line represents a linear regression through all data. (b)Correlation between daily averaged visibility and accumulated lightning flash density (flashes km−2)during the four months from 2000 to 2006. The line represents a linear regression through all data.
Y. Wang et al.: Long-term impacts of aerosols on precipitation and lightning 12425
40
Fig. 3.Infrared images of clouds from the MTSAT satellite, showing the development of a frontal system in term of the brightness temperature variance of the cloud top.
anthropogenic pollution contributes to the occurrences of ex-treme weather events, including lightning and heavy rainfall. 3.2 Design of numerical simulations
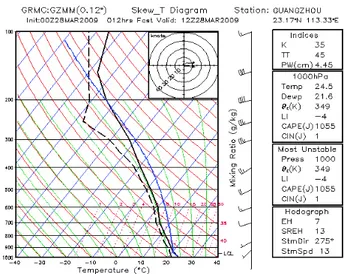
To further elucidate the effects of aerosols on cloud pro-cesses, precipitation, and lightning activity, simulations us-ing the CR-WRF model with the two-moment bulk micro-physical scheme are conducted. A mesoscale convective sys-tem over the PRD area associated with a cold frontal passage on 28 March 2009 is simulated in this study. Figure 3 shows infrared images of clouds from the Multi-functional Trans-port Satellite (MTSAT-1R), which is operated by the Japan Meteorological Agency to monitor the meteorological con-ditions in East Asia and West Pacific. The development of a frontal system is reflected by infrared images of clouds in term of the brightness temperature variance of the cloud top. At 05:00 UTC on 28 March, an embryonic convective cell appeared to the west of the Guangdong province. The con-vective system intensified and progressed eastwards, and at 09:00 UTC a mesoscale convective system swept through the PRD urban area. The extended planetary boundary layer due to the surface roughness and heat island effect in the urban region and high aerosol loading likely enforced the vertical motion of the system, responsible for the occurrence of the low brightness temperature (<65◦C). From the atmospheric sounding profile over Guangzhou city (23.2◦N, 113.3◦E), the CAPE was estimated to be 1055 J kg−1 at 00:00 UTC, exhibiting an unstable thermodynamic condition for thunder-storm initialization along the frontal boundary (Fig. 4).
41
Fig. 4.Atmospheric sounding in Guangzhou (113.33◦E, 23.17◦N) at 00:00 UTC on 28 March 2009. The black solid line corresponds to the temperature, and the black dash line represents the dew point temperature.
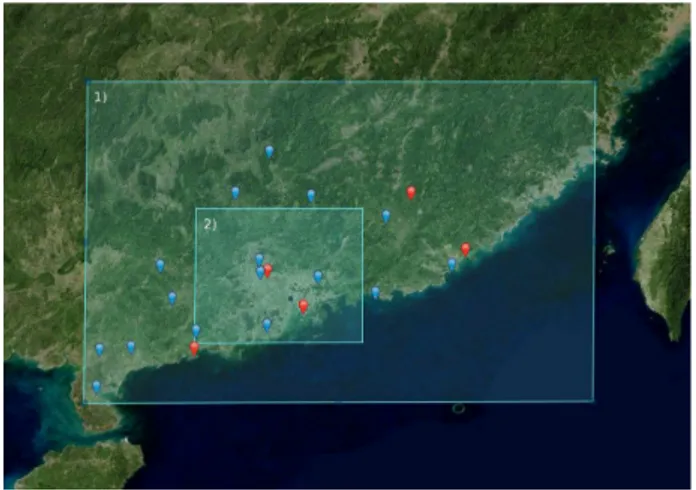
The CR-WRF model is configured by a two-way interac-tive nested domain with two meteorology input files from 18:00 UTC 27 March to 18:00 UTC 28 March, 2009. The outer domain has the size of 900 km×600 km with a 3 km horizontal resolution and is centered at (23.5◦N, 114◦E). The nested domain provides a finer resolution of 1 km and covers a 300 km×300 km area, centering at (22.8◦N,
113.5◦E), as illustrated in Fig. 6. The 1◦×1◦NCEP Final
Global Analyses data is used to establish the initial condi-tions and boundary condicondi-tions. To accurately represent city-scale surface physical processes over the urban groups in the PRD area, the Noah land surface model (LSM) coupled with the single-layer urban canopy model (Kusaka et al., 2001) is utilized in the CR-WRF simulation. The high-resolution land-use data from the Guangdong local Geographic Infor-mation System (GIS) database is adopted in the domain ini-tialization, considering the large impact of the urban land-use on the convection development (van den Heever and Cotton, 2006). The Yonsei University (YSU) scheme is used to pa-rameterize the boundary layer processes (Hong et al., 2006). No cumulus cloud parameterization is involved in the simu-lation.
To investigate the aerosol effect on thunderstorm and light-ning, we conduct sensitive experiments with two aerosol sce-narios: a polluted case (P-case) and clean case (C-case), on the basis of atmospheric measurements conducted in this re-gion (Zhang et al., 2008). Both cases contain two aerosol types, i.e. ammonium sulfate and sea salt. The identical dy-namics and thermodydy-namics settings in the sensitivity stud-ies preclude the impacts on the simulations from other fac-tors, such as large-scale dynamics, solar heating, and hu-midity sources. According to the K¨ohler equation used for aerosol activation in the model, the difference in the chem-ical composition of aerosols is equivalent to a correspond-ing change in the CCN effective radius (Khain et al., 2005). The polluted continental aerosols are assumed to mainly con-tain ammonium sulfate and the clean aerosols are assumed to be mainly sea salt (Senfield and Pandis, 2006). Hence, am-monium sulfate and sea salt represent dominantly the fine mode and coarse mode in the aerosol spectrum, respectively. Background ammonium sulfate over the continent in the P-case is initiated as an exponentially decreasing profile with the maximal number concentration of 2200 cm−3and a mass mixing ratio of 5.9 µg kg−1 at the surface, while the initial aerosol profile of ammonium sulfate in the C-case is smaller, with the maximum value of 220 cm−3, as shown in Fig. 6. The number concentration and mass mixing ratio of ammo-nium sulfate aerosol over the surface in the polluted case are constrained by field measurements from Liu (2008) and Liu (2007), respectively, in the field campaign PRIDE-PRD 2004. The exponential decreasing profile of aerosol verti-cal distribution is supported by aircraft measurement dur-ing PRIDE-PRD 2004 (Wang et al., 2008). The most re-cent analysis from high-resolution aerosol mass spectrome-ter (AMS) measurements (He et al., 2011) provides a similar mass concentration of ammonium sulfate to the value em-ployed in this study. The mass and number concentration of ammonium sulfate over the sea are assumed to be half of the values over the continent. To mimic urban aerosol pol-lution, a production rate of ammonium sulfate is assumed to be 0.5 µg kg−1h−1over the PRD metropolitan area (Fan et al., 2005; Zhang et al., 2008b). The background sea salt
42
Fig. 5. Domains considered in the model simulations. The outer domain (1) has the size of 900 km×600 km with a 3 km horizon-tal resolution and is centered at (23.5◦N, 114◦E). The inner do-main (2) provides a finer resolution of 1 km and covers a 300 km×
300 km area, with the center at (22.8◦N, 113.5◦E). The red sym-bols represent the radar stations, and the blue symsym-bols represent the lightning detection stations.
42
Fig. 6.Vertical profiles of the number concentrations of ammonium sulfate in the polluted (P-) and clean (C-) cases for model initializa-tion.
Y. Wang et al.: Long-term impacts of aerosols on precipitation and lightning 12427
Fig. 7. Comparison of radar reflectivity between observation and CR-WRF simulation for the P-case. (a)Observation at 09:00 UTC.(b) Simulation at 09:00 UTC.(c)Observation at 11:00 UTC.(d)Simulation at 11:00 UTC.
3.3 Radar reflectivity and precipitation
To derive the radar reflectivity, both the simulated mass and number concentration of raindrops, snow and graupel are considered to calculate the six-moment of hydrometeors, which is defined as the reflectivity factor. Comparison of radar reflectivity is made between model simulations and ob-servations from five S-band (10 cm) Doppler radars (the loca-tions of the radars are marked in Fig. 5). Figure 7 displays the measured and modeled distributions of the maximum radar reflectivity at two time periods. Comparison between the ob-servation and simulation exhibits a general agreement in the distributions and developments of the maximum radar reflec-tivity, showing a northeast-southwest orientated convective boundary along the frontal system. Most of the measured radar reflectivity along the frontal boundary is reproduced by the simulation. In particular, the simulation is consistent with the observation on the location of the reflectivity value of greater than 30 dBz, corresponding to the location of ac-tive convection development of the thunderstorm with heavy precipitation in the north of the PRD area between latitudes 23◦N and 23.5◦N.
Precipitation measurements from 2000 gauge stations in the Guangdong province are compared with the WRF sim-ulation. Figure 8 displays hourly rainfall rate horizontally averaged over the PRD area from the gauge measurements
44
Fig. 8. Temporal evolution of the domain-averaged rainfall rate. The red dashed line represents the gauge measurement, the blue solid line corresponds to the P-case, and the green solid line corre-sponds to the C-case.
and from simulations for the C-case and P-case. The simu-lated precipitation in the P- and C-cases occurs about one-hour earlier than the gauge measurement, but the precipita-tion rate reaches the peak value at 09:00 UTC in both sim-ulations and the measurement. The maximal rainfall rate in the P-case is consistent with the gauge measurement, with a value of 7.6 mm h−1at 09:00 UTC, while the peak rainfall rate of 6.5 mm h−1 is noticeably smaller in the C-case. It
45
Fig. 9.Comparison of accumulated precipitation from 09:00 to 15:00 UTC between observation and simulations.(a)Gauge measurements. (b)P-case.(c)C-case.
is interesting to note that, although the onset of precipitation between the P-case and C-case is similar, the P-case produces a larger maximal rainfall rate (by 14.5 %) than the C-case.
The enhancement in the surface rainfall is further evalu-ated through comparison of the spatial distribution of pre-cipitation. Figure 9 depicts the accumulated precipitation from UTC 09:00 to UTC 15:00 over the PRD area. Both the P-case and C-case reproduce the precipitation belt to the north part of the PRD area, while the coverage of the sim-ulated precipitation belts extend slightly to the south com-pared with the gauge measurement. A comparison between the P-case (Fig. 9b) and C-case (Fig. 9c) reveals that precip-itation increases in most parts of the region under the high aerosol loading. Note that the enhancement in precipitation is non-uniform over the entire domain. For instance, in the C-case the region with accumulated precipitation greater than 100 mm inside the main rain belt is slightly larger than that in the P-case. The non-uniform responses of precipitation to aerosol loading in different locations may be attributable to local inhomogeneous thermodynamic conditions (Ntelekos et al., 2009; Khain, 2009). In terms of the total accumulated rainfall integrated through the duration of the thunderstorm, the P-case and C-case produce 30.5 mm and 26.4 mm total precipitation, respectively, over the out domain. Both values are comparable with the corresponding gauge measurement of 27.9 mm, but the P-case yields a value of 16 % greater than that in the C-case. Hence, the model simulations reveal that elevated aerosol concentrations increase precipitation asso-ciated with the mesoscale convective system over the PRD area.
We examine the detailed precipitation response to aerosols by considering several distinct precipitation categories. The precipitation is categorized into four levels by the daily precipitation amount, i.e. light (<10 mm d−1), moderate (10–25 mm d−1), heavy (25–50 mm d−1)and extreme heavy (>50 mm d−1)rain. Figure 10 shows the percentage of the grid areas under a certain precipitation category over the en-tire model domain (a) and the percentage of the precipitation
46
Fig. 10.Probability distribution functions of the four different rain-fall categories, i.e. light (<10 mm d−1), moderate (10–25 mm d−1), heavy (25–50 mm d−1) and extreme heavy (>50 mm d−1) rain, simulated for the P- and C-cases. (a)Percentage of grid areas un-der a certain precipitation category over the entire model domain. (b)Percentage of the precipitation amount under a certain category over the total precipitation amount. Dark blue corresponds to the P-case, and red corresponds to the C-case.
Y. Wang et al.: Long-term impacts of aerosols on precipitation and lightning 12429 study by Qian et al. (2009), which suggested that heavy
pol-lution in China suppresses light rain on the basis of observa-tion and numerical modeling. Our results show that the heavy rain and extremely heavy rain are both enhanced in the total precipitation amount and in the geographic distribution for the P-case. Hence, the model simulations indicate that while elevated aerosol loading suppresses light and moderate pre-cipitation, but enhances heavy precipitation.
3.4 Lightning flashes and lightning potential index
Lightning occurrence and frequency are often considered as an important indicator of convective intensity, since charge separation and electrification of thunderstorms re-quire the co-existence and interaction of both supercooled liquid and ice crystals (Williams et al., 1991; Williams and Zhang, 1996). Mesoscale convective systems produce ground flashes by an average rate of 42 flashes min−1, which consists of about one-fourth of the annual lightning strikes globally (Goodman and MacGorman, 1986; Bond et al., 2001, 2002). Considering the complicated microphysical processes involved in the electrical field buildup and light-ning discharge, it is difficult to exactly represent the lightlight-ning occurrence in atmospheric models. In the present work, we evaluate the lightning activity associated with the mesoscale convective system on the basis of a lightning potential index (LPI), which has been developed by Yair et al. (2009). The LPI parameterizes the potential of charge generation and sep-aration in convective thunderstorm on the basis of the non-inductive graupel-ice mechanism, since there is a growing consensus that the occurrence of electrical charge transfer when graupel particles in the region of intense updraft collide with small ice crystal represents the dominant electrification mechanism in thunderstorms (Rakov and Uman, 2003). Un-der the assumption that the effective charge separation zone is between freezing level and −20◦C isotherms, determi-nation of LPI mainly involves the simulated vertical wind component, temperature field, and the mass mixing ratios of hydrometeors explicitly predicted from the microphysical scheme, i.e. LPI=1/V∫∫∫εw2dxdydz, whereεis decided by the partition of water content between liquid phase and ice phase. This method has been proved to be more accurate than other thermodynamic indices for lightning, such as the K-index and lifted index (Yair et al., 2009).
The temporal evolution of measured flashes from the lo-cal lightning detection network (the locations of the light-ning sensors are marked in Fig. 5) is shown in Fig. 11a, in-cluding both positive and negative flashes. Figure 11a indi-cates that positive flashes dominate over the negative flashes and the occurrence of lightning flashes reaches the peak at 09:00 UTC. The time dependence LPI averaged over PRD calculated under the P- and C-cases is shown in Fig. 11b. Compared to the C-case, the evolution of LPI in the P-case exhibits a better consistency with the measured lightning flashes over PRD. The value of calculated LPI for the P-case
47
Fig. 11.Temporal evolution of observed total CG lightning flashes (a)and calculated domain-averaged LPI(b). In(a)red denotes pos-itive flashes and dark blue denotes negative flashes. In(b), red de-notes the C-case and dark blue dede-notes the P-case.
and measured flashes are positive at 04:00 UTC, increase significantly after 07:00 UTC, and reach the peak around 09:00 UTC. In contrast, the predicted LPI for the C-case is noticeably delayed, compared to the P-case and measured lightning flashes. Over the entire thunderstorm duration LPI in the P-case is about 53 % higher than that in the C-case.
Figure 12 displays measured one-hour lightning flashes from 08:00 UTC to 09:00 UTC, along with the calculated LPI at 08:00 UTC in the two cases. The observation shows the highest frequency of lightning occurs to the west of Guangzhou City at 08:00 UTC and progressed slightly south-eastward at 09:00 UTC. The P-case reproduces this measured characteristics, showing that the area of the LPI values larger than 1.0 locates to the west of Guangzhou and migrates to the Guangzhou metropolitan and PRD area at 09:00 UTC. Such a feature, however, is absent from the calculated LPI for the C-case. It is also evident in Fig. 12 that there are discrep-ancies in the geographic distributions between the measured lightning activities and predicted LPI values to the northwest of PRD, which may be jointly explained by the limitation in the lightning detection system (which detects the cloud-to-ground flashes only), uncertainties in the model calculations, and the imperfect nature of the lightning potential parameter-ization.
48
Fig. 12. (a)Observed CG lightning distribution at 08:00 UTC.(b)Simulated LPI in the P-case at 08:00 UTC.(c)Simulated LPI in the C-case at 08:00 UTC.(d)Observed CG lightning distribution at 09:00 UTC.(e)Simulated LPI in the P-case at 09:00 UTC.(f)Simulated LPI in the C-case at 09:00 UTC.
3.5 Microphysical properties
We analyze the modeled microphysical properties under the different aerosol conditions to gain insights into the effects of aerosols on cloud development, precipitation, and lightning activity. Table 1 summarizes the domain-averaged micro-physical properties for the different hydrometeors. For the P-case, the number concentration of cloud droplets is much larger, but the effective radius of cloud droplets is smaller than those for the C-case. These differences in the properties of cloud droplets are a direct reflection of the aerosol condi-tion, since elevated aerosol loading leads to more numerous cloud droplets, but a smaller effective radius in the P-case. In addition, the number concentration of rain drops is slightly larger in the C-case, but the P-case corresponds to a much larger size for rain drops. Since a smaller effective radius of cloud droplets suppresses the collection/coalescence process to form raindrops, this likely explains the lower concentra-tion of rain drops in the P-case. The larger size of rain drops in the P-case is indicative of the contributions from melting graupel. It is also clear from Table 1 that the concentrations of ice crystals and snow are higher in the P-case, suggesting a
Table 1.Domain-averaged Properties of Hydrometeors.
Number Effective Concentration (103m−3) Radius (µm) C-case P-case C-case P-case
Cloud droplets 1354 7663 7.8 6.0 Rain drops 2.28 1.17 372.4 574.3 Ice Crystals 1.6 3.3 226.0 227.4 Snow 0.6 0.8 294.8 292.9 Graupel 2.0 1.2 445.4 660.6
hindered warm rain process, but an enhanced mixed process because of elevated aerosol loading.
Y. Wang et al.: Long-term impacts of aerosols on precipitation and lightning 12431
49
Fig. 13. Temporal evolution of the horizontally domain-summated mass mixing ratio of(a)cloud water in the C-case,(b)cloud water in P-case,(c)rain water in the C-case,(d)rain water in the P-case,(e)ice in the C-case,(f)ice in the P-case,(g)graupel in the C-case, and(h) graupel in the P-case.
initialized at 04:00 UTC in both P- and C-cases. This occurs since supersaturation occurs due to adiabatic cooling in the ascending air mass. The P-case yields considerably more liq-uid cloud water in the lower troposphere than the C-case; be-tween 06:00 and 14:00 UTC the amount of liquid cloud water in the P-case sustains higher than that in the C-case. For the P-case, more aerosols are activated into cloud droplets and more water vapor condenses onto cloud droplets in the P-case partially explaining the enhanced cloud water amount. Furthermore, a smaller effective radius of cloud droplets and suppressed collection/coalescence processes lead to a less ef-ficient sedimentation for smaller cloud droplets and a pro-longed condensation process in the atmosphere. Clearly, the more abundant cloud water in the P-case resulting in a larger release of latent heat from droplet condensation, invigorat-ing the convective development, to be discussed later. The enhanced cloud water above the freezing level (around 4 km) in the P-case is explained because of enhanced convection and smaller cloud droplets, which are easier to be lifted up. More supercooled water and enhanced convection promote the mixed-phase processes. Consequently, ice and graupel mass mixing ratios in the P-case are significantly increased compared to those in the C-case, as shown in Fig. 13e–f. Figure 13e shows that the region with ice crystals extends vertically to a higher altitude, indicating an elevated cloud top height. The maximum ice content is located above the
−40◦C level, implying that homogeneous freezing of super-cooled droplets represents a dominant mechanism for ice ini-tiation.
It is interesting to note that there is relatively little differ-ence in the rainwater amount between the C-case (Fig. 13c) and P-case (Fig. 13d). Such a behavior is rather surprising, since it is anticipated that there will be less rainwater due to suppressed collection/coalescence processes in the P-case. However, the less efficient conversion from cloud droplets to rain drops may be compensated by melting of graupel gen-erated from the enhanced ice-phase process. As discussed above, the contribution of melting graupel to rainwater is supported by the predicted larger size of rain drops (Table 1) in the P-case. In addition, a larger size of hydrometeors im-plies a better chance to survive evaporation during sedimen-tation below the cloud bottom, explaining the intense rain-fall period between 09:00 and 11:00 UTC at the ground level (0 km in the figure). Also, there is an insignificant difference in the rainfall onset, despite of the suppressed warm rain pro-cess in the P-case.
3.6 Convective strength
Strong updraft (>10 m s−1), which is characteristic of thun-derstorms in the developing and mature stages, represents a dominant factor in the formation of heavy precipitation and lightning (Rakov and Uman, 2005; Williams et al., 1991). We evaluate the vertical convection strength under different aerosol conditions to investigate the aerosols effect on cloud
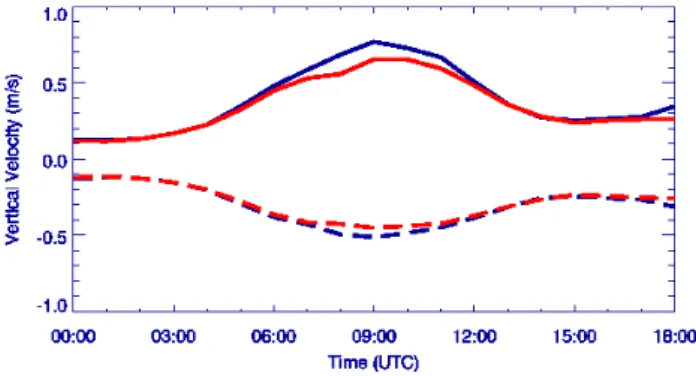
50
Fig. 14. Averaged column maximum vertical velocity. The solid lines represent the updraft and the dashed lines represent the down-draft. The dark blue lines represent the P-case and the red lines represent the C-case.
dynamics. Figure 14 shows the time series of the column maximum updraft and downdraft. The maximum upward and downward velocities are calculated at each column and averaged over the entire domain. It is evident from Fig. 14 that the variations in the updraft and downdraft are always in phase and both velocities reach the peak at 09:00 UTC. The updraft and downdraft velocities are larger in the P-case. The cross section of the vertical velocity at 10:00 UTC (Fig. 15) reveals more details on the differences in convection devel-opment between the two cases. The region with the up-draft velocities greater than 10 m s−1(between 112.8◦E and
113.0◦E) is significantly more prominent in the P-case than
in the C-case. Figure 15 also reveals that the patterns and locations of the maximal updraft velocity exhibit noticeable differences between the two cases, indicating that an alter-ation of the structure and development of the convection sys-tem by aerosols.
Y. Wang et al.: Long-term impacts of aerosols on precipitation and lightning 12433
Fig. 15.Latitudinal cross section of vertical velocity at 10:00 UTC:(a)C-case and(b)P-case.
Replace Fig. 16 with the new one:
Fig. 16.Temporal evolution of latent heat profiles:(a)C-case and(b)P-case.
4 Conclusions
In this work, we present an analysis of long-term mea-surements of precipitation, visibility, and lightning in the Pearl River Delta (PRD) region, China, with a focus on the Guangzhou megacity area. Measurements of precipitation, lightning flashes, and visibility from 2000 to 2006 in this re-gion are analyzed to assess the impacts of aerosols on cloud and precipitation processes. The statistical analysis shows that both heavy rainfall and lightning flashes over PRD are inversely correlated with visibility, with the correlation co-efficients of−0.739 and−0.506, respectively. The results suggest that a large lightning flash density and a heavy rain-fall amount in the PRD area may be correlated with atmo-spheric aerosol loading and local anthropogenic pollution contributes to the occurrences of extreme weather events, in-cluding lightning and heavy rainfall.
To further elucidate the effects of aerosols on cloud pro-cesses, precipitation, and lightning activity, the CR-WRF model with a two-moment bulk microphysical scheme is em-ployed to simulate a mesoscale convective system occurring
on 28 Match 2009 in the Guangzhou megacity area. Compar-ison between observations and model simulations exhibits a general agreement in the distributions and developments of the maximum radar reflectivity. Most of the measured radar reflectivity along the frontal boundary is reproduced by the simulation, in particular, the location of the most active con-vection development of the thunderstorm. The modeled max-imal rainfall rate and spatial distribution of precipitation are also in agreement with measurements from rain gauges over this region.
Model sensitivity experiments reveal that elevated aerosol concentrations increase precipitation associated with the mesoscale convective system over the PRD area. The sim-ulations suggest that the total precipitation is enhanced by about 16 % under the polluted aerosol condition. The results also reveal that elevated aerosol loading suppresses light and moderate precipitation (less than 25 mm per day), but en-hances heavy precipitation (greater than 25 mm per day).
The LPI is considered to evaluate the lightning activity associated with the mesoscale convective system. The cal-culated LPI exhibits a temporal and spatial consistence with lightning flashes recorded by the local LD network. The sim-ulations suggest that LPI is enhanced by about 50 % under the polluted aerosol condition.
An analysis of the microphysical properties of hydrome-teors indicates that elevated aerosol loading yields more nu-merous cloud droplets, but a smaller effective radius, lead-ing to a suppressed collection/coalescence process, but an enhanced mixed process. The model predicts considerably more cloud water in the lower troposphere for the polluted case, but indicates relatively little difference in the rainwa-ter under different aerosol conditions. This larainwa-ter behavior may be explained by the fact that a less efficient conversion from cloud droplets to rain drops is compensated by melting of graupel generated from the enhanced ice-phase process under the polluted aerosol condition. The model predicts a larger size of raindrops under the polluted aerosol condition, further supporting the contribution to rainwater from melt-ing graupel. The maximum ice content is located above the
−40◦C level, implying that homogeneous freezing of super-cooled droplets represents a dominant mechanism for ice ini-tiation.
During the developing and mature stages of the mesoscale convective system, the latent heat release in the middle tro-posphere is enhanced under the polluted aerosol condition, because of a more efficient and prolonged condensation pro-cess, but the cold pool relevant to evaporative cooling is largely unaffected by the aerosol loading. Such a distribu-tion of latent heat release may destabilize the atmosphere and enhance convection.
It should be pointed out that in the present work we have simplified the aerosol conditions as clean and polluted cases, both containing ammonium sulfate and sea salt but with different concentrations. The complex aerosol chemistry, including the effects of water-soluble organics (Yu, 2000; Zhao et al., 2006, 2009), was not treated in the CCN ac-tivation scheme, because of the computational limitation in the present CR-WRF framework and extremely complicated conditions of aerosols in the real atmosphere in terms of the diverse chemical species and their ability to form CCN. Also, the impacts of black carbon aerosols may be important on the regional climate change over PRD (Yu et al., 2001). Exten-sive experimental work and field measurements are required to develop computational efficient parameterizations to ac-count for the effects of aerosol compositions on CCN activa-tion and the direct radiative forcing on cloud dynamics and regional climate by absorbing aerosols. In addition, further modeling experiments are needed to examine the impacts of aerosols on different types of convective systems in the PRD area, such as typhoons which also contribute to heavy rainfall and lightning formation.
Acknowledgements. Y. W. acknowledged the support by an NASA Graduate Student Fellowship in Earth System Science. This research was partially supported by National Depart-ment Public Benefit Research Foundation of China (Grant No. GYHY200706014).
Edited by: A. Baklanov
References
Altaratz, O.: Simulation of the electrification of winter thunder-clouds using the three-dimensional Regional Atmospheric Mod-eling System (RAMS) model: Single cloud simulations, J. Geo-phys. Res., 110, D20205, doi:10.1029/2004jd005616, 2005. Bond, D. W., Zhang, R., Tie, X., Brasseur, G., Huffines, G., Orville,
R. E., and Boccippio D. J.: NOxproduction by lightning over the
continental United States, J. Geophys. Res., 106, 27701–27709, 2001.
Bond, D. W., Steiger, S., Zhang, R., Tie, X., and Orville, R. E.: The importance of NOxproduction by lightning in the tropics,
Atmos. Environ., 36, 1509–1519, 2002.
Deng, X., Tie, X., Wu, D., Zhou, X., Bi, X., Tan, H., Li, F., and Jiang, C.: Long-term trend of visibility and its characterizations in the Pearl River Delta (PRD) region, China, Atmos. Environ., 42, 1424–1435, doi:10.1016/j.atmosenv.2007.11.025, 2008. Fan, J., Zhang, R., Li, G., Nielsen-Gammon, J., and Li, Z.:
Sim-ulations of fine particulate matter (PM2.5)in Houston, Texas, J.
Geophys. Res., 110, D16203, doi:10.1029/2005JD005805, 2005. Fan, J., Zhang, R., Li, G., and Tao, W.-K.: Effects of aerosols and relative humidity on cumulus clouds, J. Geophys. Res., 112, D14204, doi:10.1029/2006jd008136, 2007.
Fan, J., Zhang, R., Tao, W.-K., and Mohr, K.: Effects of aerosol op-tical properties on deep convective clouds and radiative forcing, J. Geophys. Res., 113, D08209, doi:10.1029/2007JD009257, 2008.
Fan, J., Yuan, T., Comstock, J. M., Ghan, S., Khain, A., Le-ung, L. R., Li, Z., Martins, V. J., and Ovchinnikov, M.: Dom-inant role by vertical wind shear in regulating aerosol effects on deep convective clouds, J. Geophys. Res., 114, D22206, doi:10.1029/2009jd012352, 2009.
Farias, W. R. G., Pinto Jr., O., Naccarato, K. P., and Pinto, I. R. C. A.: Anomalous lightning activity over the Metropolitan Region of S˜ao Paulo due to urban effects, Atmos. Res., 91, 485–490, doi:10.1016/j.atmosres.2008.06.009, 2009.
Goodman, S. J. and MacGorman, D. R.: Cloud-to-Ground Lightning Activity in Mesoscale Convective Complexes, Mon. Weather Rev., 114, 2320–2328, 1986.
He, L. Y., Huang, X. F., Xue, L., Hu, M., Lin, Y., Zheng, J., Zhang, R. Y., and Zhang, Y. H.: Submicron aerosol analysis and organic source apportionment in an urban atmosphere in Pearl River Delta of China using high-resolution aerosol mass spectrome-try, J. Geophys. Res., 116, D12304, doi:10.1029/2010jd014566, 2011.
Hong, S.-Y., Noh, Y., and Dudhia, J.: A New Vertical Diffusion Package with an Explicit Treatment of Entrainment Processes, Mon. Weather Rev., 134, 2318–2341, 2006.
Y. Wang et al.: Long-term impacts of aerosols on precipitation and lightning 12435
Jiang, H., Xue, H., Teller, A., Feingold, G., and Levin, Z.: Aerosol effects on the lifetime of shallow cumulus, Geophys. Res. Lett., 33, L14806, doi:10.1029/2006gl026024, 2006.
Kar, S., Liou, Y., and Ha, K.: Aerosol effects on the enhancement of cloud-to-ground lightning over major ur-ban areas of South Korea, Atmos. Res., 92, 80–87, doi:10.1016/j.atmosres.2008.09.004, 2009.
Khain, A., Cohen, N., Lynn, B., and Pokrovsky, A.: Pos-sible Aerosol Effects on Lightning Activity and Struc-ture of Hurricanes, J. Atmos. Sci., 65, 3652–3677, doi:10.1175/2008jas2678.1, 2008.
Khain, A., Rosenfeld, D., and Pokrovsky, A.: Aerosol impact on the dynamics and microphysics of deep convective clouds, Q. J. Roy. Meteorol. Soc., 131, 2639–2663, doi:10.1256/qj.04.62, 2005. Khain, A. P.: Notes on state-of-the-art investigations of aerosol
ef-fects on precipitation: a critical review, Environ. Res. Lett., 4, 015004, doi:10.1088/1748-9326/4/1/015004, 2009.
Kusaka, H., Kondo, H., Kikegawa, Y., and Kimura, F.: A Sim-ple Single-Layer Urban Canopy Model For Atmospheric Mod-els: Comparison With Mutli-layer and Slab Models, Bound.-Lay. Meteorol., 101, 329–358, 2010.
Lau, K. M., Kim, M. K., and Kim, K. M.: Asian summer monsoon anomalies induced by aerosol direct forcing: the role of the Ti-betan Plateau, Clim. Dynam., 26, 855–864, doi:10.1007/s00382-006-0114-z, 2006.
Lee, S. S., Donner, L. J., and Penner, J. E.: Thunderstorm and stratocumulus: how does their contrasting morphology affect their interactions with aerosols?, Atmos. Chem. Phys., 10, 6819– 6837, doi:10.5194/acp-10-6819-2010, 2010.
Lee, S. S., Donner, L. J., Phillips, V. T. J., and Ming, Y.: The de-pendence of aerosol effects on clouds and precipitation on cloud-system organization, shear and stability, J. Geophys. Res., 113, D16202, doi:10.1029/2007jd009224, 2008.
Lei, W. and R. Zhang, Theoretical study of hydroxy-isoprene alkoxy radicals and their decomposition pathways, J. Phys. Chem., 105, 3808–3815, 2001.
Li, C., Lau, A. K.-H., Mao, J., and Chu, D. A.: Retrieval, Valida-tion, and Application of the 1-km Aerosol Optical Depth From MODIS Measurements Over Hong Kong, IEEE T. Geosci. Re-mote, 43, 2650–2658, 2005.
Li, G., Wang, Y., and Zhang, R.: Implementation of a two-moment bulk microphysics scheme to the WRF model to inves-tigate aerosol-cloud interaction, J. Geophys. Res., 113, D15211, doi:10.1029/2007jd009361, 2008a.
Li, G., Wang, Y., Lee, K.-H., Diao, Y., and Zhang, R.: Increased winter precipitation over the North Pacific from 1984-1994 to 1995-2005 inferred from the global precipita-tion climatology project, Geophys. Res. Lett., 35, L13821, doi:10.1029/2008GL034668, 2008b.
Li, G., Wang, Y., Lee, K.-H., Diao, Y., and Zhang, R.: Im-pacts of aerosols on the development and precipitation of a mesoscale squall line, J. Geophys. Res., 114, D17205, doi:10.1029/2008jd011581, 2009.
Liu, S., Hu, M., Slanina, S., He, L. Y., Niu, Y. W., Bruegemann, E., Gnauk, T., and Herrmann, H.: Size distribution and source analysis of ionic compositions of aerosols in polluted periods at Xinken in Pearl River Delta (PRD) of China, Atmos. Environ., 42, 6284–6295, doi:10.1016/J.Atmosenv.2007.12.035, 2008. Liu, S., Hu, M., Wu, Z. J., Wehner, B., Wiedensohler, A.,
and Cheng, Y. F.: Aerosol number size distribution and new particle formation at a rural/coastal site in Pearl River Delta (PRD) of China, Atmos. Environ., 42, 6275–6283, doi:10.1016/J.Atmosenv.2008.01.063, 2008.
Ma, M.: Climatological distribution of lightning density observed by satellites in China and its circumjacent regions, Science in China Series D, 48, 219–229, doi:10.1360/03yd0204, 2005. Mansell, E. R., Ziegler, C. L., and Bruning, E. C.:
Sim-ulated Electrification of a Small Thunderstorm with Two-Moment Bulk Microphysics, J. Atmos. Sci., 67, 171–194, doi:10.1175/2009jas2965.1, 2010.
Mitchell, D. L., Zhang, R., and Pitter, R. L.: The Mass-Dimensional Relations for Ice Crystals and the Influence of Riming on the Snowfall Rate, J. Appl. Meteorol. Climatol., 29, 153–163, 1990. Molina, M. J., Molina, L. T., Zhang, R., Meads, R., and Spencer, D.: Heterogeneous reaction of ClONO2 with HCl on aluminum oxide, Geophys. Res. Lett., 24, 1619–1622, 1997.
Morrison, H., Curry, J. A., and Khvorostyanov, V. I.: A New Double-Moment Microphysics Parameterization for Application in Cloud and Climate Models. Part I: Description, J. Atmos. Sci., 62, 1665–1677, 2005.
Naccarato, K. P.: Evidence of thermal and aerosol effects on the cloud-to-ground lightning density and polarity over large urban areas of Southeastern Brazil, Geophys. Res. Lett., 30, 1674, doi:10.1029/2003gl017496, 2003.
Ntelekos, A. A., Smith, J. A., Donner, L., Fast, J. D., Gustafson, W. I., Chapman, E. G., and Krajewski, W. F.: The effects of aerosols on intense convective precipitation in the northeast-ern United States, Q. J. Roy. Meteorol. Soc., 135, 1367–1391, doi:10.1002/qj.476, 2009.
Orville, R. E., Huffines, G., Nielsen-Gammon, J., Zhang, R., Ely, B., Steiger, S. M., Phillips, S., Allen, S., and Read, W.: En-hancement of Cloud-to-Ground Lightning over Houston, Texas, Geophys. Res. Lett., 28, 2597–2600, 2001.
Qian, Y., Gong, D., Fan, J., Leung, L. R., Bennartz, R., Chen, D., and Wang, W.: Heavy pollution suppresses light rain in China: Observations and modeling, J. Geophys. Res., 114, D00K02, doi:10.1029/2008jd011575, 2009.
Rakov, V. A. and Uman, M. A.: Lightning: Physics and Effects, Cambridge Uniersity Press, 2003.
Ramanathan, V.: Aerosols, Climate, and the Hydrological Cycle, Science, 294, 2119–2124, doi:10.1126/science.1064034, 2001. Seifert, A. and Beheng, K. D.: A two-moment cloud microphysics
parameterization for mixed-phase clouds. Part 2: Maritime vs. continental deep convective storms, Meteorol. Atmos. Phys., 92, 67–82, doi:10.1007/s00703-005-0113-3, 2005.
Seinfeld, J. H. and Pandis, S. N.: Atmospheric Chemistry and Physics: From Air Pollution to Climate Change John Wiley & Sons, Inc., 2006.
Sugimoto, N., Nishizawa, T., Liu, X., Matsui, I., Shimizu, A., Zhang, Y., Kim, Y. J., Li, R., and Liu, J.: Continuous Observa-tions of Aerosol Profiles with a Two-Wavelength Mie-Scattering Lidar in Guangzhou in PRD2006, J. Appl. Meteorol. Climatol., 48, 1822–1830, doi:10.1175/2009jamc2089.1, 2009.
Suh, I., Lei, W., and Zhang. R.: Experimental and theoretical stud-ies of isoprene reaction with NO3, J. Phys. Chem., 105, 6471–
6478, 2001.
Tan, H., Wu, D., Deng, X., Bi, X., Li, F., and Deng, T.: Observation of aerosol optical depth over the Pearl River Delta, Acta Scientiae
Circumstantiae, 29, 1146–1155, 2009.
Tao, W.-K., Li, X., Khain, A., Matsui, T., Lang, S., and Simpson, J.: Role of atmospheric aerosol concentration on deep convective precipitation: Cloud-resolving model simulations, J. Geophys. Res., 112, D24S18, doi:10.1029/2007jd008728, 2007.
Tie, X., Madronich, S., Walters, S., Zhang, R., Rasch, P., and Collins, W.: Effect of clouds on photolysis and ox-idants in the troposphere, J. Geophys. Res., 108, 4642, doi:10.1029/2003JD003659, 2003.
van den Heever, S. C., and Cotton, W. R.: Urban Aerosol Impacts on Downwind Convective Storms, J. Appl. Meteorol. Climatol., 46, 828–850, doi:10.1175/jam2492.1, 2007.
Wang, L., Khalizov, A. F., Zheng, J., Xu, W., Lal, V., Ma, Y., and Zhang R.: Atmospheric nanoparticles formed from het-erogeneous reactions of organics, Nature Geosci., 3, 238–242, doi:10.1038/ngeo778, 2010.
Wang, W., Ren, L. H., Zhang, Y. H., Chen, J. H., Liu, H. J., Bao, L. F., Fan, S. J., and Tang, D. G.: Aircraft mea-surements of gaseous pollutants and particulate matter over Pearl River Delta in China, Atmos. Environ., 42, 6187–6202, doi:10.1016/J.Atmosenv.2008.06.001, 2008.
Westcott, N. E.: Summertime Cloud-to-Ground Lightning Activity around Major Midwestern Urban Areas, J. Appl. Meteorol., 34, 1633–1642, 1995.
Williams, E.: Contrasting convective regimes over the Amazon: Im-plications for cloud electrification, J. Geophys. Res., 107, 8082, doi:10.1029/2001jd000380, 2002.
Williams, E. and Zhang, R.: The density of rime in laboratory simu-lations of thunderstorm microphysics and electrification, J. Geo-phys. Res., 101, 29715–29719, 1996.
Williams, E., Zhang, R., and Rydock, J.: Mixed Phase Micro-physics and Cloud Electrification, J. Atmos. Sci., 48, 2195–2203, 1991.
Williams, E., Zhang, R., and Boccippio, D.: The microphysical growth state of ice particles and the large scale electric structure of electrified clouds, J. Geophys. Res., 99, 10787–10792, 1994. Wu, D., Bi, X., Deng, X., Li, F., Tan, H., Liao, G., and Huang,
J.: Effect of Atmospheric Haze on the Deterioration of Visibility over the Pearl River Delta Acta Meteorological Sinica, 21, 2007. Wu, D., Tie, X., Li, C., Ying, Z., Kai-Hon Lau, A., Huang, J., Deng, X., and Bi, X.: An extremely low visibility event over the Guangzhou region: A case study, Atmos. Environ., 39, 6568– 6577, doi:10.1016/j.atmosenv.2005.07.061, 2005.
Yair, Y., Lynn, B., Price, C., Kotroni, V., Lagouvardos, K., Morin, E., Mugnai, A., and Llasat, M. d. C.: Predicting the potential for lightning activity in Mediterranean storms based on the Weather Research and Forecasting (WRF) model dy-namic and microphysical fields, J. Geophys. Res., 115, D04205, doi:10.1029/2008jd010868, 2010.
Yi, Y., Yang, Z., Wan, Q., and Meng, W.: Temporal/Spatial Char-acteristics and Climatological Variation of Thunderstorm and Lightning Over the Past 50 Years in Guangdong, Journal of Trop-ical Meteorology, 22, 539–546, 2006.
Yu, S.: Role of organic acids (formic, acetic, pyruvic and oxalic) in the formation of cloud condensation nuclei (CCN): a review, Atmos. Res., 53, 185–217, 2000.
Yu, S., Saxena, V. K., and Zhao, Z.: A comparison of signals of regional aerosol-induced forcing in eastern China and the south-eastern United States, Geophys. Res. Lett., 28, 713–716, 2001. Yuan, T., Li, Z., Zhang, R., and Fan, J.: Increase of
cloud droplet size with aerosol optical depth: An observa-tion and modeling study, J. Geophys. Res., 113, D04201, doi:10.1029/2007JD008632, 2008.
Zhang, R., Leu, M. T., and Molina, M. J.: Formation of polar strato-spheric clouds on preactivated background aerosols, Geophys. Res. Lett., 23, 1669–1672, 1996.
Zhang, D., Zhang, R., Park, J., and North, S. W.: Hydroxyperoxy nitrites and nitrates from OH initiated reactions of isoprene, Jour-nal of the American Chemical Society, 124, 9600–9605, 2002a. Zhang, D., Lei, W., and Zhang, R.: Mechanism of OH formation
from ozonolysis of isoprene: Kinetics and product yields, Chem. Phys. Lett., 358, 171–179, 2002b.
Zhang, R.: Getting to the critical nucleus of aerosol formation, Sci-ence, 328, 1366–1367, doi:10.1126/science.1189732, 2010. Zhang, R., Lei, W., Tie, X., and Hess, P.: Industrial emissions cause
extreme diurnal urban ozone variability, P. Natl. Acad. Sci., 101, 6346–6350, 2004.
Zhang, R., Suh, I., Zhao, J., Zhang, D., Fortner, E. C., Tie, X., Molina, L. T., and Molina, M. J.: Atmospheric new particle for-mation enhanced by organic acids, Sciences, 304, 1487–1490, 2004.
Zhang, R., Li, G., Fan, J., Wu, D. L., and Molina, M. J.: Intensifi-cation of Pacific storm track linked to Asian pollution, P. Natl. Acad. Sci., 104, 5295–5299, doi:10.1073/pnas.0700618104, 2007.
Zhang, R. Y., Khalizov, A. F., Pagels, J., Zhang, D., Xue, H. X., and McMurry, P. H.: Variability in morphology, hygro-scopicity, and optical properties of soot aerosols during atmo-spheric processing, P. Natl. Acad. Sci. USA, 105, 10291–10296, doi:10.1073/Pnas.0804860105, 2008.
Zhang, Y. H., Hu, M., Zhong, L. J., Wiedensohler, A., Liu, S. C., Andreae, M. O., Wang, W., and Fan, S. J.: Regional Inte-grated Experiments on Air Quality over Pearl River Delta 2004 (PRIDE-PRD2004): Overview, Atmos. Environ., 42, 6157– 6173, doi:10.1016/j.atmosenv.2008.03.025, 2008.
Zhao, J., Levitt, N. P., Zhang, R., and Chen, J.: Heterogeneous reactions of methylglyoxal in acidic media: Implications for sec-ondary organic aerosol formation, Environ. Sci. Technol., 40, 7682–7687, 2006.