www.soil-journal.net/2/615/2016/ doi:10.5194/soil-2-615-2016
© Author(s) 2016. CC Attribution 3.0 License.
SOIL
Deriving pedotransfer functions for soil quartz fraction in
southern France from reverse modeling
Jean-Christophe Calvet, Noureddine Fritz, Christine Berne, Bruno Piguet, William Maurel, and Catherine Meurey
CNRM, UMR 3589 (Météo-France, CNRS), Toulouse, France
Correspondence to:Jean-Christophe Calvet ([email protected])
Received: 20 May 2015 – Published in SOIL Discuss.: 26 June 2015
Revised: 13 November 2016 – Accepted: 23 November 2016 – Published: 9 December 2016
Abstract. The quartz fraction in soils is a key parameter of soil thermal conductivity models. Because it is dif-ficult to measure the quartz fraction in soils, this information is usually unavailable. This source of uncertainty impacts the simulation of sensible heat flux, evapotranspiration and land surface temperature in numerical simu-lations of the Earth system. Improving the estimation of soil quartz fraction is needed for practical applications in meteorology, hydrology and climate modeling. This paper investigates the use of long time series of routine ground observations made in weather stations to retrieve the soil quartz fraction. Profile soil temperature and water content were monitored at 21 weather stations in southern France. Soil thermal diffusivity was derived from the temperature profiles. Using observations of bulk density, soil texture, and fractions of gravel and soil organic matter, soil heat capacity and thermal conductivity were estimated. The quartz fraction was inversely estimated using an empirical geometric mean thermal conductivity model. Several pedotransfer functions for estimating quartz content from gravimetric or volumetric fractions of soil particles (e.g., sand) were analyzed. The soil volumetric fraction of quartz (fq) was systematically better correlated with soil characteristics than the gravimetric fraction of quartz. More than 60 % of the variance offqcould be explained using indicators based on the sand fraction. It was shown that soil organic matter and/or gravels may have a marked impact on thermal conductivity values depending on which predictor offqis used. For the grassland soils examined in this study, the ratio of sand-to-soil organic matter fractions was the best predictor offq, followed by the gravimetric fraction of sand. An error propagation analysis and a comparison with independent data from other tested models showed that the gravimetric fraction of sand is the best predictor offqwhen a larger variety of soil types is considered.
1 Introduction
Soil moisture is the main driver of temporal changes in val-ues of the soil thermal conductivity (Sourbeer and Loheide II, 2015). The latter is a key variable in land surface models (LSMs) used in hydrometeorology or in climate models for the simulation of the vertical profile of soil temperature in re-lation to soil moisture (Subin et al., 2013). Shortcomings in soil thermal conductivity models tend to limit the impact of improving the simulation of soil moisture and snowpack in LSMs (Lawrence and Slater, 2008; Decharme et al., 2016). Models of the thermal conductivity of soils are affected by uncertainties, especially in the representation of the impact of soil properties such as the volumetric fraction of quartz
(fq), soil organic matter and gravels (Farouki, 1986; Chen et al., 2012). As soil organic matter (SOM) and gravels are often neglected in LSMs, the soil thermal conductivity mod-els used in most LSMs represent the mineral fine earth, only. Nowadays,fq estimates are not given in global digital soil maps, and it is often assumed that this quantity is equal to the fraction of sand (Peters-Lidard et al., 1998).
by uncertainties (Peters-Lidard et al., 1998; Tarnawski et al., 2012). The construction and the verification of theλmodels is not easy. Theλvalues of undisturbed soils are difficult to observe directly. They are often measured in the lab on per-turbed soil samples (Abu-Hamdeh and Reeder, 2000; Lu et al., 2007). Although recent advances in line-source probe and heat pulse methods have made it easier to monitor soil ther-mal conductivity in the field (Bristow et al., 1994; Zhang et al., 2014), such measurements are currently not made in op-erational meteorological networks. Moreover, for given soil moisture conditions,λdepends to a large extent on the frac-tion of soil minerals presenting high thermal conductivities such as quartz, hematite, dolomite or pyrite (Côté and Kon-rad, 2005). In midlatitude regions of the world, quartz is the main driver ofλ. The information on quartz fraction in a soil is usually unavailable as it can only be measured using X-ray diffraction (XRD) or X-ray fluorescence (XRF) techniques. These techniques are difficult to implement because the sen-sitivity to quartz is low. In practise, using XRD and XRF to-gether is necessary to improve the accuracy of the measure-ments (Schönenberger et al., 2012). This lack of observations has a major effect on the accuracy of thermal conductivity models and their applications (Bristow, 1998).
Most of the land surface models (LSMs) currently used in meteorology and hydrometeorology simulateλfollowing the approach proposed by Peters-Lidard et al. (1998). This ap-proach consists of an updated version of the Johansen (1975) model and assumes that the gravimetric fraction of quartz (Q) is equal to the gravimetric fraction of sand within min-eral fine earth. This is a strong assumption, as some sandy soils (e.g., calcareous sands) may contain little quartz and as quartz may be found in the silt and clay fractions of the soil minerals (Schönenberger et al., 2012). Moreover, theλ mod-els used in most LSMs represent only the mineral fine earth. Yang et al. (2005) and Chen et al. (2012) have shown the im-portance of accounting for SOM and gravels inλmodels for organic top soil layers of grasslands of the Tibetan plateau.
The main goals of this study are to (1) assess the feasibil-ity of using routine automatic soil temperature profile sub-hourly measurements (one observation every 12 min) to re-trieve instantaneous soil thermal diffusivity values at a depth of 0.10 m; (2) retrieve instantaneous λvalues from the soil thermal diffusivity estimates, accounting for the impact of soil vertical heterogeneities; (3) obtain, from reverse model-ing, the quartz fraction together with soil thermal conductiv-ity at saturation (λsat); (4) assess the impact of gravels and SOM onλsat; (5) derive pedotransfer functions for the soil quartz fraction.
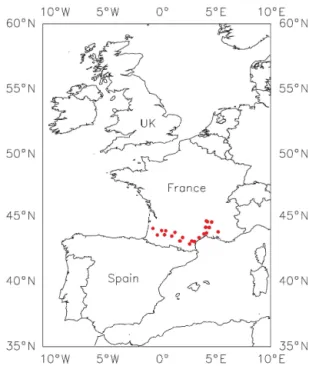
For this purpose, we use the data from 21 weather sta-tions of the Soil Moisture Observing System – Meteorolog-ical Automatic Network Integrated Application (SMOSMA-NIA) network (Calvet et al., 2007) in southern France. The soil temperature and the soil moisture probes are buried in the enclosure around each weather station. Most of these stations are located in agricultural areas. However, the vegetation
Figure 1.Location of the 21 SMOSMANIA stations in southern France (see station names in Supplement 1).
cover in the enclosure around the stations consists of grass. Along the Atlantic–Mediterranean transect formed by the SMOSMANIA network (Fig. 1), the grassland cover frac-tion ranges between 10 and 40 % (Zakharova et al., 2012). Various mineral soil types can be found along this transect, ranging from sand to clay and silt loam (see Supplement 1). During the installation of the probes, we collected soil sam-ples which were used to determine soil characteristics: soil texture, soil gravel content, soil organic matter and bulk den-sity.
Using this information together with soil moisture,λ val-ues are derived from soil thermal diffusivity and heat capac-ity. The response ofλ to soil moisture is investigated. The feasibility of modeling theλ value at saturation (λsat) with or without using SOM and gravel fraction observations is as-sessed using a geometric mean empirical thermal conductiv-ity model based on Lu et al. (2007). The volumetric fraction of quartz,fq, is retrieved by reverse modeling together with Q. Pedotransfer functions are further proposed for estimating quartz content from soil texture information.
2 Data and methods
2.1 The SMOSMANIA data
The SMOSMANIA network was developed by Calvet et al. (2007) in southern France. The main purposes of SMOS-MANIA are to (1) validate satellite-derived soil moisture products (Parrens et al., 2012); (2) assess land surface mod-els used in hydrological modmod-els (Draper et al., 2011) and in meteorological models (Albergel et al., 2010); and (3) mon-itor the impact of climate change on water resources and droughts (Laanaia et al., 2016). The station network forms a transect between the Atlantic coast and the Mediterranean sea (Fig. 1). It consists of preexisting automatic weather stations operated by Météo-France, upgraded with four soil moisture probes at four depths: 0.05, 0.10, 0.20 and 0.30 m. Twelve SMOSMANIA stations were activated in 2006 in southwestern France. In 2008, nine more stations were in-stalled along the Mediterranean coast, and the whole net-work (21 stations) was gradually equipped with tempera-ture sensors at the same depths as soil moistempera-ture probes. The soil moisture and soil temperature probes consisted of ThetaProbe ML2X and PT100 sensors, respectively. Soil moisture and soil temperature observations were made ev-ery 12 min at four depths. The soil temperature observations were recorded with a resolution of 0.1◦C.
In this study, the sub-hourly measurements of soil tem-perature and soil moisture at a depth of 0.10 m were used, together with soil temperature measurements at 0.05 and 0.20 m from 1 January 2008 to 30 September 2015.
The ThetaProbe soil moisture sensors provide a voltage signal (V). In order to convert the voltage signal into vol-umetric soil moisture content (m3m−3), site-specific cali-bration curves were developed using in situ gravimetric soil samples for all stations and for all depths (Albergel et al., 2008). We revised the calibration in order to avoid spurious high soil moisture values during intense precipitation events. Logistics curves were used (see Supplement 1) instead of ex-ponential curves in the previous version of the data set.
The observations from the soil moisture (48) and from the temperature (48) probes are automatically recorded ev-ery 12 min. The data are available to the research commu-nity through the International Soil Moisture Network web site (https://ismn.geo.tuwien.ac.at/).
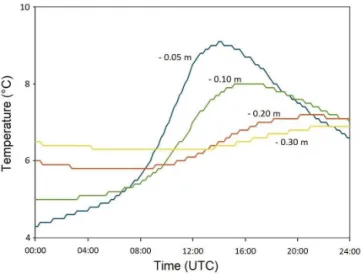
Figure 2 shows soil temperature time series in wet con-ditions at various soil depths for a station presenting an in-termediate value of λsat (Table 2) and of soil texture (see Fig. S1.1 in Supplement 1). The impact of recording tem-perature with a resolution of 0.1◦C is clearly visible at all
depths as this causes a leveling of the curves.
2.2 Soil characteristics
In general, the stations are located on formerly cultivated fields and the soil in the enclosure around the stations is
cov-Figure 2.Soil temperature measured in wet conditions at the St-Félix-Lauragais (SFL) station on 23 February 2015 at depths of 0.05, 0.10, 0.20 and 0.30 m. Leveling is due to the low resolution of the temperature records (0.1◦C).
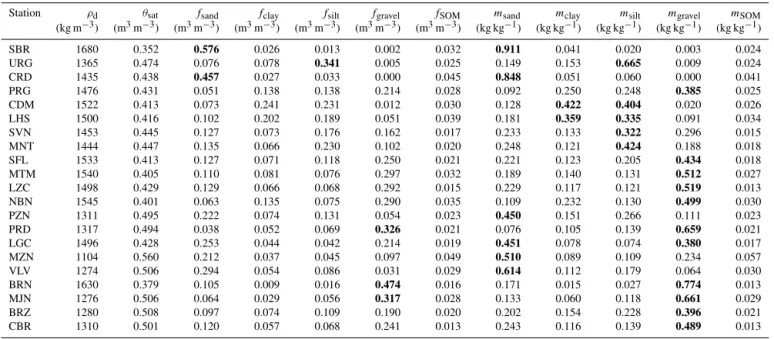
ered with grass. Soil properties were measured at each station by an independent laboratory we contracted (INRA-Arras) from soil samples we collected during the installation of the probes. The 21 stations cover a very large range of soil tex-ture characteristics. For example, SBR is located on a sandy soil, PRD on a clay loam, and MNT on a silt loam (Table 1 and Supplement 1). Other properties such as the gravimet-ric fraction of SOM and of gravels were determined from the soil samples. Table 1 shows that 12 soils present a volumetric gravel content (fgravel) larger than 15 %. Among these, three soils (at PRD, BRN and MJN) havefgravelvalues larger than 30 %.
In addition, we measured bulk density (ρd) using undisturbed oven-dried soil samples we collected using metal cylinders of known volume (about 7×10⁻⁴m3; see Fig. S1.10 in the Supplement).
The porosity values at a depth of 0.10 m are listed in Ta-ble 1 together with gravimetric and volumetric fractions of soil particle-size ranges (sand, clay, silt, gravel) and SOM. The porosity, or soil volumetric moisture at saturation (θsat), is derived from the bulk dry densityρd, with soil texture and soil organic matter observations as
θsat=1−ρd m
sand+mclay+msilt+mgravel
ρmin
+mSOM ρSOM
or
θsat=1−fsand−fclay−fsilt−fgravel−fSOM, (1)
wheremx (fx) represents the gravimetric (volumetric)
frac-tion of the soil componentx. Thefxvalues are derived from
the measured gravimetric fractions, multiplied by the ratio of
ρdobservations toρx, the density of each soil componentx.
Table 1.Soil characteristics at 10 cm for the 21 stations of the SMOSMANIA network. Porosity values are derived from Eq. (1). Solid fraction values higher than 0.3 are in bold. The stations are listed from west to east (from top to bottom).ρd,θsat,fandmstand for soil bulk density, porosity, volumetric fractions and gravimetric fractions, respectively. Soil particle fractions larger than 0.3 are in bold. Full station names are given in Supplement 1 (Table S1.1).
Station ρd θsat fsand fclay fsilt fgravel fSOM msand mclay msilt mgravel mSOM
(kg m−3) (m3m−3) (m3m−3) (m3m−3) (m3m−3) (m3m−3) (m3m−3) (kg kg−1) (kg kg−1) (kg kg−1) (kg kg−1) (kg kg−1)
SBR 1680 0.352 0.576 0.026 0.013 0.002 0.032 0.911 0.041 0.020 0.003 0.024
URG 1365 0.474 0.076 0.078 0.341 0.005 0.025 0.149 0.153 0.665 0.009 0.024
CRD 1435 0.438 0.457 0.027 0.033 0.000 0.045 0.848 0.051 0.060 0.000 0.041
PRG 1476 0.431 0.051 0.138 0.138 0.214 0.028 0.092 0.250 0.248 0.385 0.025
CDM 1522 0.413 0.073 0.241 0.231 0.012 0.030 0.128 0.422 0.404 0.020 0.026
LHS 1500 0.416 0.102 0.202 0.189 0.051 0.039 0.181 0.359 0.335 0.091 0.034
SVN 1453 0.445 0.127 0.073 0.176 0.162 0.017 0.233 0.133 0.322 0.296 0.015
MNT 1444 0.447 0.135 0.066 0.230 0.102 0.020 0.248 0.121 0.424 0.188 0.018
SFL 1533 0.413 0.127 0.071 0.118 0.250 0.021 0.221 0.123 0.205 0.434 0.018
MTM 1540 0.405 0.110 0.081 0.076 0.297 0.032 0.189 0.140 0.131 0.512 0.027
LZC 1498 0.429 0.129 0.066 0.068 0.292 0.015 0.229 0.117 0.121 0.519 0.013
NBN 1545 0.401 0.063 0.135 0.075 0.290 0.035 0.109 0.232 0.130 0.499 0.030
PZN 1311 0.495 0.222 0.074 0.131 0.054 0.023 0.450 0.151 0.266 0.111 0.023
PRD 1317 0.494 0.038 0.052 0.069 0.326 0.021 0.076 0.105 0.139 0.659 0.021
LGC 1496 0.428 0.253 0.044 0.042 0.214 0.019 0.451 0.078 0.074 0.380 0.017
MZN 1104 0.560 0.212 0.037 0.045 0.097 0.049 0.510 0.089 0.109 0.234 0.057
VLV 1274 0.506 0.294 0.054 0.086 0.031 0.029 0.614 0.112 0.179 0.064 0.030
BRN 1630 0.379 0.105 0.009 0.016 0.474 0.016 0.171 0.015 0.027 0.774 0.013
MJN 1276 0.506 0.064 0.029 0.056 0.317 0.028 0.133 0.060 0.118 0.661 0.029
BRZ 1280 0.508 0.097 0.074 0.109 0.190 0.020 0.202 0.154 0.228 0.396 0.021
CBR 1310 0.501 0.120 0.057 0.068 0.241 0.013 0.243 0.116 0.139 0.489 0.013
2.3 Retrieval of soil thermal diffusivity
The soil thermal diffusivity (Dh) is expressed in m2s−1and is defined as
Dh= λ Ch
. (2)
We used a numerical method to retrieve instantaneous values ofDhat a depth of 0.10 m using three soil temperature obser-vations at 0.05 m, 0.10 and 0.20 m, performed every 12 min, by solving the Fourier thermal diffusion equation. The latter can be written as
Ch ∂T ∂t = ∂ ∂z λ∂T ∂z . (3)
Given that soil properties are relatively homogeneous in the vertical (Sect. 2.1), values of Dh can be derived from the Fourier one-dimensional law:
∂T
∂t =Dh ∂2T
∂z2. (4)
However, large differences in soil bulk density, from the top soil layer to deeper soil layers, were observed for some soils (see Supplement 1). In order to limit this effect as much as possible, we only used the soil temperature data presenting a relatively low vertical gradient close to the soil surface, where most differences with deeper layers are found. This data sorting procedure is described in Supplement 2.
Given that three soil temperaturesTi (iranging from 1 to
3) are measured at depthsz1= −0.05 m,z2= −0.10 m and
z3= −0.20 m, the soil diffusivityDhi atzi=z2= −0.10 m can be obtained by solving the one-dimensional heat equa-tion, using a finite-difference method based on the implicit Crank–Nicolson scheme (Crank and Nicolson, 1996). When three soil depths are considered (zi−1,zi,zi+1), the change in soil temperatureTi at depthzi, from timetn−1to timetn,
within the time interval1t=tn−tn−1, can be written as
Tin−Tin−1
1t =Dhi
h1 2
γn
i+1−γ
n i 1zm +1 2
γin+−11−γin−1 1zm
! i
, with
γin=T
n i −T
n i−1 1zi
, 1zm=
1zi+1zi+1 2
and1zi=zi−zi−1. (5) In this study,1zi = −0.05 m,1zi+1= −0.10 m and a value of1t=2880 s (48 min) are used.
It is important to ensure that Dh retrievals are related to diffusion processes only and not to the transport of heat by water infiltration or evaporation (Parlange et al., 1998; Schelde et al., 1998). Therefore, only situations for which changes in soil moisture at all depths do not exceed 0.001 m3m−3within the1ttime interval are considered.
depth of 0.10 m, using the de Vries (1963) mixing model. TheChvalues, in units of J m−3K−1, are calculated as
Ch=θ Ch water+fminCh min+fSOMCh SOM, (6)
whereθandfminrepresent the volumetric soil moisture and the volumetric fraction of soil minerals, respectively. Values of 4.2×10⁶, 2.0×10⁶and 2.5×10⁶J m−3K−1are used for Ch water,Ch minandCh SOM, respectively.
Theλvalues at 0.10 m are then derived from theDhand Chestimates (Eq. 2).
2.5 Soil thermal conductivity model
Various approaches can be used to simulate thermal conduc-tivity of unsaturated soils (Dong et al., 2015). We used an empirical approach based on thermal conductivity values in dry conditions and at saturation.
In dry conditions, soils present low thermal conductivity values (λdry). Experimental evidence shows thatλdryis neg-atively correlated with porosity. For example, Lu et al. (2007) give
λdry=0.51−0.56×θsat(in W m−1K−1). (7)
When soil pores are gradually filled with water, λ tends to increase towards a maximum value at saturation (λsat). Be-tween dry and saturation conditions,λis expressed as
λ=λdry+Ke λsat−λdry, (8)
whereKeis the Kersten number (Kersten, 1949). The latter is related to the volumetric soil moisture,θ, i.e., to the degree of saturation (Sd). We used the formula recommended by Lu et al. (2007):
Ke=expnα1−Sd(α−1.33)o,
with α=0.96 for Mnsand≥0.4 kg kg−1, α=0.27 for Mnsand<0.4 kg kg−1and
Sd=θ/θsat. (9)
Mnsandrepresents the sand mass fraction of mineral fine earth (values are given in Supplement 1).
The geometric mean equation for λsat proposed by Jo-hansen (1975) for the mineral components of the soil can be generalized to include the SOM thermal conductivity (Chen et al., 2012) as
ln (λsat)=fqln λq+fotherln (λother)+θsatln (λwater)
+fSOMln (λSOM), (10)
where fq is the volumetric fraction of quartz, and λq=7.7 W m−1K−1, λwater=0.594 W m−1K−1 and λSOM=0.25 W m−1K−1 are the thermal conductivi-ties of quartz, water and SOM, respectively. The λother
term corresponds to the thermal conductivity of soil minerals other than quartz. Following Peters-Lidard et al. (1998),λother is taken as 2.0 W m−1K−1 for soils with Mnsand>0.2 kg kg−1 and as 3.0 W m−1K−1 otherwise. In this study, Mnsand>0.2 kg kg−1 for all soils, except for URG, PRG and CDM. The volumetric fraction of soil minerals other than quartz is defined as
fother=1−fq−θsat−fSOM, with
fq=Q×(1−θsat). (11)
2.6 Reverse modeling
Theλsatvalues are retrieved through reverse modeling using theλmodel described above (Eqs. 7–11). This model is used to produce simulations ofλat the same soil moisture condi-tions as those encountered for theλvalues derived from ob-servations in Sect. 2.4. For a given station, a set of 401 simu-lations is produced forλsatranging from 0 to 4 W m−1K−1, with a resolution of 0.01 W m−1K−1. Theλsatretrieval cor-responds to theλsimulation presenting the lowest root mean square difference (RMSD) value with respect to theλ obser-vations. Onlyλobservations forSdvalues higher than 0.4 are used because in dry conditions: (1) conduction is not the only mechanism for heat exchange in soils, as the convective wa-ter vapor flux may become significant (Schelde et al., 1998; Parlange et al., 1998); (2) theKefunctions found in the liter-ature display more variability; and (3) theλsatretrievals are more sensitive to uncertainties inλobservations. The thresh-old value ofSd=0.4 results from a compromise between the need of limiting the influence of convection, of the shape of theKefunction on the retrieved values ofλsat, and of using as many observations as possible in the retrieval process. More-over, the data filtering technique to limit the impact of soil heterogeneities, described in Supplement 2, is used to select validλobservations.
Finally, thefqvalue is derived from the retrievedλsat solv-ing Eq. (10).
2.7 Scores
Pedotransfer functions for quartz andλsatare evaluated using the following scores:
– the Pearson correlation coefficient (r) and the squared correlation coefficient (r2) are used to assess the frac-tion of explained variance
– the RMSD
– the mean absolute error (MAE), i.e., the mean of abso-lute differences
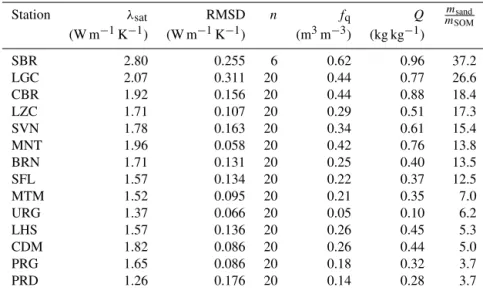
Table 2.Thermal properties of 14 grassland soils in southern France:λsat,fqandQretrievals using theλmodel (Eqs. 7–9 and 10) for degree of saturation values higher than 0.4, together with the minimized RMSD between the simulated and observedλvalues and the number of used
λobservations (n). The soils are sorted from the largest to the smallest ratio ofmsandtomSOM. Full station names are given in Supplement 1 (Table S1.1).
Station λsat RMSD n fq Q mmSOMsand
(W m−1K−1) (W m−1K−1) (m3m−3) (kg kg−1)
SBR 2.80 0.255 6 0.62 0.96 37.2
LGC 2.07 0.311 20 0.44 0.77 26.6
CBR 1.92 0.156 20 0.44 0.88 18.4
LZC 1.71 0.107 20 0.29 0.51 17.3
SVN 1.78 0.163 20 0.34 0.61 15.4
MNT 1.96 0.058 20 0.42 0.76 13.8
BRN 1.71 0.131 20 0.25 0.40 13.5
SFL 1.57 0.134 20 0.22 0.37 12.5
MTM 1.52 0.095 20 0.21 0.35 7.0
URG 1.37 0.066 20 0.05 0.10 6.2
LHS 1.57 0.136 20 0.26 0.45 5.3
CDM 1.82 0.086 20 0.26 0.44 5.0
PRG 1.65 0.086 20 0.18 0.32 3.7
PRD 1.26 0.176 20 0.14 0.28 3.7
In order to test the predictive and generalization power of the pedotransfer regression equations, a simple bootstrapping re-sampling technique is used. It consists of calculating a new estimate offq for each soil using the pedotransfer function obtained without using this specific soil. Gathering these new
fqestimates, one can calculate new scores with respect to the retrieved fq values. Also, this method provides a range of possible values of the coefficients of the pedotransfer func-tion and permits assessing the influence of a given fq re-trieval on the final result.
3 Results
3.1 λsatandfqretrievals
Retrievals ofλsatandfqcould be obtained for 14 soils. Fig-ure 3 shows retrieved and modeledλvalues against the ob-served degree of saturation of the soil, at a depth of 0.10 m for contrasting retrieved values ofλsat, from high to low val-ues (2.80, 1.96, 1.52 and 1.26 W m−1K−1) at the SBR, MNT, MTM and PRD stations, respectively.
All the obtainedλsatandfqretrievals are listed in Table 2, together with theλRMSD values and the number of selected
λobservations. For three soils (CRD, MZN and VLV), the re-verse modeling technique described in Sect. 2.6 could not be applied as not enoughλobservations could be obtained for
Sd values higher than 0.4. For four soils (NBN, PZN, BRZ and MJN), all the λ retrievals were filtered out as the ob-tained values were influenced by heterogeneities in soil den-sity (see Supplement 2). For the other 14 soils,λsatandfq retrievals were obtained using a subset of 20λretrievals per soil, at most, corresponding to the soil temperature data
pre-senting the lowest vertical gradient close to the soil surface (Supplement 2).
3.2 Pedotransfer functions for quartz
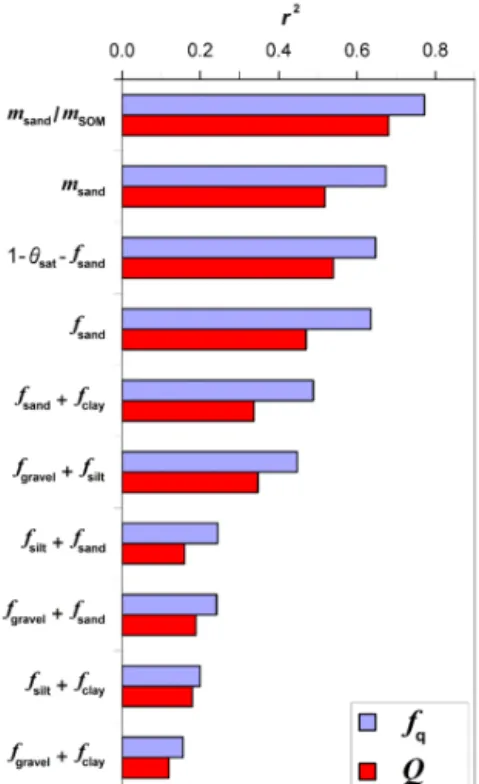
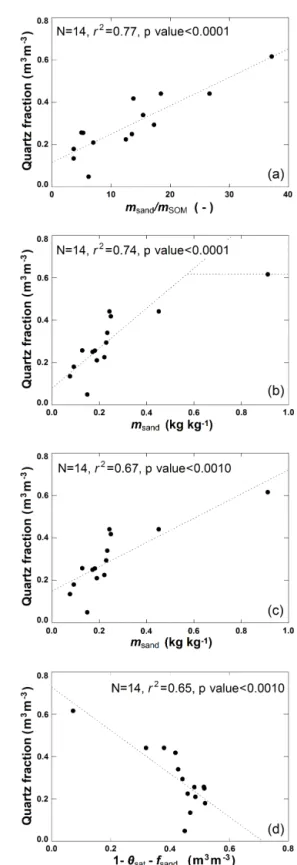
Thefqretrievals can be used to assess the possibility of esti-matingfqusing other soil characteristics, which can be eas-ily measured. Another issue is whether volumetric or gravi-metric fraction of quartz should be used. Figure 4 presents the fraction of variance (r2) ofQandfqexplained by vari-ous indicators. A key result is thatfqis systematically better correlated with soil characteristics thanQ. More than 60 % of the variance offqcan be explained using indicators based on the sand fraction (eitherfsandormsand). The use of other soil mineral fractions does not give good correlations, even when they are associated to the sand fraction as shown by Fig. 4. For example, thefgravelandfgravel+fsandindicators present lowr2values of 0.04 and 0.24, respectively.
The fq values cannot be derived directly from the indi-cators as illustrated by Fig. 5: assumingfq=fsandtends to markedly underestimateλsat. Therefore, more elaborate pe-dotransfer equations are needed. They can be derived from the best indicators, using them as predictors offq. The mod-eledfqis written as
fqMOD=a0+a1×P and
fqMOD≤1−θsat−fSOM, (12)
whereP represents the predictor offq.
Figure 3.Retrievedλvalues (dark dots) vs. the observed degree of saturation of the soil at a depth of 0.10 m for (from top to bottom) Sabres (SBR), Montaut (MNT), Mouthoumet (MTM) and Prades-le-Lez (PRD), together with simulated λ values from dry to wet conditions (dark lines).
Figure 4.Fraction of variance (r2) of gravimetric and volumetric fraction of quartz (Qandfq, red and blue bars, respectively) ex-plained by various predictors.
Figure 5.λsat MODvalues derived from volumetric quartz fractions fqassumed equal tofsand, using observedθsatvalues, vs.λsat re-trievals.
SBR sandy soil has the largest individual impact on the ob-tained regression coefficients. This is why the scores without SBR are also presented in Table 4.
Table 3.Coefficients of four pedotransfer functions offq(Eq. 12) for 14 soils of this study (all withmsand/mSOM<40), together with indicators of the coefficient uncertainty, derived by bootstrapping and by perturbing the volumetric heat capacity of soil minerals (Ch min). The best predictor is in bold.
Predictor offq Coefficients for 14 soils Confidence interval Impact of a change of from bootstrapping ±0.08×10⁶J m−3K−1
inCh min
a0 a1 a0 a1 a0 a1
msand/mSOM 0.12 0.0134 [0.10, 0.14] [0.012, 0.014] [0.11, 0.13] [0.013, 0.013]
m∗sand 0.08 0.944 [0.00, 0.11] [0.85, 1.40] [0.07, 0.09] [0.919, 0.966]
msand 0.15 0.572 [0.08, 0.17] [0.54, 0.94] [0.14, 0.17] [0.55, 0.56] 1−θsat−fsand 0.73 −1.020 [0.71, 0.89] [−1.38,−0.99] [0.70, 0.73] [−1.00,−0.99]
∗Onlym
sandvalues smaller than 0.6 kg kg−1are used in the regression.
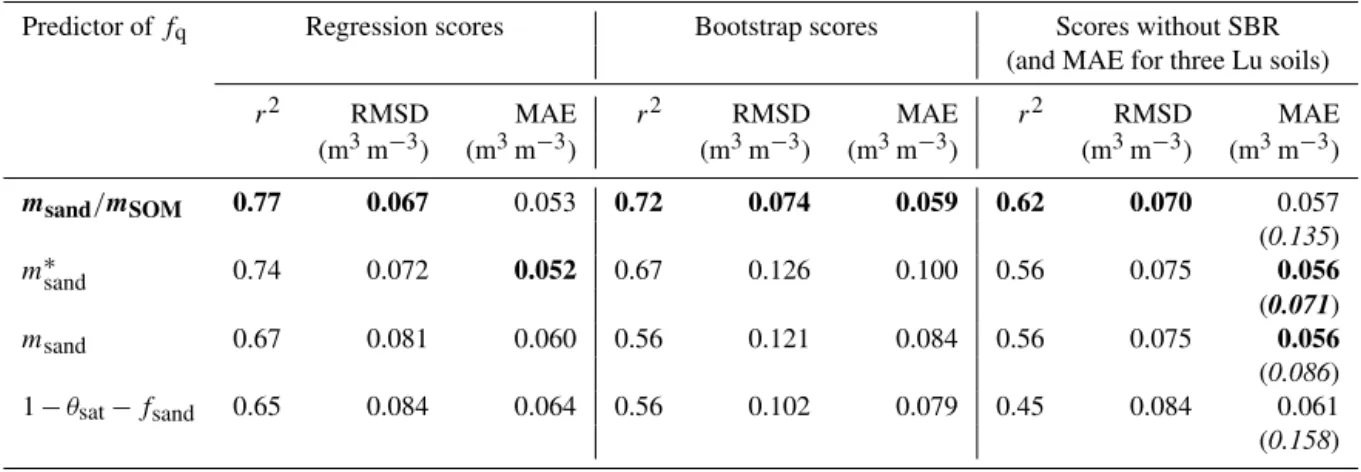
Table 4.Scores of four pedotransfer functions offqfor 14 soils of this study, together with the scores obtained by bootstrapping, without the sandy SBR soil. The MAE score of these pedotransfer functions for three Chinese soils of Lu et al. (2007) for whichmsand/mSOM<40 is given (within brackets and in italics). The best predictor and the best scores are in bold.
Predictor offq Regression scores Bootstrap scores Scores without SBR (and MAE for three Lu soils)
r2 RMSD MAE r2 RMSD MAE r2 RMSD MAE
(m3m−3) (m3m−3) (m3m−3) (m3m−3) (m3m−3) (m3m−3)
msand/mSOM 0.77 0.067 0.053 0.72 0.074 0.059 0.62 0.070 0.057
(0.135)
m∗sand 0.74 0.072 0.052 0.67 0.126 0.100 0.56 0.075 0.056
(0.071)
msand 0.67 0.081 0.060 0.56 0.121 0.084 0.56 0.075 0.056
(0.086) 1−θsat−fsand 0.65 0.084 0.064 0.56 0.102 0.079 0.45 0.084 0.061 (0.158)
∗Onlym
sandvalues smaller than 0.6 kg kg−1are used in the regression.
a1=0.944, againsta1=0.572 with SBR). For SBR,fq is overestimated by the m∗sand equation, but this is corrected by thefqMOD limitation of Eq. (12), and in the end a bet-ter r2 score is obtained when the 14 soils are considered (r2=0.74).
Values of r2larger than 0.7 are obtained for two predic-tors offq:msand/mSOM andm∗sand. A value ofr2=0.65 is obtained for 1−θsat−fsand(the fraction of soil solids other than sand). The msand/mSOMpredictor presents the bestr2 and RMSD scores in all the configurations (regression, boot-strap and regression without SBR). Another characteristic of themsand/mSOMpedotransfer function is that the confidence interval for thea0anda1coefficients derived from bootstrap-ping is narrower than for the other pedotransfer functions (Table 3), indicating a more robust relationship of fq with msand/mSOMthan with other predictors.
An alternative way to evaluate the quartz pedotransfer functions is to compare the simulatedλsatwith the retrieved values presented in Table 2. Modeled values ofλsat(λsat MOD) can be derived fromfqMODusing Eq. (10) together withθsat
observations. Theλsat MODr2, RMSD and mean bias scores are given in Table 5. Again, the best scores are obtained using themsand/mSOMpredictor offq, withr2, RMSD and mean bias values of 0.86, 0.14 W m−1K−1and+0.01 W m−1K−1, respectively (Fig. 7).
Finally, we investigated the possibility of estimatingθsat from the soil characteristics listed in Table 1 and of deriving a statistical model forθsat (θsatMOD). We found the follow-ing statistical relationship betweenθsatMOD,mclay,msilt and mSOM:
θsatMOD=0.456−0.0735 mclay
msilt
+2.238mSOM (13)
(r2=0.48, F test p value=0.0027, RMSD= 0.036 m3m−3).
Volumetric fractions of soil components need to be con-sistent withθsatMODand can be calculated using the modeled bulk density values derived fromθsatMODusing Eq. (1).
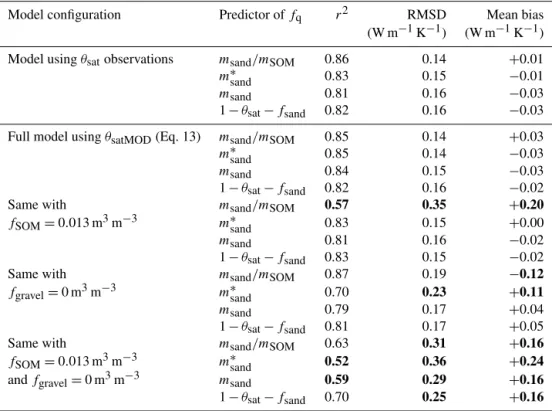
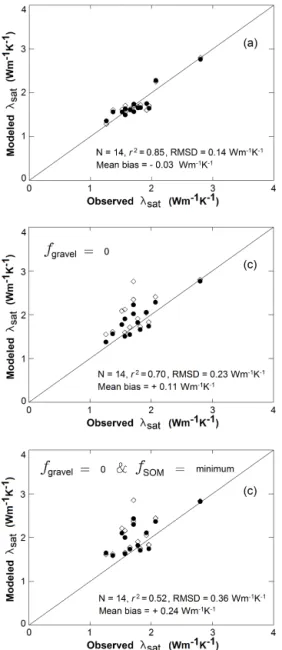
in-Table 5. Ability of the Eqs. (10)–(13) empirical model to estimateλsatvalues for 14 soils and impact of changes in gravel and SOM volumetric content:fgravel=0 m3m−3andfSOM=0.013 m3m−3(the smallestfSOMvalue, observed for CBR).r2values smaller than 0.60, RMSD values higher than 0.20 W m−1K−1and mean bias values higher (smaller) than+0.10 (−0.10) are in bold.
Model configuration Predictor offq r2 RMSD Mean bias (W m−1K−1) (W m−1K−1)
Model usingθsatobservations msand/mSOM 0.86 0.14 +0.01
m∗sand 0.83 0.15 −0.01
msand 0.81 0.16 −0.03
1−θsat−fsand 0.82 0.16 −0.03
Full model usingθsatMOD(Eq. 13) msand/mSOM 0.85 0.14 +0.03
m∗sand 0.85 0.14 −0.03
msand 0.84 0.15 −0.03
1−θsat−fsand 0.82 0.16 −0.02
Same with msand/mSOM 0.57 0.35 +0.20
fSOM=0.013 m3m−3 m∗sand 0.83 0.15 +0.00
msand 0.81 0.16 −0.02
1−θsat−fsand 0.83 0.15 −0.02
Same with msand/mSOM 0.87 0.19 −0.12
fgravel=0 m3m−3 m∗sand 0.70 0.23 +0.11
msand 0.79 0.17 +0.04
1−θsat−fsand 0.81 0.17 +0.05
Same with msand/mSOM 0.63 0.31 +0.16
fSOM=0.013 m3m−3 m∗sand 0.52 0.36 +0.24
andfgravel=0 m3m−3 msand 0.59 0.29 +0.16
1−θsat−fsand 0.70 0.25 +0.16
∗Onlym
sandvalues smaller than 0.6 kg kg−1are used in the regression.
stead of theθsatobservations has little impact on theλsat MOD scores.
3.3 Impact of gravels and SOM onλsat
Gravels and SOM are often neglected in soil thermal con-ductivity models used in LSMs. The Eqs. (10)–(13) empiri-cal model obtained in Sect. 3.2 permits the assessment of the impact offgravelandfSOMonλsat. Table 5 shows the impact onλsat MOD scores of imposing a null value offgraveland a small value offSOMto all the soils. The combination of these assumptions is evaluated, also.
Imposing fSOM=0.013 m3m−3 (the smallest fSOM value, observed for CBR) has a limited impact on the scores, except for the msand/mSOM pedotransfer function. In this case, λsat is overestimated by +0.20 W m−1K−1 and r2 drops to 0.57.
Neglecting gravels (fgravel=0 m3m−3) also has a limited impact but triggers the underestimation (overestimation) of
λsat for the msand/mSOM (m∗sand) pedotransfer function by −0.12 W m−1K−1(+0.11 W m−1K−1).
On the other hand, it appears that combining these assump-tions has a marked impact on all the pedotransfer funcassump-tions. Neglecting gravels and imposingfSOM=0.013 m3m−3has a major impact on λsat: the modeled λsat is overestimated by all the pedotransfer functions (with a mean bias
rang-ing from+0.16 to +0.24 W m−1K−1) and r2 is markedly smaller, especially for themsandandm∗sandpedotransfer func-tions. These results are illustrated in Fig. 8 in the case of the
m∗sand pedotransfer function. Figure 8 also shows that using theθsatobservations instead ofθsatMOD(Eq. 13) has little im-pact onλsat MOD (Sect. 3.2) but tends to enhance the impact of neglecting gravels. A similar result is found with themsand pedotransfer function (not shown).
4 Discussion
4.1 Can uncertainties in heat capacity estimates impact retrievals ?
In this study, the de Vries (1963) mixing model is applied to estimate soil volumetric heat capacity (Eq. 6), and a fixed value of 2.0×10⁶J m−3K−1is used for soil minerals. Soil-specific values for Ch min may be more appropriate than using a constant standard value. For example, Tarara and Ham (1997) used a value of 1.92×10⁶J m−3K−1. However, we did not measure this quantity and we were not able to find such values in the literature.
Figure 6. Pedotransfer functions for quartz: fq retrievals (dark dots) vs. the four predictors offqgiven in Table 3. The modeled fqvalues are represented by the dashed lines.
Figure 7.λsat MOD values derived from themsand/mSOM pedo-transfer function for the volumetric quartz fractions, using observed
θsatvalues, vs.λsatretrievals.
Ch min on the retrieved values ofλsatandfq is presented in Supplement 3 (Fig. S3.1). On average, a change of+(−) 0.08×10⁶J m−3K−1inC
h mintriggers a change inλsatand fqof+1.7 % (−1.8 %) and+4.8 % (−7.0 %), respectively.
The impact of changes inCh minon the regression coeffi-cients of the pedotransfer functions is presented in Table 3 (last column). The impact is very small, except for thea1 co-efficient of them∗sandpedotransfer function. However, even in this case, the impact ofCh min on thea1coefficient is much lower than the confidence interval given by the bootstrap-ping, indicating that the relatively small number of soils we considered (as in other studies, e.g., Lu et al., 2007) is a larger source of uncertainty.
Moreover, uncertainties in thefclay,fsilt,fgravelor fSOM fractions may be caused by (1) the natural heterogeneity of soil properties, (2) the living root biomass or (3) stones that may not be accounted for in the gravel fraction.
In particular, during the installation of the probes, it was observed that stones are present at some stations. Stones are not evenly distributed in the soil, and it is not possible to in-vestigate whether the soil area where the temperature probes were inserted contains stones as it must be left undisturbed.
Figure 8. λsat MOD values derived from the m∗sand pedotrans-fer function for the volumetric quartz fractions, using θsatMOD (Eq. 13) or the observed θsat(dark dots and open diamonds, re-spectively), vs.λsatretrievals: (top) full model, (middle)fSOM= 0.013 m3m−3, and (bottom)fSOM=0.013 m3m−3andfgravel= 0 m3m−3. Scores are given for theθsatMODconfiguration.
4.2 Can the newλsatmodel be applied to other soil
types?
The λsat values we obtained are consistent with values re-ported by other authors. In this study, λsat values ranging between 1.26 and 2.80 W m−1K−1are found (Table 2). Tar-nawski et al. (2011) gaveλsatvalues ranging between 2.5 and 3.5 W m−1K−1for standard sands. Lu et al. (2007) gaveλsat values ranging between 1.33 and 2.2 W m−1K−1.
A key component of the λsat model is the pedotransfer function for quartz (Eq. 12). Thefq pedotransfer functions
we propose are based on available soil characteristics. The current global soil digital maps provide information about SOM, gravels and bulk density (Nachtergaele et al., 2012). Therefore, using Eqs. (1) and (6)–(12) on a large scale is possible, and porosity can be derived from Eq. (1). On the other hand, the suggestedfqpedotransfer functions are ob-tained for temperate grassland soils containing a rather large amount of organic matter and are valid formsand/mSOM ra-tio values lower than 40 (Table 2). These equara-tions should be evaluated for other regions. In particular, hematite has to be considered together with quartz for tropical soils (Church-man and Lowe, 2012). Moreover, the pedotransfer function we get forθsat(Eq. 13) and we use to conduct the sensitivity study of Sect. 3.3 is valid for the specific sites we considered. Equation (13) cannot be used to predict porosity in other re-gions.
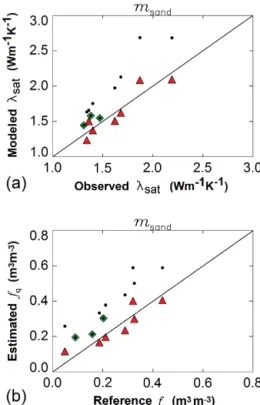
In order to assess the applicability of the pedotransfer function for quartz obtained in this study, we used the in-dependent data from Lu et al. (2007) and Tarnawski et al. (2009) for 10 Chinese soils (see Supplement 4 and Ta-ble S4.1). These soils consist of reassemTa-bled sieved soil sam-ples and contain no gravel, while our data concern undis-turbed soils. Moreover, most of these soils contain very little organic matter and themsand/mSOMratio can be much larger that themsand/mSOMvalues measured at our grassland sites. For the 14 French soils used to determine pedotransfer func-tions for quartz, the msand/mSOM ratio ranges from 3.7 to 37.2 (Table 2). Only three soils of Lu et al. (2007) present such low values ofmsand/mSOM. The other seven soils of Lu et al. (2007) presentmsand/mSOMvalues ranging from 48 to 1328 (see Table S4.1).
We usedλsatexperimental values derived from Table 3 in Tarnawski et al. (2009) to calculateQandfqfor the 10 Lu et al. (2007) soils. These data are presented in Supplement 4. Figure S4.1 shows the statistical relationship between these quantities and msand. Very good correlations of Q and fq withmsand are observed, with r2 values of 0.72 and 0.83, respectively. This is consistent with our finding thatfqis sys-tematically better correlated with soil characteristics thanQ
(Sect. 3.2).
The pedotransfer functions derived from French soils tend to overestimatefqfor the Lu et al. (2007) soils, especially for the seven soils presentingmsand/mSOMvalues larger than 40. Note that Lu et al. (2007) obtained a similar result for coarse-textured soils with their model, which assumedQ=msand. For the three other soils, presenting msand/mSOM values smaller than 40,fq MAE values are given in Table 4. The best MAE score (0.071 m3m−3) is obtained for the m∗
sand predictor offq.
Table 6.Pedotransfer functions offq(Eq. 12) for seven soils of Lu et al. (2007) withmsand/mSOM>40. The best predictor and the best scores are in bold. The regressionpvalues are within brackets and in italics.
Predictor offq Regression scores Coefficients for seven Lu soils with
msand/mSOM>40
r2 RMSD MAE a0 a1
(pvalue) (m3m−3) (m3m−3)
msand/mSOM 0.40 0.089 0.075 0.20 0.000148 (0.13)
m∗sand 0.82 0.073 0.054 0.07 0.425
(0.005)
m
sand 0.82 0.048 0.042 0.04 0.386
(0.005)
1−θsat−fsand 0.81 0.050 0.043 0.44 −0.814 (0.006)
∗Onlym
sandvalues smaller than 0.6 kg kg−1are used in the regression.
predictors offq. It appears thatmsand gives the best scores. The contrasting coefficient values between Tables 6 and 3 (Chinese and French soils, respectively) illustrate the vari-ability of the coefficients of pedotransfer functions from one soil category to another, and themsand/mSOMratio seems to be a good indicator of the validity of a given pedotransfer function.
On the other hand, the msand/mSOM ratio is not a good predictor of fq for the Lu et al. (2007) soils presenting msand/mSOM values larger than 40, andr2presents a small value of 0.40 (Table 6). This can be explained by the very large range of msand/mSOM values for these soils (see Ta-ble S4.1). Using ln(msand/mSOM) instead ofmsand/mSOMis a way to obtain a predictor linearly correlated withfq. This is shown by Fig. S4.2 for the 10 Lu et al. (2007) soils: the correlation is increased to a large extent (r2=0.60).
4.3 Canmsand-basedfqpedotransfer functions be used
across soil types?
Given the results presented in Tables 3, 4 and 6, it can be concluded thatmsandis the best predictor offqacross min-eral soil types. Themsand/mSOMpredictor is relevant for the mineral soils containing the largest amount of organic matter. Although the msand/mSOM predictor gives the best r2 scores for the 14 grassland soils considered in this study, it seems more difficult to apply this predictor to other soils, as shown by the high MAE score (MAE=0.135 m3m−3) for the corresponding Lu et al. (2007) soils in Table 4. More-over, the scores are very sensitive to errors in the estimation ofmSOMas shown by Table 5. Although them∗sandpredictor gives slightly better scores thanmsand(Table 4), thea1 coef-ficient in more sensitive to errors inCh min(Table 3), and the bootstrapping reveals large uncertainties ina0anda1values.
The results presented in this study suggest that the
msand/mSOMratio can be used to differentiate between tem-perate grassland soils containing a rather large amount of organic matter (3.7< msand/mSOM<40) and soils contain-ing less organic matter (msand/mSOM>40). Themsand pre-dictor can be used in both cases to estimate the volumetric fraction of quartz, with the followinga0anda1coefficient values in Eq. (12): 0.15 and 0.572 for msand/mSOM rang-ing between 3.7 and 40 (Table 3) and 0.04 and 0.386 for
msand/mSOM>40 (Table 6).
4.4 Prospects for using soil temperature profiles
Using standard soil moisture and soil temperature observa-tions is a way to investigate soil thermal properties over a large variety of soils, as the access to such data is facilitated by online databases (Dorigo et al., 2011).
A limitation of the data set we used, however, is that soil temperature observations (Ti) are recorded with a resolution
of1Ti=0.1◦C only (see Sect. 2.1). This low resolution
af-fects the accuracy of the soil thermal diffusivity estimates. In order to limit the impact of this effect, a data filtering tech-nique is used (see Supplement 5) andDhis retrieved with a precision of 18 %.
It can be noticed that ifTi data were recorded with a
res-olution of 0.03◦C (which corresponds to the typical uncer-tainty of PT100 probes),Dhcould be retrieved with a preci-sion of about 5 % in the conditions of Eq. (S5.3). Therefore, one may recommend revising the current practise of most observation networks consisting in recording soil tempera-ture with a resolution of 0.1◦C only. More precision in theλ
estimates would permit investigating other processes of heat transfer in the soil such as those related to water transport (Rutten, 2015).
5 Conclusions
An attempt was made to use routine soil temperature and soil moisture observations of a network of automatic weather sta-tions to retrieve instantaneous values of the soil thermal con-ductivity at a depth of 0.10 m. The data from the SMOSMA-NIA network, in southern France, are used. First, the thermal diffusivity is derived from consecutive measurements of the soil temperature. Theλvalues are then derived from the ther-mal diffusivity retrievals and from the volumetric heat capac-ity calculated using measured soil properties. The relation-ship between theλestimates and the measured soil moisture at a depth of 0.10 m permits the retrieval ofλsatfor 14 sta-tions. The Lu et al. (2007) empiricalλmodel is then used to retrieve the quartz volumetric content by reverse modeling. A number of pedotransfer functions is proposed for volumet-ric fraction of quartz for the considered region in France. For the grassland soils examined in this study, the ratio of sand to SOM fractions is the best predictor offq. A sensitivity study shows that omitting gravels and the SOM information has
a major impact onλsat. Finally, an error propagation analy-sis and a comparison with independentλsatdata from Lu et al. (2007) show that the gravimetric fraction of sand within soil solids, including gravels and SOM, is a good predictor of the volumetric fraction of quartz when a larger variety of soil types is considered.
6 Data availability
The SMOSMANIA data are available to the research com-munity through the International Soil Moisture Network web site (https://ismn.geo.tuwien.ac.at/).
The Supplement related to this article is available online at doi:10.5194/soil-2-615-2016-supplement.
Acknowledgements. We thank Xinhua Xiao (NC State Univer-sity Soil Physics, Raleigh, USA), Tusheng Ren (China Agricultural University, Beijing, China) and a third anonymous referee for their review of the manuscript and for their fruitful comments. We thank Aaron Boone (CNRM, Toulouse, France) for his helpful comments. We thank our Météo-France colleagues for their support in collecting and archiving the SMOSMANIA data: Catherine Bienaimé, Marc Bailleul, Laurent Brunier, Anna Chau-mont, Jacques Couzinier, Mathieu Créau, Philippe Gillodes, Sandrine Girres, Michel Gouverneur, Maryvonne Kerdoncuff, Matthieu Lacan, Pierre Lantuejoul, Dominique Paulais, Fabi-enne Simon, Dominique Simonpietri, Marie-Hélène Théron and Marie Yardin.
Edited by: A. Cerdà
Reviewed by: T. Ren and two anonymous referees
References
Abu-Hamdeh, N. H. and Reeder, R. C.: Soil thermal conductivity: effects of density, moisture, salt concentration, and organic mat-ter, Soil Sci. Soc. Am. J., 64, 1285–1290, 2000.
Albergel, C., Rüdiger, C., Pellarin, T., Calvet, J.-C., Fritz, N., Frois-sard, F., Suquia, D., Petitpa, A., Piguet, B., and Martin, E.: From near-surface to root-zone soil moisture using an exponential fil-ter: an assessment of the method based on in-situ observations and model simulations, Hydrol. Earth Syst. Sci., 12, 1323–1337, doi:10.5194/hess-12-1323-2008, 2008.
Albergel, C., Calvet, J.-C., de Rosnay, P., Balsamo, G., Wagner, W., Hasenauer, S., Naeimi, V., Martin, E., Bazile, E., Bouys-sel, F., and Mahfouf, J.-F.: Cross-evaluation of modelled and remotely sensed surface soil moisture with in situ data in southwestern France, Hydrol. Earth Syst. Sci., 14, 2177–2191, doi:10.5194/hess-14-2177-2010, 2010.
Bristow, K. L., Kluitenberg, G. J., and Horton R.: Measure-ment of soil thermal properties with a dual-probe heat-pulse technique, Soil Sci. Soc. Am. J., 58, 1288–1294, doi:10.2136/sssaj1994.03615995005800050002x, 1994. Calvet, J.-C., Bessemoulin, P., Noilhan, J., Berne, C., Braud,
I., Courault, D., Fritz, N., Gonzalez-Sosa, E., Goutorbe, J.-P., Haverkamp, R., Jaubert, G., Kergoat, L., Lachaud, G., Lau-rent, J.-P., Mordelet, P., Olioso, A., Péris, P., Roujean, J.-L., Thony, J.-L., Tosca, C., Vauclin, M., and Vignes, D.: MUREX: a land-surface field experiment to study the annual cycle of the energy and water budgets, Ann. Geophys., 17, 838–854, doi:10.1007/s00585-999-0838-2, 1999.
Calvet, J.-C., Fritz, N., Froissard, F., Suquia, D., Petitpa, A., and Piguet, B.: In situ soil moisture observations for the CAL/VAL of SMOS: the SMOSMANIA network, In-ternational Geoscience and Remote Sensing Symposium, IGARSS, Barcelona, Spain, 23–28 July 2007, 1196–1199, doi:10.1109/IGARSS.2007.4423019, 2007.
Chen, Y. Y., Yang, K., Tang, W., Qin, J., and Zhao, L.: Parameter-izing soil organic carbon’s impacts on soil porosity and thermal parameters for Eastern Tibet grasslands, Sci. China Earth Sci., 55, 1001–1011, doi:10.1007/s11430-012-4433-0, 2012. Churchman, G. J. and Lowe, D. J.: Alteration, formation, and
occur-rence of minerals in soils, in: Handbook of soil sciences: proper-ties and processes, edited by: Huang, P. M., Li, C., and Summer, M. E., Chapter 20, 40–42, isbn:978-1-4398-0306-6, CRC Press, Boca Raton (FL), 2012.
Côté, J. and Konrad, J.-M.: A generalized thermal conductivity model for soils and construction materials, Can. Geotech. J., 42, 443–458, doi:10.1139/T04-106, 2005.
Crank, J. and Nicolson, P.: A practical method for numeri-cal evaluation of solutions of partial differential equations of the heat-conduction type, Adv. Comput. Math., 6, 207–226, doi:10.1007/BF02127704, 1996.
Decharme, B., Brun, E., Boone, A., Delire, C., Le Moigne, P., and Morin, S.: Impacts of snow and organic soils parameteri-zation on northern Eurasian soil temperature profiles simulated by the ISBA land surface model, The Cryosphere, 10, 853–877, doi:10.5194/tc-10-853-2016, 2016.
de Vries, D. A.: Thermal properties of soils, in: Physics of plant en-vironment, edited by: Van Wijk, W. R., 210–235, North-Holland Publ. Co., Amsterdam, 1963.
Dong, Y., McCartney, J. S., and Lu, N.: Critical review of thermal conductivity models for unsaturated soils, Geotech. Geol. Eng., 33, 207–221, doi:10.1007/s10706-015-9843-2, 2015.
Dorigo, W. A., Wagner, W., Hohensinn, R., Hahn, S., Paulik, C., Xaver, A., Gruber, A., Drusch, M., Mecklenburg, S., van Oeve-len, P., Robock, A., and Jackson, T.: The International Soil Mois-ture Network: a data hosting facility for global in situ soil mois-ture measurements, Hydrol. Earth Syst. Sci., 15, 1675–1698, doi:10.5194/hess-15-1675-2011, 2011.
Draper, C., Mahfouf, J.-F., Calvet, J.-C., Martin, E., and Wagner, W.: Assimilation of ASCAT near-surface soil moisture into the SIM hydrological model over France, Hydrol. Earth Syst. Sci., 15, 3829–3841, doi:10.5194/hess-15-3829-2011, 2011. Farouki, O. T.: Thermal properties of soils, Series on Rock and Soil
Mechanics, 11, Trans. Tech. Pub., Rockport, MA, USA, 136 pp., 1986.
Johansen, O.: Thermal conductivity of soils, PhD thesis, Univer-sity of Trondheim, 236 pp., Universitetsbiblioteket i Trondheim, Høgskoleringen 1, 7034 Trondheim, Norway, available at: http: //www.dtic.mil/dtic/tr/fulltext/u2/a044002.pdf (last access: Jan-uary 2016), 1975.
Kersten, M. S.: Thermal properties of soils, University of Minnesota Engineering Experiment Station Bulletin, 28, 227 pp., Univer-sity of Minnesota Agricultural Experiment Station, St. Paul, MN 55108, 1949.
Laanaia, N., Carrer, D., Calvet, J.-C., and Pagé, C.: How will climate change affect the vegetation cycle over France? A generic modeling approach, Climate Risk Management, 13, 31– 42, doi:10.1016/j.crm.2016.06.001, 2016.
Lawrence, D. M. and Slater, A. G.: Incorporating organic soil into a global climate model, Clim. Dynam., 30, 145–160, doi:10.1007/s00382-007-0278-1, 2008.
Lu, S., Ren, T., Gong, Y., and Horton, R.: An improved model for predicting soil thermal conductivity from water con-tent at room temperature, Soil Sci. Soc. Am. J., 71, 8–14, doi:10.2136/sssaj2006.0041, 2007.
Nachtergaele, F., van Velthuize, H., Verelst, L., Wiberg, D., Batjes, N., Dijkshoorn, K., van Engelen, V., Fis-cher, G., Jones, A., Montanarella, L., Petri, M., Prieler, S., Teixeira, E., and Shi, X.: Harmonized World Soil Database, Version 1.2, FAO/IIASA/ISRIC/ISS-CAS/JRC, FAO, Rome, Italy and IIASA, Laxenburg, Austria, available at: http://webarchive.iiasa.ac.at/Research/LUC/ External-World-soil-database/HWSD_Documentation.pdf (last access: January 2016), 2012.
Parlange, M. B., Cahill, A. T., Nielsen, D. R., Hopmans, J. W., and Wendroth, O.: Review of heat and water movement in field soils, Soil Till. Res., 47, 5–10, 1998.
Parrens, M., Zakharova, E., Lafont, S., Calvet, J.-C., Kerr, Y., Wag-ner, W., and Wigneron, J.-P.: Comparing soil moisture retrievals from SMOS and ASCAT over France, Hydrol. Earth Syst. Sci., 16, 423–440, doi:10.5194/hess-16-423-2012, 2012.
Peters-Lidard, C. D., Blackburn, E., Liang, X., and Wood, E. F.: The effect of soil thermal conductivity parameterization on surface energy fluxes and temperatures, J. Atmos. Sci., 55, 1209–1224, 1998.
Rutten, M. M.: Moisture in the topsoil: From large-scale ob-servations to small-scale process understanding, PhD The-sis, Delft university of Technology, doi:10.4233/uuid:89e13a16-b456-4692-92f0-7a40ada82451, 2015.
Schelde, K., Thomsen, A., Heidmann, T., Schjonning, P., and Jans-son, P.-E.: Diurnal fluctuations of water and heat flows in a bare soil, Water Resour. Res., 34, 2919–2929, 1998.
Schönenberger, J., Momose, T., Wagner, B., Leong, W. H., and Tarnawski, V. R.: Canadian field soils I. Mineral composition by XRD/XRF measurements, Int. J. Thermophys., 33, 342–362, doi:10.1007/s10765-011-1142-4, 2012.
Sourbeer, J. J. and Loheide II, S. P.: Obstacles to long-term soil moisture monitoring with heated distributed temperature sensing, Hydrol. Process., 30, 1017–1035, 2015.
Tarara, J. M. and Ham, J. M.: Measuring soil water content in the laboratory and field with dual-probe heat-capacity sensors, Agron. J., 89, 535–542, 1997.
Tarnawski, V. R., Momose, T., and Leong, W. H.: As-sessing the impact of quartz content on the prediction of soil thermal conductivity, Géotechnique, 59, 331–338, doi:10.1680/geot.2009.59.4.331, 2009.
Tarnawski, V. R., Momose, T., and Leong, W. H.: Thermal conduc-tivity of standard sands II. Saturated conditions, Int. J. Thermo-phys., 32, 984–1005, doi:10.1007/s10765-011-0975-1, 2011. Tarnawski, V. R., McCombie, M. L., Leong, W. H., Wagner, B.,
Momose, T., and Schönenberger J.: Canadian field soils II. Mod-eling of quartz occurrence, Int. J. Thermophys., 33, 843–863, doi:10.1007/s10765-012-1184-2, 2012.
Yang, K., Koike, T., Ye, B., and Bastidas, L.: Inverse analysis of the role of soil vertical heterogeneity in controlling surface soil state and energy partition, J. Geophys. Res., 110, D08101, doi:10.1029/2004JD005500, 2005.
Zakharova, E., Calvet, J.-C., Lafont, S., Albergel, C., Wigneron, J.-P., Pardé, M., Kerr, Y., and Zribi, M.: Spatial and temporal variability of biophysical variables in southwestern France from airborne L-band radiometry, Hydrol. Earth Syst. Sci., 16, 1725– 1743, doi:10.5194/hess-16-1725-2012, 2012.