J. Electrochem. Soc., Vol. 142, No. 10, October 1995 9 The Electrochemical Society, Inc.
3313line. ~'~'I~ Since the conductivity of polyaniline arise f r o m anion d o p i n g into it, B F ; also m u s t be supplied as the do- pant w h e r e the electropolymerization takes place. W h e n the degree of dissociation of A T F B is small, both anilinium ion a n d B F ; w o u l d be supplied to the site w h e r e the electro- polymerization of aniline takes place. In our-case, it s e e m s that the small degree of dissociation of A T F B in M e C N m i g h t effect the electropolymerization process to prepare polyaniline w h i c h is better for battery use than that of polyaniline prepared in P C or G B L . In addition, the elec- tropolymerization current density influences the discharge a n d charge characteristics of polyaniline. Polyaniline pre- p a r e d in M e C N containing 1.0 m o l d m -3 A T F B at 0.01 m A c m 2 h a d the largest discharge capacity a n d the smallest effect of the kinetics at O.l m A c m -~ as s h o w n in Fig. 5. This m a y be because polyaniline prepared in M e C N containing 1.0 m o l d m -3 A T F B at 0.i or 0.01 m A c m -2 has a fine fibrous structure w h i c h has very large surface area (Fig. 2, Fig. 6).
Acknowledgments
This study was supported by the G r a n t - i n - A i d for Scien- tific Research from the Ministry of Education, Science a n d Culture of Japanese Government (No. 03453086).
Manuscript submitted July 15, 1994; revised m a n u s c r i p t received May 31, 1995.
Fukui University assisted in meeting the publication
costs of this article.
REFERENCES
1. A. Kitani, J. Izumi, Y. Hiromoto, and K. Sasaki,
Bull.
Chem. Soc. Jpn.,
57, 2254 (1984~.2. A. G. MacDiarmid, L. S. Yang, W. S. Huang, and B. D. Humphery,
Synth. Met,
18, 393 (1987).3. L. D o u b o v a , G. Mengoli, M . M . Musiani, a n d S. Valcher,
Electrochim. Acta,
34, 337 (1989).4. J. C. Lacroix, K. K. Kanazawa, and A. Diaz,
This Jour-
nal,
136, 1308 (1989)5. T. Kobayashi, H. Yoneyama, and H. Tamura, J.
Elec-
troanal. Chem.,
177, 293 (1984).6. Y. Shim, M. Won, and S. Park,
This Journal,
137, 538 (1990).7. T. Osaka, S. Ogano, and K. Naoi,
ibid.,
135, 539 (1988); T. Osaka, S. Ogano, K. Naoi, a n d N. Oyama,ibid.,
136, 306 (1989); T. Osaka, T. Nakajima, K. Naoi, and B. B. Owens,ibid.,
137, 2139 (1990).8. M. C. Miras, C. Barbero, R. Kotz, a n d O. Haas,
ibid.,
138, 335 (1991).9. N. Kobayashi, K. Yamada, and R. Hirohashi,
Elec-
trochim. Acta.,
37, 2101 (1992).10. Z. Takehara, K. K a n a m u r a , and S. Yonezawa,
ibid.,
136, 2767 (1989); K. K a n a m u r a , S. Yonezawa, Y. Kawai, and Z. Takehara,J. Electroanal. Chem.,
301, 291 (1991).11. A. Volkov, G. Trourillon, R. C. Lacaze, and J. E. Dubois,
J. Electroanal. Chem. Interracial Electrochem.,
115, 279 (1980).12. T. Ohsaka, Y. Ohnuki, N. Oyama, G. Katagiri, a n d K. Kamisako,
ibid.,
161, 399 (1984).13. W. Peukert,
Electrotech. Zeit.,
18, 287 (1897).14. E. M. Genies, A. Boyle, M. Lapkowski, and C. Tsintavis,
Synth. Met.,
36, 139 (1990).15. M. E. Jezefowicz, R. Laversanne, H. H. S. Javadi, A. J. Epstein, J. P. Pouget, X.Tang, and A. G. MacDiarmid,
Phys. Rev. B.,
39, 12958 (1989).16. M. Laridjani and J. P. Pouget, E. M. Scherr and A. G. MacDiarmid, M. E. Jezefowiez, and A. J. Epstein,
Macromolecules,
25, 4106 (1992).17. P. Walden, H. Ulich and G. Busch,
Z. Physik. Chem.,
A123, 429 (1926); P. Walden and E. J. Birr,ibid.,
A153, 1 (1931).
Surface Effects in the Hydrogen Evolution Reaction on
Ni-Zn Alloy Electrodes in Alkaline Solutions
A. C. D. Angelo *'a and A. Lasia*
DEpartment de chimie, Universitd de Sherbrooke, Sherbrooke, Qudbec, Canada J I K 2R1
ABSTRACT
Hydrogen evolution reaction was studied on N i - Z n (25 % of Ni before leaching) in 1 M NaOH at 25~ These electrodes were characterized by very low Tafel slopes of 67 mV dec -~. Other techniques used included potential and current pulse, potential relaxation in an open circuit, and ac impedance spectroscopy. Analysis of the experimental results led to the conclusion that hydrogen adsorption in the surface layers was responsible for the observed behavior. Influence of the oxidation of the electrode Surface and the addition of poisons, thiourea and cyanides, were also studied. These processes i n h i b i t the hydrogen absorption a n d restore "normal" Tafel slopes. Kinetic parameters of the hydrogen evolution reaction were determined.
Introduction
H y d r o g e n is one of the m o s t promising energy carriers a n alternative to fossil fuels. I'2 G a s e o u s h y d r o g e n can be easily p r o d u c e d b y w a t e r electrolysis a n d further used as a n o n - polluting fuel directly in the internal c o m b u s t i o n engines or reconverted to electricity in fuel cells. T h e h y d r o g e n evo- lution reaction ( H E R ) has b e e n studied on various electrode materials in order to find better electrocatalysts a n d to un- derstand better the kinetics a n d m e c h a n i s m of this pro- cess) -I~ B e t w e e n the best electrode material for the H E R are R a n e y - t y p e alloys. ~2-3~ T h e y consist of an e]ectrocata- lytically active metal, e.g., Ni or Co, a n d the other m o r e active one, e.g., A 1 or Zn, w h i c h can be easily leached out in alkaline solutions leaving a large active surface area. T h e s e
* Electrochemical Society Active Member.
a Permanent address: Departamento de Quimiea, U N E S P , Bauru, SP, Brazil.
materials are well k n o w n in the catalytic hydrogenation of organic compounds. In our earlier papers we have studied the HER on various Raney Ni-A117.20.26.28-31 and N i - Z n elec- trodes. 19'2~ Ni-A1 alloys usually are characterized by n o n - linear Tafel plots, their slopes increase with overpotential, while N i - Z n alloys are characterized by low Tafel slopes; which are usually linear a n d increase with the increase i n nickel content. ~ The morphological surface studies show formation of a " d r y - m u d " - t y p e structure 19 because the al- loy shrinks upon leaching. 24 During the leaching process a small a m o u n t of large pores and a large a m o u n t of very narrow pores are formed, especially for Z n - r i c h alloys.19'24,~5 The leaching process is usually not complete and a small a m o u n t of Z n stays in the alloy and may leach out slowly with timeY '2~'32 Tafel slopes obtained on N i - Z n electrodes are in the range 55 to 90 mV dec -~ depending on Z n con- tent. ~9 They cannot be explained by the Volmer-Heyrovsky- Tafel reaction mechanism with the transfer coefficient ecsdl.org/site/terms_use address. Redistribution subject to ECS license or copyright; see
close to 0.5. This m e c h a n i s m predicts the possibility of ob- taining slopes of 30 or 40 m V dee -I at low overpotentials w h i c h should b e c o m e 118 (or co) at m o r e negative poten- tials. Nonlinear slopes m a y be observed in the intermediate range. To explain these slopes in terms of the Volmer- H e y r o v s k y reaction m e c h a n i s m one should a s s u m e very large values of transfer coefficients, 19 w h i c h are not very probable in terms of the current charge-transfer theories. D e Giz et al. 33 tried to explain these slopes a s s u m i n g the Volmer-Heyrovsky-Tafel reaction m e c h a n i s m (rate of Tafel reaction w a s negligible). T h e y reproduced l o w Tafel slopes at l o w overpotentials, b e l o w 6.i V. These intermediate slopes are possible at these overpotentials. However, the rate constants presented b y de Giz et al. produce a "normal" slope of 120 m V dec ~ at the overpotentials larger than 0.I V, a n d they cannot explain the observed experi- mental behavior. In fact, it is clearly visible f r o m Fig. 5 in Ref. 33 that the calculated Tafel slope increases with over- potential while the experimental one stays small a n d con- stant. O u r studies s h o w e d 19 that the slopes are linear in the overpotential range studied, i.e., from -0.18 to -0.3 V, de- pending on the electrode composition.
T h e purpose of the present paper is to better understand the m e c h a n i s m of the H E R on eleetrodeposited N i - Z n elec- trodes. Various steady-state a n d relaxation techniques were used a n d the electrode surface w a s modified by oxida- tion a n d adsorption of neutral a n d ionic species.
Experimental
N i - Z n electrodes were prepared by electrodeposition as described earlier. 19 Their composition was verified by the inductively coupled plasma (ICP) technique (ARI F I S O N S 3506 AES) after dissolution in nitric acid. It was found that they contained 25% in Ni. Before electrochemical studies zinc was leached out in alkaline solution. 19
The steady-state polarization, chronoamperometric, and chronopotentiometric experiments were carried out using
E G & G Model 273A potentiostat controlled by an IBM-PC
compatible microcomputer. AC impedance data were ob- tained using E G & G Model 5206 lock-in analyzer for the measurements between 10 kHz and 5 Hz and a fast Fourier transform (FFT) technique for frequencies between 5 and 0.05 Hz. Data acquisition for the open-circuit potential de- cay (OCPD) experiments was carried out using Mode] PRO- 92 Nicolet digital oscilloscope.
All the electrochemical experiments were carried out at 25~ in i M NaOH (BDH-Aristar 99.99%) solution using deionized w a t e r (Barnstead-Nanopure). Nitrogen was bub- bled through the solution before and during the experi- ments. A high surface area Ni foil was used as a counter- electrode and Hg/HgO/1 M N a O H as a reference electrode. Both electrodes were separated from the working electrode compartment by a fritted glass. Thiourea (Anachemia) and sodium cyanide (Anachemia) were used without further purification.
Results
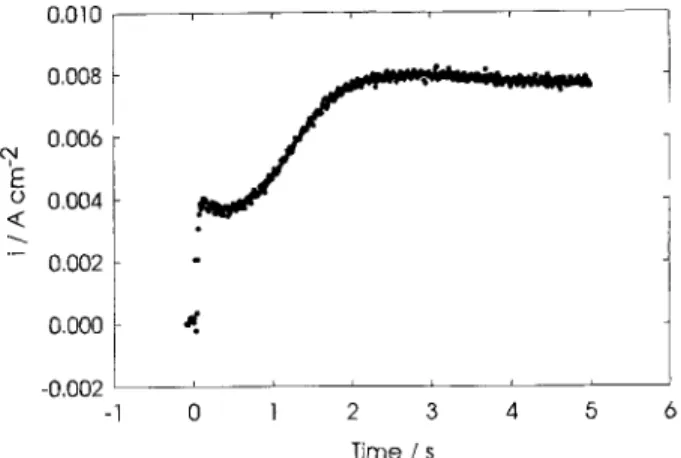
S o d i u m h y d r o x i d e s o l u t i o n s . - - In order to explain the nature of low values of Tafel slopes they were measured in two different experiments. The first one consisted of the application of a constant current of 127 m A c m -2 for 15 rain followed by the application of various currents down to 0.03 ~A cm -2 for 5 s and recording the electrode potential at each current value. The whole procedure was repeated un- til reproducible Tafel curves were obtained. The second method consisted of keeping the electrode at an open-cir- cuit potential (OCP) for 30 min and then the application of a potential pulse and measuring the current as soon as the first stable value w a s obtained, that is about 0.5 s after application of the pulse. Then the electrode was kept at the open-circuit potential again, and the whole procedure was repeated at another potential. At lower overpotentials (<ll0 m V ) the current was increasing with time to a steady- state plateau. At higher overpotentials first a small plateau was formed and then the current increased to form another
04
O 0.010
0.008
0.006
0.004
0.002
0.000
-0,002 -]
1
4
i L i ~ J
0 1 2 3 4 5 6
Time / s
Fig. 1. Chranoamperometric transients obtained on Ni-Zn elec- trode in 1 M NaOH at 25 C, potential pulse from ~ = 0 to -0.198 V.
plateau. Figure 1 shows an example of such chronoampero- metric curve. In this case the first plateau was used in con- structing Tafel plots. Figure 2 shows two Tafel plots ob- tained using these two methods and the corresponding Tafel parameters are presented in Table I.
The Tafel slope obtained in the steady-state experiments, b = 67 mV dec 1, was much lower than the theoretical value of 118 mV dec-1 predicted for the Volmer-Heyrovsky mech- anism with ~ = 0.5. As was mentioned above such a small slope cannot be explained in terms of the Volmer-Hey- rovsky-Tafel mechanism. Moreover, these slopes cannot be explained in terms of fractal or porous electrode models, which predict increase (or doubling) of Tafel slopes. 34'3~ On the other hand the Tafel slope obtained in the potential pulse experiments, b = 109 m V dec -I, w a s close to the theo- retical one. In order to better understand the observed be- havior series of other experiments were performed.
In the subsequent experiment the effect of polarization time on the galvanostatically recorded steady-state Tafel curves was studied. In these experiments the electrode po- tential was measured after 1 to 60 s after application of a constant current. The obtained Tafel curves are displayed in Fig. 3. There was no change in the Tafel plots at negative overpotentials but the anodic shift of the open-circuit po- tential was observed at longer polarization times, that is, at low cathodic currents the potential was more positive than the thermodynamic value of the H E R . This result indicated that other reactions then the H E R determined the kinetics of the process at these potentials. These could be, for exam- ple, corrosion of residual quantities of zinc inside the pores left out after the leaching process.
Chronopotentiometric transients obtained (i) after keep- ing the electrode at an open-circuit potential for 4 h and
(it)
after polarization for 24 h at I00 m A c m -~, are s h o w n in Fig. 4. It is evident that w h e n the electrode was previously polarized at high current density, the potential stabilized very quickly and that kept the open-circuit potential re- laxed m u c h more slowly. This experiment indicates that some changes at the electrode surface take place during the polarization.
Behavior of these electrodes was also studied using ac impedance spectroscopy. As it was s h o w n earlier 36 the faradaic admittance, Yf, of the H E R is described as
Y~ = A + B/(j~o + C) [1]
Table I. Tafel parameters obtained from the steady-state galvanostatic and potential pulse experiments of the HER on
Ni-Zn (25% of Ni before leaching) in 1 M NaOH at 25~
Technique b (mV dec -1) io " 1 0 4 ( A c m -2) - ' q 2 5 0 (mV ~)
Steady state 67 0.13 288
Potential pulse 109 18.8 231
a -~250 is the overpotential at a current density of 250 mAcm -2. ecsdl.org/site/terms_use address. Redistribution subject to ECS license or copyright; see
J. Electrochem. Soc.,
Vol. 142, No. 10, October 1995 9 The Electrochemical Society, Inc. 3315-1 ~ ~176176 o
qb ~
El3 D O O O
-2 %%~ o o o o o o A
O o O
O ~
O D
o D D
- - [3OD D
-4 ~ B
-0,30 -0,25 -0.20 -0.15 -0.10 -0,05 0,00
" q / V
Fig. 2. Tafel curves obtained from (A) potentiostatic pulse and (S) steady-state experiments in 1 M NaOH at 25~
0
-2
E
O
<,5
"~- - 4
-6
E
- 8 ~ i i
-0.2 -0.1 0.0 0.0
~ I / V
Fig. 3. Influence of time of application of constant current on steady-state Tafel curves; measurements after A, 1; B, 5; C, 10; D, 30; and E, 60 s.
-0.3
>
-0.2
-0.1
0.0
0.0
0.2
0 ] 0 20 30
Time/s
Fig. 4. Chronopotentiometric transients obtained on the electrode kept for 4 h at open-circuitpotential (continuous line) and polarized at 100 mA cm -2 for 24 h (doffed line).
w h e r e
A = -F(Oro/c)~)o [2]
B = -(F2/a~)(Oro/a| [3]
C = - ( F / ( y ~ ) ( ~ r ~ / O | [4]
ro = vl + v2, r~ = v1 - v2 - 2v3, vl, v2, a n d v3 a r e t h e r a t e s of t h e Volmer, Heyrovsky, a n d Tafel r e a c t i o n s , respectively, a n d ~1 is t h e c h a r g e n e c e s s a r y f o r a m o n o l a y e r c o v e r a g e b y a t o m i c h y d r o g e n . T h e e q u i v a l e n t c i r c u i t c o n s i s t s of t h e s o l u t i o n r e s i s t a n c e i n s e r i e s w i t h t h e p a r a l l e l c o n n e c t i o n of t h e C P E
-25
-20
-15
b
0
5
-5 0 5 10 t5 20 25
Z ' l o c m 2
-12
-10 -8
-2
0
2
0 2 4 6 8 10 12
Z' I l~ crn ~
~ - 2 C
0 t 2 3
Z ' / ~ c m z
-0,8
~
.400i
0.4
I)
0.0 0.4 0.8 1.2
Z' l C~ cm~
-0.4
-0.2
b
0.0
-0.2
0.0
0.0 0.2 0.4 0.6 0.1
Z ' I ~ crn z
0.2 0.3
Z ' I D c m ~
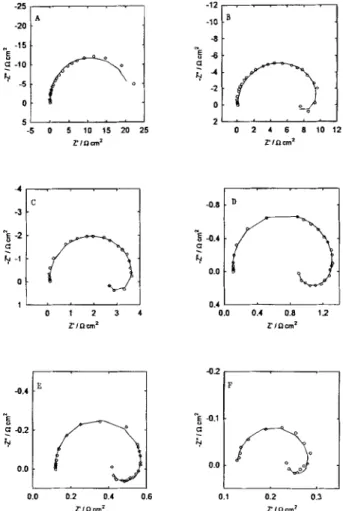
Fig. 5. Complex plane plots obtained on Ni-Zn electrode in 1 M NaOH; ~ = (A) -0.148, (B) -0.168, (C) -0.188, (D) -0.208, (E) -0.228, and (F) -0.268 V.
e l e m e n t a n d f a r a d a i c i m p e d a n c e , l~ T h i s m o d e l p r e d i c t s e i t h e r t w o s e m i c i r c l e s o r a s e m i c i r c l e f o l l o w e d b y a n i n d u c - t i v e l o o p ? 6'3749
F i g u r e 5 s h o w s c o m p l e x p l a n e p l o t s o b t a i n e d f o r t h e H E R a t d i f f e r e n t o v e r p o t e n t i a l s . A t o v e r p o t e n t i a l s h i g h e r t h a n - 0 . 1 5 V a n i n d u c t i v e l o o p a p p e a r e d i n a l o w f r e - q u e n c y r a n g e . I n o u r e a r l i e r s t u d i e s 19 t h i s l o o p w a s n o t r e - p o r t e d b e c a u s e t h e ac i m p e d a n c e r e s u l t s w e r e s t u d i e d a t h i g h e r f r e q u e n c i e s (the l o w e r f r e q u e n c y l i m i t w a s a r o u n d 1 H z f o r o v e r p o t e n t i a l s m o r e n e g a t i v e t h a n - 0 . 1 5 V). A l - t h o u g h s u c h a n i n d u c t i v e l o o p is t h e o r e t i c a l l y p o s s i b l e , i t is q u i t e u n u s u a l f o r t h e H E R a n d i t h a s o n l y b e e n f o u n d f o r b y S e a r s o n r176 f o r h y d r o g e n a b s o r b i n g p a l l a d i u m e l e c t r o d e s i n a l k a l i n e s o l u t i o n s . D e Giz e t al. ~3 o b s e r v e d o n e s e m i c i r c l e a t 25~ o n N i - Z n e l e c t r o d e s a n d t w o s e m i c i r c l e s a t h i g h e r t e m p e r a t u r e s . T h e y a t t r i b u t e d t h i s f a c t t o t h e c h a n g e s of h y d r o g e n a d s o r p t i o n w i t h t e m p e r a t u r e .
T h e e x p e r i m e n t a l a c i m p e d a n c e c u r v e s w e r e a n a l y z e d u s i n g a c o m p l e x n o n l i n e a r l e a s t s q u a r e s ( C N L S ) 38 p r o g r a m i n o r d e r t o d e t e r m i n e t h e p a r a m e t e r s A, B, a n d C of t h e f a r a d a i c p r o c e s s as w e l l as t h e C P E p a r a m e t e r s . T h e v a l u e s
Table II. Parameters A, B, and C determined for the HER on Ni-Zn electrode in 1 M NaOH at 25~
- ~ (V) A (~-1 em-2) B (~ 1 cm-2 s-l) C (s -1)
0.068 0.00101 - - - -
0.108 0.0216 - - - -
0.148 0.0742 0.0138 0.0476
0.168 0.164 0.0486 0.755
0.188 0.397 0.245 1.28
0.208 0.992 1.08 1.79
0.228 2.32 3.70 2.56
0.248 4.35 8.58 3.09
0.268 6.78 13.75 4.29
ecsdl.org/site/terms_use address. Redistribution subject to ECS license or copyright; see
-0.3
-0.2 >
-0.1
Table III. Tafel parameters for the HER on Ni-Zn electrode
in 1 M NaOH at 25~ before and after oxidation-reduction
cycling (see text for details).
Conditions b ( m V dec -~) io 9 i0 ~ (A c m -~) -~l~o (mV)
N o cycling 70 0.66 251
After cycling 97 8.5 239
A
- x \ \
B ~ \ \
-4
-2
0
log (f / s) 0.0
-6 2
Fig. 6. Open-circuit relaxation curves obtained for the Ni-Zn elec-
trode: A, after long time polarization and, B, for the electrode kept at
the open-circuit potential.
of parameters A, B, and C are displayed in Table II. They could be, in general, used to estimate the rate con- stants 10'1~'~9 of the HER. However, it was impossible to fit these parameters, together with the steady-state polariza- tion data, to the HER mechanism. Subsequently, we have simulated values of A, B, and C parameters for the Volmer- Heyrovsky and Volmer-Heyrovsky-Tafel reaction mechan- isms using various values the rate constants k~, k_~, k2, and k3 between 10 -3 and 10 -~3 mol cm -~ s ~. Again, it was impos- sible to obtain values of parameters A, B, and C close to the experimental ones at these overpotentials. Therefore, it is evident that the Votmer-Heyrovsky-Tafel mechanism cannot explain the observed ac impedance experimental behavior.
Potential relaxation in a n open circuit was also used to study the electrode behavior. Possibilities of this technique for hydrogen adsorption was discussed earlier. 1~'2~ Fig- ure 6 shows the open-circuit potential decay (OCPD) curves for a freshly prepared electrode and the same elec- trode after polarization at the potentials corresponding to the hydrogen evolution. The electrode, which was polarized at a constant current for a long time, relaxed more slowly than that kept at the open-circuit potential before applica- tion of the current pulse. Even after long times (>60 s) the potential did not reach the equilibrium value.
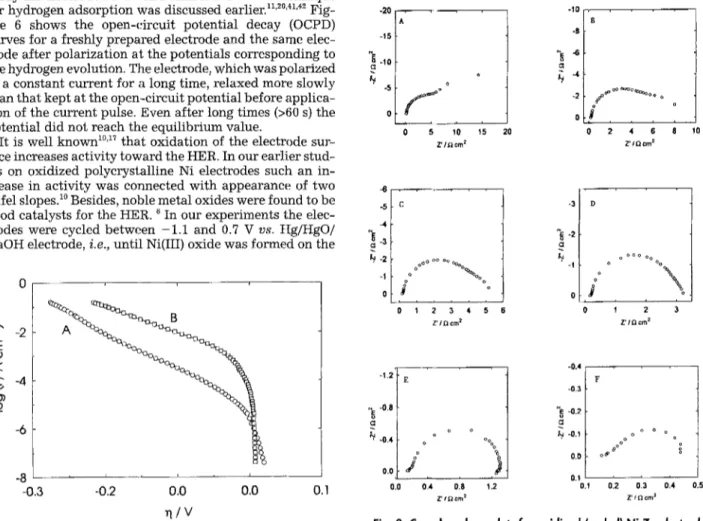
It is well k n o w n ~8'~7 that oxidation of the electrode sur- face increases activity toward the HER. In our earlier stud- ies on oxidized polycrystalline Ni electrodes such a n in- crease in activity was connected with appearance of two Tafel slopes. ~8 Besides, noble metal oxides were found to be good catalysts for the HER. 8 In our experiments the elec- trodes were cycled between - 1 . 1 and 0.7 V
vs.
Hg/HgO/ NaOH electrode,i.e.,
u n t i l Ni(III) oxide was formed on the0
B
( 9
<
v
o
-6
- 8 i i
-0.3 -0.2 0.0 0.0 0.1
~ / V
Fig. 7. Tafel plots obtained on Ni-Zn electrode, A, and after cycling
to positive potentials, B; see text for details.
electrode surface. Figure 7 presents Tafel curves obtained before a n d after ten such cycles. A n increase of the elec- trode activity a n d also an increase of the Tafel slope w a s observed. That increased activity w a s maintained u p to 20 h u n d e r cathodic polarization. T h e corresponding Tafel parameters are presented in Table IIL
T h e activity of oxidized electrodes w a s also studied using ac i m p e d a n c e spectroscopy. Figure 8 s h o w s corresponding c o m p l e x plane plots. T h e y are very different from those for nonoxidized surfaces, Fig. 5. T h e inductive loop present in Fig. 5 disappeared a n d t w o semicircles w e r e obtained at lower overpotentiais a n d only one d e f o r m e d semicircle at higher ones. T h e first semicircle w a s almost overpotential independent while the second one decreased continuously with the increase of overpotential until it vanished. Addi- tionally, at higher overpotentials, a linear s e g m e n t of the c o m p l e x plane plot w a s found in a high frequency range, w h i c h is characteristic of porous electrodes. 34'43 Very simi- lar results w e r e reported earlier on N i - Z n 44 a n d Ni-A128 pressed p o w d e r electrodes in 1 M N a O H , w h e r e it w a s sug- gested that the first semicircle w a s related to electrode porosity. 48
Influence of poisons.--In
order to better u n d e r s t a n d electrode behavior, surface active poisons were added to the solution. Two model compounds were chosen: one neu- tral, thiourea, and one ionic, cyanide. Figures 9 and 10-20
-15
-10
-5 o
f ~
0 S 10
Z'I~1 cm z 15 20
-10 . . . . .
B
-2 a,~ o~176 ~176 ~ 1 7 6 1 7 6 1 7 6 1 7 6 o o
o J ~
2 4 6 8 Z' tL1 crn z
10
-6
-5 -4
-1
0
o~ o oo o ~ ~o ~
o ~ o o . ~ , ~ % ~
0 1 2 3 4. 5
Z ' l ~ crn 2
-1
o o~o oo
o Oo
o~
/ o
1 2 3
Z ' l f l c m z
-1,2 ~
-0,8
-0 A
0.0 0.0
o
o o
J
o%
)
-0.4
-0,3
o O
O o
O O
0.0 ~176 ~ 1 7 6
0.1
0.4 0.8 1.2 0,1 0.2 0.3 0.4 0.5
Z ~ l ~ c m z Z ' / Q c m =
Fig. 8. Complex plane plots for oxidized (cycled) Ni-Zn electrode;
~q = (A) -0.028, (B) -0.068, (C) -0.088, (0) -0.108, {E) -0.148,
and (F) -0.228 V.
ecsdl.org/site/terms_use address. Redistribution subject to ECS license or copyright; see
J. Electrochem. Soc., Vol. 142, No. 10, October 1995 9 The Electrochemical Society, Inc.
0
~ , -2
=
E
O ~ -4
-5
-0.4 -0.3 -0,2 -0.1 0,0 O, 1
r l / V
Fig. 9. Tafel curves obtained on Ni-Zn electrode in 1 M NaOH (A) and after adding 25 mM of thiourea (B).
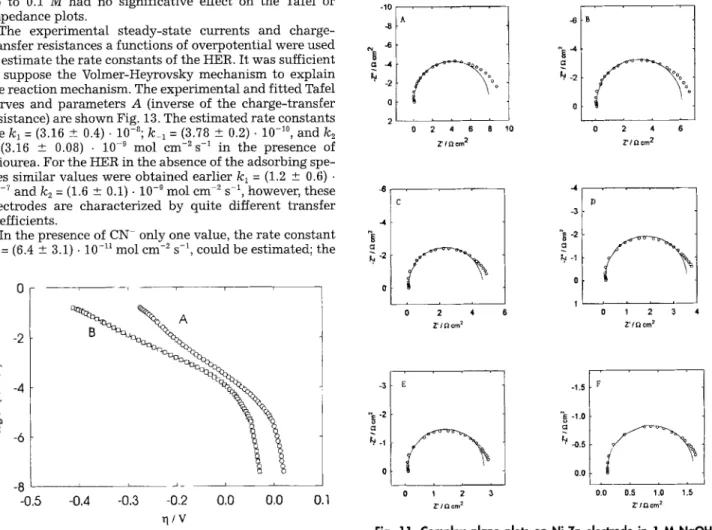
s h o w e x a m p l e s of Tafel plots for the H E R in the presence of these c o m p o u n d s a n d the corresponding Tafel parameters are displayed in Table IV. T h e s e results indicate that in both cases slopes close to the theoretical value for the Volmer- H e y r o v s k y reaction m e c h a n i s m (118 m V dec -1) w e r e ob- tained. In the presence of thiourea a n increase in electrode activity at lower overpotentials w a s observed while the ad- dition of cyanides caused decrease in activity. A n increase in Tafel slopes a n d a decrease in activity w a s also observed earlier on N i - Z n electrodes after the addition of pyridine to the solutionY
A C i m p e d a n c e spectra obtained in 1 M N a O H in the pres- ence of 25 m M thiourea a n d 0.5 m M C N - are displayed in Fig. 11 a n d 12. O n l y one semicircle w a s observed at all overpotentials, contrary to the results in pure N a O H solu- tion. F u r t h e r i n c r e a s e in t h e c o n c e n t r a t i o n of t h i o u r e a up to 0.1 M h a d no s i g n i f i c a t i v e effect on t h e Tafel or i m p e d a n c e plots.
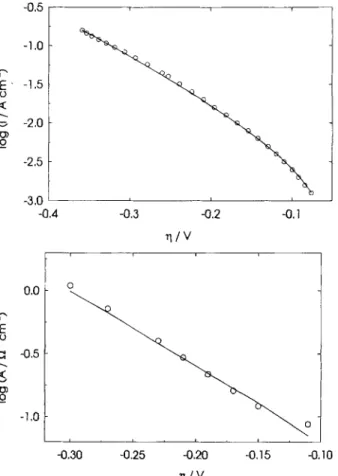
The e x p e r i m e n t a l s t e a d y - s t a t e c u r r e n t s a n d c h a r g e - t r a n s f e r r e s i s t a n c e s a f u n c t i o n s of o v e r p o t e n t i a l w e r e u s e d to e s t i m a t e t h e r a t e c o n s t a n t s of t h e H E R . It w a s sufficient to suppose t h e V o l m e r - H e y r o v s k y m e c h a n i s m to e x p l a i n t h e r e a c t i o n m e c h a n i s m . The e x p e r i m e n t a l a n d f i t t e d Tafel curves a n d p a r a m e t e r s A (inverse of t h e c h a r g e - t r a n s f e r resistance) a r e s h o w n Fig. 13. The e s t i m a t e d r a t e c o n s t a n t s are kl = (3.16 + 0.4). 10-8; k ~ = (3.78 -+ 0.2) 9 10 -~~ a n d k~ = (3.16 -+ 0.08) 9 10 -~ m o l c m - S s -~ in t h e p r e s e n c e of t h i o u r e a . F o r t h e H E R in t h e a b s e n c e of t h e a d s o r b i n g s p e - cies s i m i l a r v a l u e s w e r e o b t a i n e d e a r l i e r kl = (1.2 -+ 0.6) 9 10 -7 a n d k2 = (1.6 _+ 0.1) - 10 -g m o l e m 2 s 1, however, t h e s e e l e c t r o d e s are c h a r a c t e r i z e d b y q u i t e d i f f e r e n t t r a n s f e r coefficients.
In t h e p r e s e n c e of C N o n l y one value, t h e r a t e c o n s t a n t k8 = (6.4 -+ 3.1) 9 10 - n tool cm -2 s -1, c o u l d be e s t i m a t e d ; t h e
T
-5
- 8 ~ _ i q
-0.5 -0.4 -0.3 -0,2 0.0 0,0 O. 1
q / v
Fig. 10. fafel plots obtained on Ni-Zn electrode in 1 M NaOH (A) and after adding 0.5 mM of CN (B).
3317
Table IV. Tafel parameters obtained for the HER in the presence of poisons in ! M NaOH at 25~
Solution b (mY dec -1) io. 104 (A cm -2) -'q2~0 (V)
1 M NaOH 67 0.13 288
+25 mM thiourea 115 3.0 337
+0.5 mM CN- 101 0.48 377
v a l u e s of o t h e r r a t e c o n s t a n t s w e r e m u c h l a r g e r t h a n k2 a n d t h e i r errors w e r e l a r g e r t h a n t h e i r values. A l t h o u g h , in g e n - eral, t w o e q u i v a l e n t s o l u t i o n s exist f o r t h e Volmer- H e y r o v s k y m e c h a n i s m in w h i c h v a l u e s of kl e-> k2 a n d k_l ~-~ k-2 a n d ~1 e-> f~2 are i n t e r c h a n g e d ~~ it w a s s u p p o s e d h e r e t h a t t h e k i n e t i c s of t h e H e y r o v s k y r e a c t i o n is r a t e l i m i t i n g , t h a t is t h e s u r f a c e c o v e r a g e increases w i t h n e g a t i v e over- p o t e n t i a l .
F i g u r e 14 p r e s e n t s t h e d e p e n d e n c e of t h e d o u b l e - l a y e r c a p a c i t a n c e s , Ca1, as a f u n c t i o n of t h e o v e r p o t e n t i a l , o b - t a i n e d u s i n g m o d e l d e s c r i b e d by B r u g et aI. 46 In t h e p r e s - e n c e of c y a n i d e s a n d t h i o u r e a , Cd~ is p r a c t i c a l l y o v e r p o t e n - t i m i n d e p e n d e n t , b u t in p u r e N a O H s o l u t i o n s Cdl c h a n g e s n o n l i n e a r l y w i t h o v e r p o t e n t i a l , t h e l a r g e s t changes o c c u r at l o w o v e r p o t e n t i a l s . Cdl v a l u e s for C N - s o l u t i o n s are t h e l o w e s t i n d i c a t i n g s t r o n g a d s o r p t i o n . On t h e o t h e r hand, d o u b l e - l a y e r c a p a c i t a n c e s in t h e p r e s e n c e of t h i o u r e a are t h e l a r g e s t and, at m o r e n e g a t i v e o v e r p o t e n t i a l s , t h e y are t h e s a m e as those f o u n d for t h e p u r e N a O H solutions, i n d i - c a t i n g t h a t t h e r e is no c h a n g e in t h e a p p a r e n t s u r f a c e area.
Discussion
O u r studies of the H E R on electrodeposited N i - Z n elec- trodes, after leaching out Zn, h a v e s h o w n that the reaction m e c h a n i s m in pure N a O H solutions is different than that on the oxidized surface or in the presence of thiourea or
-10
-8
-6
~ .-4 r,i
' - 2
0
2
0 2 4 6 8
~ t ~ z c m 2
10
-6 ]B
~,-2
0
0 2 4 6
Z ' / D crn 2
-4
0
-4
-3
~-2
0
1 D
0 2 4 6 0 1 2 3
Z, i D c m 2 Z ' I D cm z
-3 -1.5 F
-1.0
~, -o.5
11.0
0 1 2 3 0.0 0.5 1.0 1.5
Z ' / Q c m 2 Z ' / ~ c m 2
Fig. 11. Complex plane plots on Ni-Zn electrode in 1 M NaOH containing 25 mM of thiourea; ~q = (A) -0.148, (B) -0.168, (C)
-0.188, (D) -0.208, (E) -0.228, and (F) -0.268 V.
ecsdl.org/site/terms_use address. Redistribution subject to ECS license or copyright; see
-120
-8O
&
/
-80
-60
~' -2o
0
B
o
/ J
0 40 80 120 0 20 40 SO I10
Z * l g t c m 2 Z ' l D c m 2
-50
-40
-30 i
~ -20
- 1 0
0
-15
-10
0
0 10 20 30 40 50 0 5 10
Z, iDcm 7 Z' t Qcen 2
15
-6
4
0
-1.6
-1.2
~
-0.8' -0.4
0.0
0 2 4 0.0 0.4 O.g t .2 1.6
Z, i n c m 2 Z'l~lcm ~
Fig. 12. Complex plane plots on Ni-Zn electrode in 1 M NaOH and 0.5 mM of CN-; -q = (A) -0.148, (B) -0.188, (C) -0.228, (D) -0.268, (E) -0.298, and [F) -0.338 V.
cyanides. The electrodes at which the HER was carried out for a long time behave differently from the electrodes kept at the open-circuit potential. Tafel slopes determined on polarized electrodes were smaller t h a n those determined on the electrodes kept at the equilibrium potential.
I n the chronopotentiometric experiments the measured potential increased more slowly when the current pulse was applied to the electrode kept at the OCP, and it in- creased very fast when applied to the electrode previously polarized at the negative potentials. Besides, the OCPD curves decreased faster for the electrode kept at the OCP.
The ac impedance spectra showed a n inductive loop at more negative overpotentials. Although that loop is pre- dicted for the HER 36.37.39 the parameters obtained could not be explained in terms of the Volmer-Heyrovsky-Tafel mechanism. Oxidation of the electrode surfaced led to an increase in the Tafel slope although it was still lower t h a n that predicted for the HER.
The experimental results presented above suggested that the hydrogen absorption into metal (or at least in the sur- face layer), occurring at long polarization times, could be responsible for the observed behavior The electrode kept at the open-circuit potential did not contain any hydride and displayed a "normal" behavior. Initial current, measured after the application of the potential pulse, led to the Tafel slope of 109 mV dec -1 and after longer polarization the current increased. Recently, Machado e t al. 47 found similar effects for N i - Z n and Ni-Co-Zn electrodes using measure- ments of Tafel slopes 4 ms after the application of the cur- rent pulse, however, they did not present any transient curves. From the studies presented above, it follows that the stabilization of the electrode potential depends on the experimental current density (potential), and the measure- ments should be taken only after reaching a plateau. Machado e t al. 4~ attributed the observed behavior to the formation of the subsurface hydride. Besides, Machado and
E '
0
<
O)
_go -0.5 -1.0 -1.5 -2.0 -2.5 -3.0
-0.4
, i
, i i
-0.3 -0.2 -0.1
q / V
0 . 0 o
,,,-,
=~ -0,5
-1.0
i i i *
-0.30 -0.25 -0.20 -0.15 -0.10 n / v
Fig. 13. Tafel plot (A, top) and dependence of log A (B, bottom) as a function of overpelential on Ni-Zn electrode in 1 M NaOH and 25 mM af thiourea.
Avaca 48 suggested formation of the hydride for the HER on Ni electrode in alkaline solutions. It should be mentioned, however, that loss of activity is often a t t r i b u t e d to the sur- face hydride formation 4~,~~ although hydrogen absorbing materials as LaNi~ are very good catalysts for the HER. 32 Divisek e t a l . 32 also suggested that one should consider two surface species present during the HER: hydrogen ab- sorbed on the surface and the top layer of absorbed hydro- gen which should be treated as a separate species. However this hypothesis has not been confirmed experimentally yet. Other effects were also proposed to explain small Tafel slopes observed on certain active materials. Rausch and Wendt 24 found that the high concentration polarization of hydrogen i n pores would lead to lower Tafel slopes of 80 to 110 mV dec -1, Similarly, Losev e t al. 5~ suggested a Nerstian Tafel slope (2.3 R T / n F ) and Mfiller and Heidrich 52 even smaller slopes of 15 mV dec 1 for gas evolving electrodes.
35
3O
O
--- 20 0
15
10 . . . . .
-0.35 -0.30 -0.25 -0.20 -0.15 -0.10 -0.05 ~ / V
Fig. 14. Double-layer capacitances determined from ac imped- ances in 1 M NaOH ( 9 and with 25 mM thiourea (A) and wilh 0.5 mM CN (El).
ecsdl.org/site/terms_use address. Redistribution subject to ECS license or copyright; see
J. Electrochem. Soc.,
Vol. 142, No. 10, October 1995 9 The Electrochemical Society, Inc. 3319However, this behavior should lead to a change of the slope with overpotential which was not observed in our case, w h e r e Tafel plots w e r e linear in a large potential range. TM
Besides, it is not clear w h y such large changes in slopes should be observed after the adsorption of thiourea or cyanides; adsorption should not influence the h y d r o g e n mass-transfer process because the surface m o r p h o l o g y w a s not affected b y these processes a n d the double-layer capac- itances do not s h o w any important changes in the real sur- face area.
T h e proposed hydride formation in the porous nickel layer close to the electrode surface could change the Ni surface properties with overpotential a n d affects the reac- tion kinetics a n d m e c h a n i s m leading to smaller Tafel slopes a n d different ac behavior. Surface oxidation or adsorption of neutral or ionic substance inhibits the hydride formation process a n d restores the typical behavior f o u n d for other electrodes. Adsorption of thiourea increases the electrode activity at l o w overpotentials in relation to the possible N i - S formation, k n o w n to e n h a n c e the kinetics of the H E R . 5~-57 This effect is different f r o m the poisoning effect observed on noble metals. In fact, thiourea w a s a d d e d to the nickel plating solution '3'55 to obtain Ni-S alloy. O n the other hand, adsorption of cyanides poisons the electrode a n d decreases its activity t o w a r d the H E R .
It w a s reported earlier 22'25'~8 that residual zinc content in the electrode is important for the electrode catalytic activ- ity. In our studies w e have used thin alloy layers (i0 to 15 p~m) deposited on small electrodes (0.32 era2), a n d the residual concentration of zinc in the solution w a s negligi- ble. These studies w e r e carried out after long time polariza- tion, a n d the changes in zinc content in the electrode during the registration of curves w e r e negligible.
Acknowledgments
T h e postdoctoral fellowship for A. C. D. A n g e l o f r o m the F u n d a ~ a o de A m p a r o a Pesquisa do Estado de Silo Paulo (FAPESP-Brazil), a n d the F C A R a n d N S E R C funding are gratefully acknowledged.
M a n u s c r i p t received Nov. 28, 1994; revised manuscript received June 13, 1995.
Universitd de Sherbrooke assisted in meeting the publi- cation costs of this article.
REFERENCE S
1. G. E Dinga, Int. J. Hydrogen Energy, 14, 777 (1989). 2. T. N. Veziroglu and F. Barbir, ibid., 17, 391 (1992). 3. M. Enyo, in Comprehensive Treatise of Electrochem-
istry, Vol. 7, J. O'M. Bockris, E. Yeager, S. U. M. Khan, a n d R. E. White, Editors, p. 241, P l e n u m Press, N e w Y o r k (1983).
4. B. V. Tilak, A. C. R a m a m u r t h y , a n d B. E. C o n w a y ,
Proc.
Indian Acad. Sci. (Chem. Sci.), 97, 359 (1986). 5. B. E. Conway, Sci. Prog. Oxford, 71,479 (1987). 6. J. O'M. Bockris, in Comprehensive Treatise of Electro-
chemistry, Vol. 3, B. E. Conway, E. Yeager, and R. E. White, Editors, Plenum Press, New York (1981).
7. Electrochemical Hydrogen Technologies, H. Wendt,
Editor, Elsevier, New York (1990).
8. S. Trasatti, in Advances in Electrochemical Science
and Engineering, Vol. 2, H. Grischer and C. W. Tobias,
Editors, p. 1, VCH, New York (1992).
9. E.R. Gonzalez, G. Tremiliosi-Filho, a n d M. J. de Giz, in
Current Topics in Electrochemistry, 2, 167 (1993).
10. A. Lasia and A. Rami, J. EIectroanal. Chem., 294, 123 (1990).
11. A. Lasia, in Current Topics in Electrochemistry, 2, 239 (1993).
12. B. E. Conway, H. Angerstein-Kozlowska, and M. A. Sattar, This Journal, 130, 1825 (1983).
13. L. Lohrberg and P. Kohl, Electrochim. Acta, 29, 1557 (1984).
14. E. Endoh, H. Otouma, and Y. Oda, Int. J. Hydrogen Energy, 12, 473 (1987).
15. T. Kenjo, Electrochim. Acta, 33, 41 (1988).
16. J. Divisek, P. Malinowski, J. Mergel, and H. Schmitz,
Int. J. Hydrogen Energy, 13, 141 (1988).
17. Y. Choquette, L. Brossard, A. Lasia, and H. M6nard,
This Journal, 137, 1723 (1990); Electrochim. Acta, 35, 1251 (1990).
18. J. Divisek, J. Mergel, and H. Schmitz, Int. J. Hydrogen Energy, 15, 105 (1990).
19. L. Chert and A. Lasia, This Journal, 138, 3321 (1991). 20. A. Rami and A. Lasia, J. Appl Electrochem., 22, 376
(1992).
21. L. Chen and A. Lasia, This Journal, 139, 1058 (1992). 22. J. Balej, J. Divisek, H. Schmitz, and J. Mergel, J. Appl.
Electrochem., 22, 711 (1992).
23. M. J. De Giz, S. A. S. Machado, L. A. Avaca, and E. R. Gonzalez, ibid., 22, 973 (1992).
24. S. Rausch and H. Wendt, ibid., 22, 1025 (1992). 25. T. Borucinski, S. Rausch, and H. Wendt, ibid., 22, 1031
(1992).
26. P. Los, A. Rami, and A. Lasia, ibid., 23, 135 (1993). 27. M. Okido, J. K. Depo, and G. A. Capuano, This Journal,
140, 127 (1993).
28. L. Chen and A. Lasia, ibid., 149, 2474 (1993).
29. A. h a m Cheong, A. Lasia, and J. Lessard, ibid., 140, 2721 (1993).
30. A. Kam Cheong, A. Lasia, and J. Lessard, ibid., 141,975 (1994).
31. D. Miousse, V. Borck, and A. LaMa, J. AppI. EIec- trochem., 25 (1995).
32. J. Divisek, H. Schraitz, and B. Steffen, Electrochim. Acta, 39, 1723 (1994).
33. M. J. De Giz, G. Tremiliosi-Filho, and E. R. Gonzalez,
ibid., 39, 1775 (1994).
34. R. de Levie, in Advances in Electrochemistry and Elec- trochemical Engineering, Vol. 6, P. D e l a h a y and C. W Tobias, Editors, p. 239, Wiley, New York (1967). 35. W. H. Mulder and J. H. Sluyters, J. ElectroanaI. Chem.,
282, 27 (1990).
36. D.A. H a r r i n g t o n and B. E. Conway, Electrochim. Acta,
12, 1712 (1987).
37. C.-N. Cao,
ibid.,
35, 831 (1990).38. J. R. M a c d o n a l d ,
I m p e d a n c e Spectroscopy,
Wiley, N e w York (1987).39. J.-P. Diard, B. L e Gorrec, a n d C. Montella,
J. Elec-
troanal. Chem., 326, 13 (1992).
40. P. C. Searson, Aeta MetaIl. Mater., 39, 2519 (1991). 41. D. A. H a r r i n g t o n and B. E. Conway, J. Electroanal.
Chem., 221, 1 (1987). 42. L. Bat, ibid., 355, 37 (1993).
43. P. Los, A. Lasia, L. Brossard, and H. M6nard, ibid., 360, 101 (1993).
44. L. Chen and A. Lasia, This Journal, 139, 3214 (1992). 45. H. Kreiser, K. D. Beccu, and M. A. Gutjahr, Elec-
trochim. Acta, 21, 539 (1976).
46. G. J. Brug, A. L. B. van der Eeden, M. Sluyters- Rehbach, and J. H. Sluyters, J. Electroanal. Chem.,
176, 275 (1984).
47. S . A . S . M a c h a d o , J. Tiengo, P. D e L i m a Neto, a n d L. A. Avaca, EIectrochim. Acta, 39, 1757 (1994).
48. S . A . S . Machado and L. A. Avaca, ibid., 39, 1385 (1994). 49. D. M. Soares, O. Teschke, and I. Torriani, This Journal,
139, 98 (1992).
50. D.M. Soares, M. U. Kleinke, I. Toriani, and O. Teschke,
Int. J. Hydrogen Energy, 19, 573 (1994).
51. V. V. Losev, N. Ya. Bun6, a n d L. E. Chuvayeva, Elec- trochim. Acta, 34, 929 (1989).
52. L. Mfiller and H.-J. Heidrich, Sov. EIectrochem., 25, 1027 (1989).
53. H. Vandenborne, Ph. Vermeiren, and R. Leysen, Elec- trochim. Acta, 29, 297 (1984).
54. Yu. I. Kryulov, S. F. Chernyshov, A. G. Pshenichnikov, L. I. Al'tentaller, I. P. Naumov, Ya.S. Lapin, and N. P. Kuznetsova, Soy. Electrochem., 29, 640 (1991). 55. I. Paseka, Electrochim. Acta, 38, 2449 (1993).
56. E. R. Gonzalez, L. A. Avaca, G. Tremiliosi-Filho, S. A. S. Machado, and M. Ferreira, Int. J. Hydrogen Energy, 19, 17 (1994).
57. H. Wendt, Electrochim. Acta, 39, 1749 (1994).
58. J. Divisek, J. Mergel, and H. Schmitz, Int. J. Hydrogen Energy, 15, 105 (1990).
ecsdl.org/site/terms_use address. Redistribution subject to ECS license or copyright; see