FINE TUNING OF DWELLING TIME IN FRICTION STIR WELDING
FOR PREVENTING MATERIAL OVERHEATING, WELD TENSILE
STRENGTH INCREASE AND WELD NUGGET SIZE DECREASE
by
Miroslav M. MIJAJLOVIĆ*a and
Sonja M. VIDOJKOVIĆb
a
Faculty of Mechanical Engineering, University of Nis, Nis, Serbia
b
Institute of Chemistry, Technology and Metallurgy, University of Belgrade, Belgrade, Serbia
Original scientific paper DOI: 10.2298/TSCI160102102M
After successful welding, destructive testing into test samples from Al 2024-T351 friction stir butt welds showed that tensile strength of the weld improve along the joint line, while dimensions of the weld nugget decrease. For those welds, both the base material and the welding tool constantly cool down during the welding phase. Obviously, the base material became overheated during the long dwelling phase what made conditions for creation of joints with the reduced mechanical properties. Preserving all process parameters but varying the dwelling time from 5-27 seconds a new set of welding is done to reach maximal achievable tensile strength. An analytical-numerical-experimental model is used for optimising the duration of the dwelling time while searching for the maximal tensile strength of the welds.
Key words: friction stir welding, Al 2024-T351, overheating, dwelling time
Introduction
Researchers describe friction stir welding (FSW) [1] as a solid state welding tech-nique where two metallic parts are positioned in the welding position, fixed, heavily support-ed, and a rotating welding tool is fed into materials to weld them by brutal mixing [2]. The primary application of FSW was on long, plate shaped parts made of aluminum and its mild alloys [3, 4]. Further advances in FSW allowed it to be used on other materials different from aluminum [5-10] and on aluminum alloys that are commonly non-weldable, such as alumi-num alloys from the 2xxx and 7xxx series [11-13]. Alumialumi-num alloy Al 2024-T351 is an engi-neering material used for wing panels and fuselages in aero industry. Due to its limited weld-ability, Al 2024-T351 is difficult to be processed and properly applied for various load types [7-13]. Weldability of Al 2024-T351 has been improved with application of FSW after much research into synergy of proper welding tool geometry, proper welding parameters, and prop-er welding conditions. Many authors [14-17] welded Al 2024-T351 using non-threaded, threaded, and threaded tools with flats. The rotation rate used for the welding of aluminum should be approximately 800 rpm, welding rate of 80 mm/min and the ultimate tensile strength of the weld reaches approximately 73% of the ultimate tensile strength of the base material. Živković [18] investigated the influence of the welding tool on the properties of a weld made on Al 2024 alloy. The welding tool with a pin without thread, regardless of
weld-––––––––––––––
ing rate, either cracks during welding or welded joints have voids and cavities. Živković [18] reported the tensile efficiency of the weld of 70% and the bending efficiency lower than 10% of the base material. Radisavljević et al. [19] used a welding tool with a cone and tapered pin for welding of Al 2024-T351. The rotation rate was fixed at 750 rpm and welding rate was 73 mm/min and 93 mm/min. The best results were obtained at welding rate of 73 mm/min – tensile efficiency of 82.2% and bending efficiency of 41.4%. Radisavljević's [19] results show that an increase in the welding rate of 25% decreases the tensile and bending efficiency for a minimum of 15%. Yan et al. [20] investigated the effect of rotational and welding rate on the welding nugget and tensile properties of Al 2024-T351. The rotation rate varied from 100 rpm to 800 rpm and welding rate was 1.27 mm/s to 4.23 mm/s. The results show that the rotation rate has a dominant effect on weld nugget properties and microstructure of the weld. Raja-kumar and Balasubramanian [21] investigated creation of the weld nugget and made an em-pirical correlation between the weld nugget grain size, weld nugget hardness and tensile strength. Chen et al. [22] showed that weld nugget is the zone in FSW joint that suffered max-imal temperature loading and that creation and dimensions of the weld nugget are mostly in-fluenced by the welding parameters and welding tool [23]. The profile of the weld nugget is almost elliptical and the larger axis of the ellipse is close to the diameter of the welding tool's pin [24]. The regular FSW is done in several stages [25] and dwelling time (DWT) in FSW is considered as a time necessary for stabilization of the welding phase [26]. Many authors pro-vide different values of DWT (2-35 seconds) or simply neglect it as a welding process param-eter. The modelling of heat in FSW is very complex: authors present torque-based models [27-34], visco-plastic and thermo-adaptive models [35, 36], and simple mechanical models using complex strain based approaches [37]. Adapted and simplified boundary conditions are often used to avoid long numerical calculations [38]. Maximal temperatures that appear on Al 2024 during FSW vary between 66% and 82% of Al 2024 melting temperature [39, 40].
This study is an attempt to investigate the influence of base material's overheating during the dwelling phase on mechanical properties of the welded joint. It is observed that the tensile strength and dimensions of the weld nugget improve if the temperature of welding tool and base material decrease during welding phase. A set of experiments has been made where duration of DWT was varied in a specified range searching for DWT that result in maximal mechanical properties of welded joints. A combined model that searches for the optimal DWT for prescribed welding configuration has been developed, as well.
Experimental research
The research was planned to be realised in two phases, realising primary, and sec-ondary goals. Primary goals of the experimental research were to create FSW butt welds on Al 2024-T351 plates and provide necessary input for the analytical-numerical investigation of the heat generation process during FSW. Secondary goals were to investigate Al 2024-T351 weldability and check the mechanical properties of the realised joints.
without defects or joints with acceptable defects [42] were made and the welding parameters used for those joints were adopted as the one giving acceptable performance. Temperature of the welding tool and base material is only previewed by the infrared camera. Test samples for the tensile, bending, hardness, and macroscopic tests were extracted from the welded plates and then investigated. The detailed results of the first phase of the research are given in the previously published articles [25, 41].
The second phase of the research aimed in the direction of optimization and fine tun-ing of the process parameters to maximize mechanical properties of the welds. The same weld-ing plates, weldweld-ing tool, rotation, and weldweld-ing rate as for the first research phase were used for the second research phase. Acknowledging the published results [18-43] and experience gath-ered during the first research phase, it was agreed that the rotation rate of 910 rpm, plunging time of 41 seconds, plunging depth of approximately 0.1 mm, etc. are optimal for Al 2024-T351 and the fine tuning of the process was limited to DWT only. All the other parameters were pre-served as they were used during the initial research set but DWT – it has been varied carefully. The DWT was limited to 5, 10, 15, 20, and 25 seconds. One welding set with 27 seconds of DWT was performed to check the consistency and the results from the first research phase. The research was performed on the grinding mill with vertical working axis and the measuring set-up was prepared for capturing loads and temperature, fig. 1.
The experimental temperature of the base material is captured by thermocouples (TC) at 10 positions that are of the special interest for research [43]. Thermocouples were po-sitioned both on the advancing and retreating side at the same distance from the joint line (mirrored, 15 mm away from the joint line), in the middle of the base material’s thickness. The main idea of such localization of the TC was to capture the trend of peak temperatures throughout the complete welding sequence and minimally affect the integrity of test speci-mens, fig. 2. After successful welding, test samples for the tensile, bending, hardness, and macroscopic tests were extracted from the welded plates (test sample extraction scheme is given in fig. 2) and then investigated, as well.
Model description (analytical and numerical research)
The complete model is experimental, analytical, and numerical at the same time. The loads delivered to the welding tool during FSW (obtained experimentally) are used as an input in the analytical model that estimates amount of generated heat. The generated heat is then used for solving the heat equation and estimating the temperatures of discretized welding tool and base material. Based on the temperature of materials, thermo-mechanical properties of materials are updated and, simultaneously with the experimentally estimated loads, used Figure 1. Workplace and measuring set-up Figure 2. Location of thermocouples in base
for analytical estimation of the amount of heat in the next discretized moment of time. The procedure continues until the end of the pulling out phase. However, the model requires sig-nificant computer resources and long lasting calculation time due to slow numerical estima-tion of the temperature of the welding tool and base material. Detailed descripestima-tion of the model has been given in the previously published articles [25, 41, 43].
For easier interpretation of the temperatures at specific locations in the welding plates, with an idea of finding optimal DWT, the well-known linear regressions analysis has been applied.
Results
The first phase of the research was oriented towards recognition of the welding pro-cess parameters. For the welding of Al 2024-T351 selected welding tool has a cone, threaded pin, with medial diameter equal to the base material’s thickness. Shoulder has a concave tip and a diameter four times greater than the median diameter of the pin. Cone of the pin was 10° and the tilt angle of the welding tool is approximately 2°. Figure 3 gives an example of the welded joint with significant flash – welding was performed with 910 rpm and 0.25 mm/s. The exist-ence of massive flash is a certain proof of too high rotation or too high welding rate, or both.
Welding with the rotation rate of 910 rpm, welding rate of 0.94 mm/s, and DWT of 27 seconds resulted in welded joints classified as acceptable performance. These joints were used for further investigations while the experimental results and process parameters were used for analytical and numerical analysis. Test samples for investigation of tensile and bend-ing strength, hardness, and macroscopic analysis of the weld nugget are extracted from the joints. The detailed results for this research set have been given in the literature [25, 43].
During the second research phase 76 joints have been done in three working weeks in order to assure cold welding – the welding tool, base material and experimental set-up always had to start at room temperature. Welding was done in the air-conditioned research centre of EADS Immenstaad, Germany, with the room temperature varying between 25 °C and 27 °C.
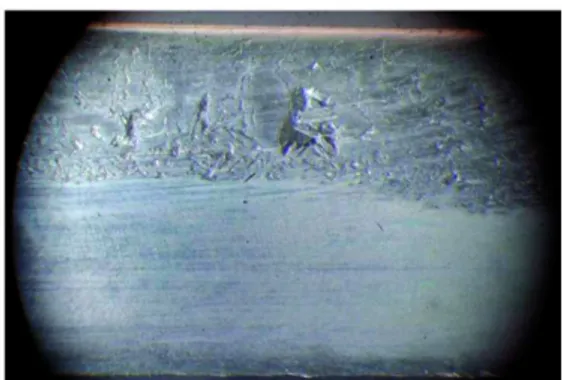
For the second research phase the same welding tool, base material and welding process parameters have been used as for the first research phase. The DWT has been varied from 5-27 seconds. After realisation of all 76 joints, visual and radiographic investigation has been done. Three joints made with 5 seconds DWT had low mixing of material and cavity de-fects, fig. 4, in the depth of the base material [42] and therefore further use of 5 seconds DWT has been suspended. Other joints were without weld defects.
Figure 3. Welded joint with significant amount of flashed material
Figure 5. Numerically estimated (average) temperature of the welding tool’s probe for different DWT; (a) complete welding sequence, (b) dwelling phase in detail
Numerical estimation of the temperature distribution in the welding tool was done for all prescribed DWT, fig. 5, giving complete welding sequence, fig.5(a), and the detail on dwelling phase, fig. 5(b). The linear regression analysis shows that a numerically stable tem-perature trend for the presented welding configuration would appear at approximately 10.5438 seconds.
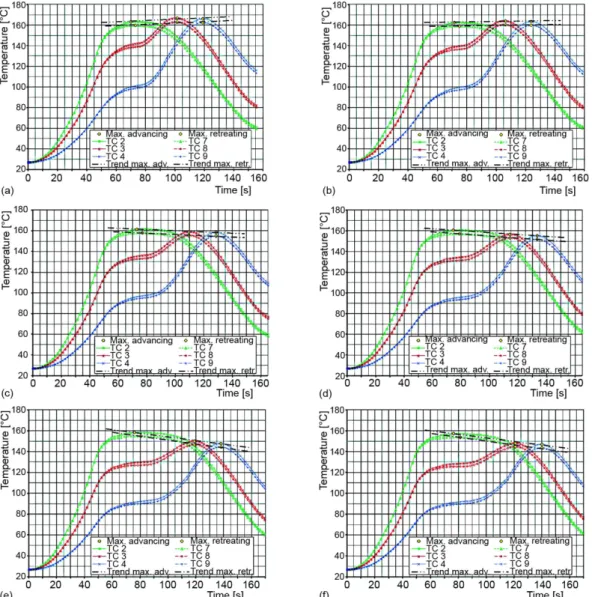
Temperature change in TC embedded in the base material was registered during ex-perimental researches for all prescribed DWT, as well, fig.6. The linear regression analysis shows a numerically stable temperature trend where no material overheating appears at ap-proximately 11.138 seconds DWT for the advancing side, fig. 7(a) and apap-proximately 11.343 seconds DWT for the retreating side of welded joints, fig.7(b).
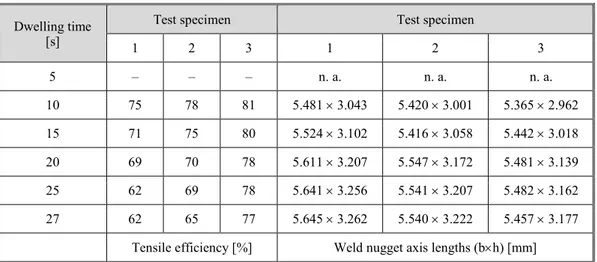
Test specimens for the investigation of mechanical properties have been cut from the welded joints with a slow-speed metal cutting saw, with massive cooling to prevent thermal disruption of the metal structure. Each joint gave three test specimens and for every DWT three joints were used for investigation. After the extraction of test specimens, tensile, bend-ing, and weld nugget size investigation was performed, tab. 1.
Table 1. Average tensile efficiency and weld nugget axis lengths in test specimens 1, 2, and 3
Linear regression analysis shows that more uniform distribution of tensile efficiency in test specimens would appear for DWT of approximately 9.438 seconds.
Dwelling time [s]
Test specimen Test specimen
1 2 3 1 2 3
5 – – – n. a. n. a. n. a.
10 75 78 81 5.481 × 3.043 5.420 × 3.001 5.365 × 2.962
15 71 75 80 5.524 × 3.102 5.416 × 3.058 5.442 × 3.018
20 69 70 78 5.611 × 3.207 5.547 × 3.172 5.481 × 3.139
25 62 69 78 5.641 × 3.256 5.541 × 3.207 5.482 × 3.162
27 62 65 77 5.645 × 3.262 5.540 × 3.222 5.457 × 3.177
Figure 6. Experimentally estimated temperature at thermocouples during welding with DWT of (a) 5 s, (b) 10 s, (c) 15 s, (d) 20 s, (e) 25 s, and (f) 27 s
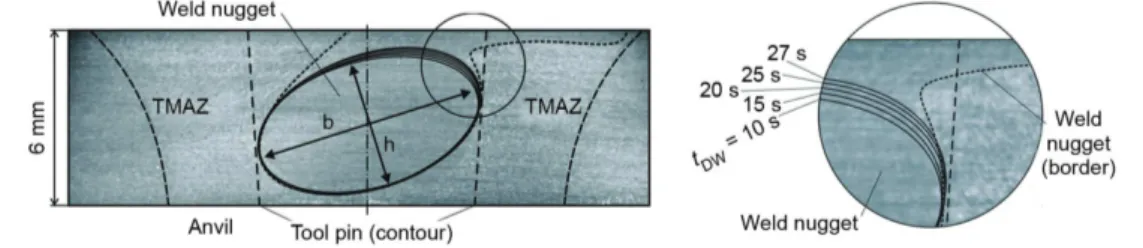
Bending efficiency showed an average of approximately 14% in all test specimens. Destruction of all investigated tensile test specimens occurred at the border of the weld nugget and thermo-mechanically affected zone, fig. 8. The weld nuggets suffered no dis-ruption/destruction and they have been used for further macroscopic investigation, as well.
Figure 8. Shape, dimensions, and position of the weld nugget at the test specimen No. 1
As in the first research phase, the weld nugget in all macroscopic specimens had a quasi-elliptic shape, a comet-tailed ending on top of the advancing side and a visible border with the rest of thermo-mechanically affected zone (TMAZ), fig. 8.
The axis lengths of the weld nuggets were used for estimation of the weld nugget ar-eas. Linear regression analysis shows that more uniform distribution of the weld nugget area in test specimens would appear for DWT of approximately 9.62 seconds.
Figure 9. Temperature distribution on test sample no. 1; back side (a), and front side (b), DWT = 10 s
It was observed that the welding nugget's location and shape are not changing with the change of DWT or test specimen while dimensions have different values. As a representa-tive, the shape and position of the weld nugget estimated after inspection at the test specimen 1 for all investigated DWT is shown in fig. 8.
For better understanding and representing the weld nugget, numerically estimated temperatures, and specific isotherms at the test sample 1 on the front and back test sample sides are shown in figs. 9(a) and 9(b), respectively.
Discussion
welding phase. The DWT of 20 seconds and 15 seconds implied lower temperature peaks in the dwelling phase of 379 °C and 383 °C, respectively. The temperature dropping trend dur-ing the welddur-ing phase had the maximum difference of 2 °C and 5 °C. The DWT of 10 seconds provided an almost smooth temperature transition from the dwelling to the welding phase with the maximum temperature in the dwelling phase of 373.7 °C and a temperature increase of 1.1 °C. The DWT of 5 seconds delivered no distinctive change in temperature from the dwelling to the welding phase. Temperature had a growing trend, from the start of 365 °C at the end of the dwelling phase until the end of the welding phase where the maximum of ap-proximately 372 °C was reached. The absolute difference between numerical and experimen-tally estimated temperature of base material was 12 °C in two discrete points near the fixation zone on the plates.
Linear regression has showed that DWT of 10.5438 seconds would provide constant temperature trend of the welding tools probe.
Experimentally estimated temperature distribution in the base material at six TC was used for further analyses and discussion. The TC were symmetrically located about the joint line and symmetrical pairs of TC were 2–7, 3–8, and 4–9 (figs. 2 and 6). Regardless of the DWT, symmetrical pairs captured different temperatures: TC 2, 3, and 4 on the advancing side captured slightly greater temperatures than TC 7, 8, and 9 on the retreating side.
The peak temperatures on TC on the same side show the same temperature trends as temperatures on the welding tool do. Temperatures captured during welding with DWT of 27 seconds show a decreasing trend – maximal temperatures at TC on the start side of the weld are higher than temperatures at TC at the middle and the end of the weld. This is a sign of massive heat generation during the dwelling phase, which leads to overheating of the base material. A decrease in DWT (to 25, 20, and 15 seconds) shows an improvement in temperature distribution in the zone of welding and the trend of maximal temperatures in TC decrease less. Maximal temperatures at TC are higher for smaller DWT as well. With DWT of 10 seconds maximal temperatures have a weak rising trend while welding with 5 seconds DWT shows a stronger temperature rising trend in TC. It can be seen that DWT between 10 seconds and 15 seconds provides the best maximal temperature trend – no overheating or cooling appears and linear re-gression analysis has showed that DWT of 11.138 seconds for the advancing side and 11.343 seconds for the retreating would give constant peak temperature trends in the TC.
Joints made with DWT of 5 seconds had no visual defects but radiography testing showed numerous defects in the depth of the material. The material in the zone of initial plunging was not heated enough and the welding tool acted as a drill. Forced by the rotation of the welding tool, the material mixed, more intensively near the anvil with the mixing inten-sity decreasing towards the middle of the welding tool pin. From the middle up to the shoul-der tip there remained a zone of partially mixed cold material that did not recrystallize.
Joints made with DWT of 10, 15, 20, 25, and 27 seconds had acceptable perfor-mance or defect free results.
Tensile testing of test specimens from the first research phase showed that tensile ef-ficiency of specimens varied from 51% to 84% in different test samples. The minimal values of efficiency were found for test specimens marked 1 while maximal values were found for test specimens marked 3.
ef-ficiency for test specimens separately, highest values of tensile efficiencies are observed for DWT of 10 seconds while an increase in DWT leads to a decrease in tensile efficiency from 4% to 7%. Tensile efficiency for a welded joint made with 10 seconds of DWT has the most uniform values of tensile efficiency along the joint line (specimens 1, 2, and 3), which are also the maximal observed values of tensile efficiency. The more uniform distribution of tensile efficiency in test specimens would appear for DWT of approximately 9.438 seconds with a variation between maximal and minimal tensile efficiency lower than 3%.
Bending testing performed on test specimens from the first research phase showed low bending efficiency of maximally 13% in test specimens 2, while test specimens 1 and 3 had the approximately efficiency of 12%. The bending efficiency on all test specimens from the second research phase reached app 14%.
Both in tensile and bending tests, the destruction of test samples appeared at the border between the weld nugget and thermo-mechanically affected zone.
Dimensions of the weld nugget varied along the joint line. The weld nugget had the maximal dimensions in test specimens 1 progressively decreasing to the minimal ones in test specimens 3. All tested joints have the same trend of the weld nugget size decreasing along the welding direction from test sample 1 to test sample 3. Weld nuggets of separate specimen group show an increasing trend with an increase in DWT. The smallest area of the weld nug-get and approximately the same area in test samples 1, 2, and 3 appear for DWT of 10 sec-onds. The linear regression analysis showed that more uniform distribution of the weld nugget area in test specimens would appear for DWT of approximately 9.62 seconds.
It is observed that the lower border between the weld nugget and thermo-mechanically affected zone is formed on temperature between 340-348 °C regardless on DWT. The lower border remains at the same position, as well. Upper border of the weld nug-get is slightly moving upwards with the increase of DWT.
Conclusions
Selection of the welding tool’s geometry appeared to be away from a challenge – the literature [2-24] has precisely defined how effective welding tool look like. The model used for the analysis provided satisfactory results – the difference between numerical and experi-mental temperatures was never higher than 12 °C (relative difference of about 3%).
The mechanical properties of the welded joints have a dependency on the base mate-rial's temperature in the moment of stirring and mixing – the moment of weld creation. How-ever, it is very difficult to define it – making a relationship with welding process parameters, temperature and any property of the weld is a difficult and challenging task. This might be the subject of a future research.
The research based merely on changing DWT has shown that DWT should be be-tween 9.4 seconds and 11.3 seconds for the prescribed welding conditions of Al 2024-T351. In this case, the trend of temperature in the base material is quasi-constant, which results in the weld nugget having minimal dimensions, almost uniform for the complete joint length, and in tensile efficiency having maximal values with minimal variation of results for speci-mens extracted from the beginning, middle and end locations of the weld.
Nowa-days, only sophisticated welding and monitoring systems can provide appropriate conditions for such adaptation, otherwise one must simply apply the trial and error method until the ac-ceptable results are achieved.
Acknowledgment
The authors would like to express their deepest gratitude to the EADS research ce n-tre in Immenstaad, Germany, for the technical support for this research. We are also indebted to the research personnel of the Research Laboratory for their kind assistance, patience and profound comments that have improved our research.
References
[1] Thomas, W. M., et al., Friction Stir Butt Welding, GB patent no. 9125978 8, 1991
[2] Nandan, R. et al., Recent Advances in Friction-Stir Welding – Process, Weldment Structure and Proper-ties, Prog. in Materials Science, 53 (2008), 6, pp. 980-1023
[3] Thomas, W. M., Nicholas, E. D., Friction Stir Welding for the Transportation Industries, Materials & Design, 18 (1997), 4-6, pp. 269-273
[4] Kalle, S., Application of Friction Stir Welding in the Shipbuilding Industry, Proceedings, Lightweight Construction – Latest Development, London, 2000
[5] Sorensen, C., Nelson, T., Friction Stir Welding of Ferrous and Nickel Alloys, in: Friction Stir Welding and Processing (Eds. R. Mishra, M. Mahoney), ASM International, Russell, O., USA, 2007, pp. 111-120
[6] Buhl, N., et al., Microstructural and Mechanical Investigations of Friction Stir Welded Ti/Ti – and Ti-Alloy/Ti-Alloy-Joints, in: Friction Stir Welding and Processing VII (Eds. R. Mishra, R., et al.) John
Wiley & Sons, Inc., Hoboken, N. J., USA, 2013, pp. 141-149
[7] Park, H., et al., Microstructures and Mechanical Properties of Friction Stir Welds of 60% Cu–40% Zn copper alloy, Materials Science and Engineering: A, 371 (2004), 1-2, pp. 160-169
[8] Bilici, M., et al., The Optimization of Welding Parameters for Friction Stir Spot Welding of High Den-sity Polyethylene Sheets, Materials & Design, 32 (2011), 7 pp. 4074-4079
[9] Lienert, W., et al., Friction Stir Welding Studies on Mild Steel, Wel. Jou., 82 (2003), Suppl., 1, pp. 1S-9S
[10] Benavides, S., et al., Low-Temperature Friction-Stir Welding of 2024 Aluminum, Scripta Materialia, 41 (1999), 8, pp. 809-815
[11] Liu, H., et al., Tensile Properties and Fracture Locations of Friction-Stir-Welded Joints of 2017-T351 Aluminum Alloy, Journal of Materials Processing Technology, 142 (2003), 3, pp. 692-696
[12] Mahoney, W., et al., Properties of Friction-Stir-Welded 7075 T651 Aluminum, Metallurgical and Mate-rials Transactions A, 29 (1999), 7, pp. 1955-1964
[13] Cavaliere, P., et al., Mechanical and Microstructural Behaviour of 2024-7075 Aluminium Alloy Sheets Joined by Friction Stir Welding, International Journal of Machine Tools and Manufacture, 46 (2006), 6, pp. 588-594
[14] Zettler, R., et al., A Study of Material Flow in FSW of AA 2024-T351 and AA 6056-T4 Alloys, Pro-ceedings, 5th International Conference on Friction Stir Welding, Metz, France, 2004
[15] Rai, R., et al., Review: Friction Stir Welding Tools, Science and Technology of Welding and Joining, 16, (2011), 4, pp. 325-342
[16] Reza-E-Rabby, Md., Reynolds, A. P., Effect of Tool Pin Thread Forms on Friction Stir Weldability of Different Aluminum Alloys, Procedia Engineering, 90 (2014), Dec., pp. 637-642
[17] El-Hafez, H., Mechanical Properties and Welding Power of Friction Stirred AA 2024-T35 Joints, Jour-nal of Materials Engineering and Performance, 20 (2010), 6, pp. 839-845
[18] Živković, A., Influence of Friction Stir Welding Tool Geometry on Properties of Welded Joint of Alloys Al 2024 T351, Ph. D. thesis, University of Belgrade, Belgrade, 2011
[19] Radisavljević, I., et al., Influence of Pin Geometry on Mechanical and Structural Properties of Butt Fri c-tion Stir Welded 2024-T351 Aluminum Alloy, Hemijska Industrija, 69 (2015), 3, pp. 323-330
[21] Rajakumar, S., Balasubramanian, V., Correlation between Weld Nugget Grain Size, Weld Nugget Hardness, and Tensile Strength of Friction Stir Welded Commercial Grade Aluminium Alloy Joints, Materials & Design, 34 (2012), Feb., pp. 242-251
[22] Chen, Z., et al., Shear Flow and Formation of Nugget Zone during Friction Stir Welding of Aluminium Alloy 5083-O, Materials Science and Engineering: A, 474 (2008), 1-2, pp. 312-316
[23] Sato, Y., Kokawa, H., Distribution of Tensile Property and Microstructure in Friction Stir Weld of 6063 Aluminum, Metallurgical and Materials Transactions A, 32 (2001), 12, pp. 3023-3031
[24] Mishra, R. S., et al., Friction Stir Welding and Processing VII, John Wiley & Sons, Inc., Hoboken, N. J., USA, 2013
[25] Mijajlović, M., Milčić, D., Analytical Model for Estimating the Amount of Heat Generated during Fric-tion Stir Welding: ApplicaFric-tion on Plates Made of Aluminium Alloy 2024 T351, in: Welding Processes (Ed. R. Kovačević), InTech, Rijeka, Croatia, 2012, pp. 247-274
[26] Russell, M., Schercliff, H., Analytical Modelling of Friction Stir Welding, Proceedings, 7th International Conference Joints in Aluminium, INALCO '98, Cambridge, UK, 1998
[27] Schmidt, H., et al., An Analytical Model for the Heat Generation in Friction Stir Welding, Modelling and Simulation in Materials Science and Engineering, 12 (2004), 1, pp. 143-157
[28] Chao, Y., et al., Heat Transfer in Friction Stir Welding – Experimental and Numerical Studies, Journal of Manufacturing Science and Engineering, 125 (2003), 1, pp. 138-145
[29] Song, M., Kovačević, R., Thermal Modeling of Friction Stir Welding in a Moving Coordinate System and Its Validation, International Journal of Machine Tools & Manufacture, 43 (2003), 6, pp. 605-615 [30] Arora, A., et al., Torque, Power Requirement and Stir Zone Geometry in Friction Stir Welding through
Modeling and Experiments, Scripta Materialia, 60 (2009), 1, pp. 13-16
[31] Khandkar, M., et al., Prediction of Temperature Distribution and Thermal History during Friction Stir Welding: Input Torque Based Model, Science and Technology of Welding and Joining, 8 (2003), 3, pp. 165-174
[32] Nandan, R., et al., Three-Dimensional Heat and Material Flow during Friction Stir Welding of Mild Steel, Acta Materialia, 55 (2006), 3, pp. 883-895
[33] Colegrove, P., et al., Three Dimensional Flow and Thermal Modeling of the Friction Stir Welding Pro-cess, Proceedings, 2nd International Symposium on FSW, Gothenburg, Sweden, 2000
[34] Veljić, D., et al., Heat Generation during Plunge Stage in Friction Stir Welding, Thermal Science, 17 (2013), 2, pp. 489-496
[35] Heurtier, P., et al., Mechanical and Thermal Modelling of Friction Stir Welding, Journal of Materials Processing Technology, 171 (2006), 3, pp. 348-357
[36] Liechty, B., Webb, B., Modeling the Frictional Boundary Condition in Friction Stir Welding, Interna-tionalJournal of Machine Tools and Manufacture, 48 (2008), 12-13, pp. 1474-1485
[37] Yau, Y., et al., Temperature Distribution Study during the Friction Stir Welding Process of Al 2024-T3 Aluminum Alloy, International Journal of Minerals, Metallurgy, and Materials, 20 (2013), 8, pp. 779-787
[38] Veljić, D., et al., Experimental and Numerical Thermo-Mechanical Analysis of Friction Stir Welding of High-Strength Alluminium Alloy, Thermal Science, 18 (2014), Suppl. 1, pp. S29-S38
[39] Olea, C., Influence of Energy Input in Friction Stir Welding on Structure Evolution and Mechanical B e-haviour of Precipitation-Hardening in Aluminium Alloys (AA 2024-T351, AA 6013-T6, and Al-Mg-Sc), Ph. D. thesis, University of Bochum, Bochum, Germany, 2008
[40] Wang, L., et al., Measurement and Simulation of Temperature and Residual Stress Distributions from Friction Stir Welding AA 2024 Al alloy, Materials at High Temperatures, 27 (2010), 3, pp. 167-178 [41] Mijajlović, M., et al., Experimental Studies of Parameters Affecting the Heat Generation in Friction Stir
Welding Process, Thermal Science, 16 (2012), Suppl. 2, pp. S351-S362
[42] ***, ISO 25239-5:2011 Friction Stir Welding – Aluminium – Part 5: Quality and Inspection Require-ments
[43] Mijajlović, M., Investigation and Development of Analytical Model for Estimation of Amount of Heat Generated During FSW, Ph. D. thesis, University of Nis, Nis, Serbia, 2012