The Reliable Integrated Decision for Stock Price
by Multilayer Integration Time-series of Coverage
Reasonability
Chun-Min Hung and Chun-Wu Yeh*Abstract—Owing to globalization, financial operations are not local but comprehensive to all the countries in the world.
In stock markets, many policies such as price limits are made
to intervene between the financial operations so that a
volatility of stock prices is more uncertain than one without
disturbance. It is difficult for investors to buy or sell stocks when technical indicators are inconsistent or the information
is in time. Lack of research seeks for reasonability of the
volatility that is tracking asymptotic trend in different time
periods. Therefore, this study brings up a concept of
multilayer time periods and presents a Trend Tracking based
on Coverage Reasonability method (TTCR) for stock markets
based on a α β/ waveform constructed by investors’ greed
and fear. An obvious feature of the proposed model is to
decide a runaway gap in one wave band of price.
Keyword: Trend Tracking; Trend and Potency Method;
Coverage Reasonability
Introduction
Owing to globalization, the financial operation is not
local but comprehensive to all the countries in the world. In
addition, the speed of cash flow is so fast that it is not an
easy task to handle financial conditions. It is noteworthy
that the loss of financial issues is quite astonishing during
the great depression. The conditions of global stock
markets, especially, are much different from those in
the past due to financial crisis. For stabilizing financial
Manuscript received December 31, 2008. This study was supported by the National Science Council under Grant NSC 97-2410-H-168-017.
C.M. Hung is with the Department of Information Management, Kun Shan University, No 949. Dawan Road, Yung-Kang City, Tainan Hsien, 71023, Taiwan, R.O.C. (e-mail: [email protected])
C.W. Yeh is with the Department of Information Management, Kun Shan University, No. 949. Dawan Road, Yung-Kang City, Tainan Hsien, 71023, Taiwan, R.O.C (phone: +886(6)205-1053; fax: +886(6)205-0545; e-mail: [email protected]).
markets, many governments around the world regulate
some policies to control such a dynamic environment.One
of the familiar policies is a price limit mechanism. The
stock price limits are artificial boundaries set by market
governors to control daily movements of security prices.
Price limits are currently utilized in many stock exchanges
worldwide including: Austria, Belgium, France, Italy, Japan,
Korea, Malaysia, Mexico, Netherlands, Spain, Switzerland,
Taiwan, and Thailand [1]. Hence, price limit mechanisms
indeed affect a substantial portion of capital markets around
the world. Interestingly, very little research is focus on
price limit effects in spite of their significant presence.
References [2]-[4] pointed out reasonable sample sizes are
difficult to obtain. In addition, there are still many
unanswered questions regarding price limit mechanisms.
Harris (1998) stated that this ignorance is a pity that we
need to make proper decisions concerning how to protect
markets. In this paper, we attempt to present a novel
concept on how to make a proper decision (buy/sell) by
investigating stock markets where price limits are
systematically imposed and regularly used in the Taiwan
Stock Exchange [5]. In Taiwan, the policy of stock market
regulates a 7% limit of stock price fluctuation, especially.
The stock price, therefore, will not reflect bearish
information at a time and will display the asymptotic
behavior [6]. Under the condition of asymptotic behavior of
stock prices and 7% price limits, it is difficult for investors
to buy or sell stocks without the reliable and robust
integrated decisions at hand [5]. Furthermore, Chang and
Fan (2008) proposed a novel approach to utilize a wavelet
hierarchical scale-wise decomposition concept, they
reported the 99.1% accuracy of forecast about stock price
variation in Taiwan Stock Exchange index [7](Chang and
Fan, 2008).
Therefore, how to raise the predictive ability from
empirical data in the near future is the main objective of
this study. We proposed the TTCR (Trend Tracking based
on Coverage Reasonability) method that brings up a
concept of coverage reasonability and multilayer
integration in time-series analysis which offers investors a
reliable decision to buy or sell stocks.
The paper is organized as follows. In Section 2, we
review the procedure of trend and potency tracking method
proposed by Li and Yeh. In section 3, we introduce the
trend tracking based on coverage reasonability. Section 4
shows the concept and procedure of TTCR. The last section
is the conclusion of our study.
2 Trend and potency tracking method (TPTM)
Li and Yeh (2008) proposed a method named TPTM
that mainly captures the dependency within a sequence of
time series data and then used it as the basis of formulating
the trend and potency (TP) function as shown in Figure 1
[8]. The TP value of each observation is calculated through
given time stages and the existing data. Its concept is to
seize the current change of information created by the latest
data. Furthermore, the TPTM creates extra information tied
closely with the original data and this will increase the
knowledge for the learning machines and accelerate the
knowledge acquisition. The computational procedure is as
follows:
Step 1: Assume we obtain
n
periods of data; that is to say,the data set at phase
i
consists of{
1,
2,
,
}
n n n
i
x x
"
x
,1, 2,
,
i
=
"
n
and is marked asX
n. Letx
(min: )i be theelement in
X
n with the minimal value andx
(max: )i be theone with the maximal value in
X
n.Step 2: We then calculate the variations
σ
i of the paireddata
(
X
i−1,
X
i)
,i
=
1, 2,
"
,
n
to obtain the increasingor decreasing potencies according to the data sequence. If
i
σ
concerning the paired data(
X
i−1,
X
i)
is positive, itdenotes the trend of data at phase
i
is moving upward. Onthe contrary, the movement of the data at phase
i
isdescending if
σ
i<
0
.Step 3: We offer more weights to the up-to-date data to
represent the intensity of different phases since the latest
datum greatly dominates the occurrence of the oncoming
datum. The importance
w
i of the datum at phasei
equals
i
−
1
,i
=
2, 3,
"
,
n
. For example, at phase 6 theimportance (or the weight) of the datum
w
6= − =
6 1 5
.Step 4: Let
A
i=
σ
i×
w
i,i
=
1, 2,
"
,
n
as an accessionto strengthen the data trend and potency at different phases
by multiplying both weights and variations.
A
i>
0
means the increasing potency (IP), and
A
i<
0
is thedecreasing potency (DP).
Step 5: Find out the central location (CL) of the existing
data using the following equation:
CL
(min: ) (max: )2
i i
x
+
x
=
.This research utilizes the CL as the main point to make the
asymmetric domain range expansion.
Step 6: We compute the average of the increasing potencies
(AIP) and the average of the decreasing potencies (ADP)
and then use them to asymmetrically expand the domain
range. The upper limit of the expanded domain range
is
EDR_UL
=
x
(max: )i+
AIP
, and the lower limit of theexpanded domain range is
EDR_LL
=
x
(min: )i+
ADP
.Thus we acquire a new expanded domain range to explore
extra information of data trend and potency.
Step 7: Through CL, EDR_UL, and EDR_LL, they are
employed to form a triangular TP function. Here we set the
TP value of the CL to be 1, and then we can obtain the TP
values of the existing data through the ratio rule of a
triangle. As figure 1 shows, it demonstrates a simple
instance and the TP value of
x
(min: )i ist
p
p
q
=
p
is the distance between EDR_LL andx
(min: )i , andq
is the distance between
x
(min: )i and CL. The range of theTP value is between 0 and 1, and the TP value represents
the current datum’s intensity close to the CL.
Step 8: If a latest datum appears in the sequence, return to
step 1 and re-compute the TP value concerning each
of the existing data.
1
X
1
X
3
X
2
X
2
X
Time
1
X
t
X
3
X X1 X2
Lower
limit Upper limit
TP value
1 1
X
1
X
3
X
2
X
2
X
Time Time
1
X
t
X
3
X X1 X2
Lower
limit Upper limit
TP value
1
t
X
3
X X1 X2
Lower
limit Upper limit
TP value
1
Figure 1: Data occurrence and the trend and potency
(TP) function
3. Trend Tracking based on Coverage Reasonability
This study provides a novel technique TTCR that is
modified from our previous work, TPTM (only using the
boundary of Trend Tracking; TT), and combines multilayer
time series with a coverage reasonability for the decision of
stock transactions. The TTCR captures the trend boundary
of time series with different periods to generate three
quadratic curves This study applies TT to generate three
quadratic curves according to closing prices and five-day
moving averages. The altitude of quadratic curves is the
distance between the closing price and the five-day moving
average in that day. The changing point appears when the
location of closing price is above or below the five-day
moving average. That is, the stock price will fluctuate in a
certain time period in case that the angle of triangle from
TTCR changes to zero. We will estimate the upper and
lower boundary of stock price through the location and the
time units that closing price finally reached.
4. Coverage Reasonability and Multilayer Integration
Lack of research seeks for reasonability of the
volatility that is tracking asymptotic trend in different time
periods. We propose a concept of coverage reasonability to
realize the improvement of prediction of stock prices. The
definition of reasonability in the boundary detection of
stock price is according to three factors such as financial
policy, business performance, and valuable messages.
We mimic some stylized facts of stock market
dynamics concerning several typical companies in each
industry. The stylized facts of stock market dynamics are as
follows: (1) maximal ceiling/flooring prices over time (2)
great price fluctuation when the first K bar (black/red)
appears, (3) stock prices are with uncertain correlation
between successive daily changes. We observe the factors
mentioned above to design the proposed algorithm (TTCR).
The procedure of TTCR is shown as follows:
Input: time series data
Output: the transaction type (the decision that investors
either buy or sell)
Procedure:
Step 1: to obtain the closing price every five days with the
concept of sliding windows (Ying and Xin-Tian, 2008) and
to calculate an average of upper and lower limits as the new
boundary, that is
1
(
_
_
)
2
TT
=
EDR UL
+
EDR LL
.Step 2: to calculate the distance (
ω
) between the closingprice and TT
Step 3: to obtain a sequence of
ω
along the time horizonand generate a waveform according to each top of
ω
; itwill be a parabolic curve that is alpha-helix (
α
) if thewaveform crosses the zero line; otherwise, it will be a
non-single waveform by the name of beta-strand (
β
).Step 4: to obtain other waveforms in the same way of step 3
based on different time periods such as day, week, month,
and even a certain period of hours; that is the concept of
multilayer integration to cross different periods and
discover sophisticated decision to promote profits of
Step 5: to determine the trend from the pattern of
waveforms in different time periods, and to evaluate the
coverage between the range accumulated from TTCR(AC1)
and the 7% range (AC2) of reasonability regulated by the
financial policy of government.
Step 6: the exception distance (δ ) defines a distance
between the actual price and expected price in a parabolic
track. If δ is positive, it will approach beta-strand.
Otherwise, it will be alpha-helix. The τ parameter is an
angle formed by the slope of the parabolic track. In
addition, τ is related toθ that is an opportunity interval
for cross periods. To calculate the range of θ from the
maximum position of
ω
is to estimate the number of timeunits (T ). Through the calculation of coverage between
AC1 and AC2 is to estimate the increasing/decreasing
potency of stock prices.
Step 7: the criteria is the percentage of increase/decrease
that is a stepwise parabolic function with three parametric
points (
TS
LL,TS
UL, andTS
TT ).TS
ULandTS
LL arethe upper and lower limit of trend and potency function,
separately.
TS
TT is the largest distanceω
of thewaveform.
In that the direction of bias in different periods may
not be the same, the strategy of cross-period is to look
ahead/backward concerning the possible trend of stock
price. Through the calculation of exception distance (δ),
we can estimate the opportunity interval (θ) for stock price.
This offers a correct direction for investors to make the
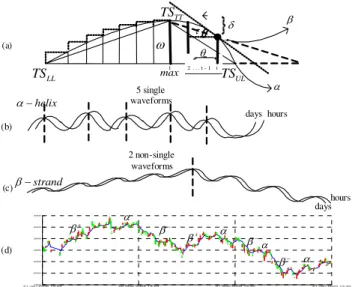
decision of buy/sell stocks as shown in Fig. 2 (a), the
starting point of runaway gap [9] is decided by detecting
exception distance (δ). The runaway gap is a stock gap
that occurs within the investors’ emotional context of a
price move. When the runaway gap occurs, they either
become greedy to chase prices along the beta-strand (
β
) or fear to exit prices along the alpha-helix (α
).In Fig. 2 (b), an alpha-helix (
α
) waveform that is atrend pattern of stock price biases compared to bench-mark
displays a coiled structure within price biases (
+ − + −
).This structure that integrates patterns in different periods
such as time period integration in hours or days,
demonstrated in Fig. 2 (b) and (c), influences the range of
stock price. In Fig. 2 (c), a beta-strand waveform is an
anti-parabolic curve of price biases. Note that Fig. 2 (b) and
(c) are only used to demonstrate the concept of
accumulated waveforms to display the pattern of price
fluctuation. Actually, the true fluctuation of price is shown
in Fig2. (d) that is mapping the terminology (alpha-helix
(
α
) and beta-strand (β
)) proposed in this study. In thatthe pattern of an alternation of ups and downs in price
biases might increase successive (parabolic/anti-parabolic)
waveforms (
β β β β
+ + + + orβ β β β
− − − − ). If anintegrated decision of different periods is inclined to a
beta-strand waveform, the stock price will rise or descend
continually. If their decisions correctly match the two
waveforms mentioned above, investors would obtain
appreciable profits. In addition, the size of a sliding
window [10] is a cardinality of dataset to get in and out of
the latest and the oldest stock price data.
5. Conclusion
This paper applies a novel concept to design TTCR
and then searches the cumulative distance of the volatility
is consistent with an asymptotic α β/ waveform. We
think that having a splendid consciousness of what is going
on in stock markets is quite important. Our method helps
investors to develop better strategies in stock markets. One
may, for instance, use the proposed model as a consulting
tool and make proper decisions in stock markets to reduce
the risk of investment. The future study will seek for
estimating a more precise time span for early warning of
21-Jan-2008 13:29150 22-May-2008 13:29 21-Sep-2008 13: 30 21-Jan-2009 13:30 200
250 300 350 400 450
LL
TS TSUL
TT
TS
max
α β δ
θ τ
1 2 . . . t - 1 t ω
(a)
α
β− α
α β+
β− β− α
β+
(d)
β −strand
2 non-single waveforms
dayshours (c)
α−helix
5 single waveforms
days hours (b)
Figure 2: Demonstration of single waveform and
non-single waveform
Reference
[1] Roll, R., 1989. Price volatility, international market
links, and their implications for regulatory policies.
Journal of Financial Services Research 3, 211-246.
[2] Kuhn, B.A., Kuserk, G.J., Locke, P., 1991. Do circuit
breakers moderate volatility? Evidence from October
1989. Review of Futures Markets 7, 426-434.
[3] Harris, L., 1998. Circuit breakers and program
trading limits: what have we learned? In: Litan,
R.E.,Santomero, A.M. (Eds.), Brookings-Wharton
Papers on Financial Services. Brookings Institutions
Press, Washington, DC, pp. 17-63.
[4] Jung, H. C., 2006. Small sample size problems and
the power of the test in the event study methodology,
Asia-pacific Journal of Financial Studies 35(3), pp.
107-140.
[5] Chang, C. H., Hsieh, S. L., 2008. Is the daily price
limit of the Taiwan stock exchange effective?
Fundamentals of listed stocks and investors'
perception of fair price. Asia-pacific Journal of
Financial Studies 37(4), pp. 675-726.
[6] Liu, Y. H., Gopikrishnan, P., Cizeau, P., et al., 1999.
Statistical properties of the volatility of price
fluctuations, Physical Review E 60(2), pp.
1390-1400.
[7] Chang, P. C., Fan, C. Y., 2008. A Hybrid System
Integrating a Wavelet and TSK Fuzzy Rules for Stock
Price Forecasting. IEEE Transactions on Systems,
Man, and Cybernetics, Part C: Applications and
Reviews. 38(6) pp. 802 - 815.
[8] Li, D. C., Yeh, C. W., 2008. A non-parametric
learning algorithm for small manufacturing data sets.
Expert Systems With Applications 34(1), pp.
391-398.
[9] Neftci, S. N., 1991. Naive trading rules in financial
markets and Wiener-Kolmogorov prediction theory: a
study of "technical analysis", Journal of Business
64(4), pp. 549-571.
[10] Ying, Y., Xin-Tian, Z. 2008. Multifractal description
of stock price index fluctuation using a quadratic
function fitting. Physica A-statistical Mechanics and