Brazilian Microwave and Optoelectronics Society-SBMO received 10 Apr 2017; for review 13 Apr 2017; accepted 05 Aug 2017 Brazilian Society of Electromagnetism-SBMag © 2017 SBMO/SBMag ISSN 2179-1074
Abstract—A novel time reversal approach for the point target imaging is proposed in this paper. This method requires only single measurement by the time reversal array, and it exploits the space-frequency decomposition plus the rotation invariance of the signal subspace for the target detecting. Numerical simulations are carried out to validate the imaging performance of the method for single target located at different positions in homogenous and continuous random medium respectively. The results indicate that the proposed method performs better than the conventional signal subspace based space-frequency algorithm both in imaging resolution and efficiency.
Index Terms—time reversal, space-frequency decomposition, ESPRIT algorithm, target imaging
I. INTRODUCTION
Time reversal (TR) techniques derive from acoustics [1] and they are introduced in the
electromagnetic fields later [2]. They involve physical or synthetic retransmission of signals received
by a TR antenna array in a time reversed fashion. These techniques exploit the invariance of the wave
equation and enable the back-propagated signals to focus around the original source or target location.
Due to the super resolution ability and self-adaptive focusing property [3], time reversal has a wide
range of applications such as medical microwave imaging, long distance wireless communication,
spatial power combining, etc.
The time reversal mirror (TRM) method back-propagates the TR signals directly and it detects the
target by scanning the field value at each point in the probed domain [4]. The iterative TRM (ITRM)
method conducts the signal reception, reversal and retransmission iteratively and makes the signals
focus on the strongest target [5]. These methods implement time reversal in the time domain directly
and result in an increase of the cost for signal processing and storage. Moreover, they are unable to
detect weaker targets in multiple targets scenario.
The methods based on the TR operator obtained from the multistatic data matrix (MDM) is more
effective for target imaging in complex environment. The singular value decomposition (SVD) of the
TR operator lays the foundation of the decomposition of the TR operator (DORT) [6] and the TR
multiple signal classification (TR-MUSIC) [7]. Eigenvectors of the signal subspace are utilized in the
DORT to form the retransmitted signals and selective imaging for different targets can be achieved by
Time Reversal Imaging Based on the
Space-Frequency ESPRIT
Tong Mu and Yaoliang Song
Brazilian Microwave and Optoelectronics Society-SBMO received 10 Apr 2017; for review 13 Apr 2017; accepted 05 Aug 2017 Brazilian Society of Electromagnetism-SBMag © 2017 SBMO/SBMag ISSN 2179-1074
this method. The TR-MUSIC utilizes the noise subspace which is orthogonal to the signal subspace
and it can detect multiple targets synchronously. However, to obtain the MDMs the probing signals
need to be transmitted by each antenna in sequence and the target responses are recorded by all the
antennas, making it time-consuming and difficult to detect the moving targets as well as active
sources.
The methods based on the decomposition of the space-frequency MDM (SF-MDM) can overcome
these defects [8], [9]. The SF-DORT conducts SVD to the SF-MDM obtained from single
measurement to yield singular values and singular vectors. The left singular vectors span the signal
subspace which encodes the target location in the form of the relative phase shifts among the
antennas. The back-propagated signals for selective target imaging are constructed by using the left
singular vectors and the frequency spectrum of the probing signal. The estimation of signal
parameters via rotation invariance techniques (ESPRIT) exploits the rotation invariance of the signal
subspace to estimate the orientation of targets [10]. It simplifies the procedure of pseudo-spectral
searching and reduces the calculation costs [11].
In this paper, we propose a new space-frequency ESPRIT (SF-ESPRIT) method for point target
imaging. The SF-MDM is obtained from only single measurement by TR array and then SVD is
conducted to the matrix to yield the left singular vectors. Next, the TR array, the corresponding left
singular vectors and the background Green functions are divided into two groups based on the
subspace invariant principle of ESPRIT. At last, the rotation matrices are solved and the imaging
function is given. The performance of the proposed method is examined by targets imaging
simulations both in homogenous and continuous random media. Simulation results indicate that the
SF-ESPRIT has higher imaging resolution than SF-DORT and it is also faster than SF-DORT thus it
further improves the real-time capability for TR imaging.
II. TR IMAGING BASED ON THE SF-ESPRIT
We assume that there is a TR array consisting of N antennas, where N is even. And there are P
targets in the probed domain, with P<N. The probing signal is transmitted by one antenna in the TR
array, and all the antennas record the target response only once. Then the received signals are
transformed into the frequency domain, forming the SF-MDM as follows:
1 1 1 2 1
1 2 1 2 ( ) ( ) ( ) ( ) ( ) ( ) ( ) ( ) ( ) M
n n n M
N N N M
k k k
k k k
k k k
K (1)The nth row of the matrix represents the sampling sequence in frequency domain of the signal
received by the nth antenna, with 1 n N, and M is the number of sampling points. For each
Brazilian Microwave and Optoelectronics Society-SBMO received 10 Apr 2017; for review 13 Apr 2017; accepted 05 Aug 2017 Brazilian Society of Electromagnetism-SBMag © 2017 SBMO/SBMag ISSN 2179-1074
to K, we obtain that:
H
K = UΛV (2)
where Λ is a N M real diagonal matrix, and the elements on the main diagonal of Λ are singular
values. U is a NN matrix, and each column of U is a left singular vector, forming an
orthonormal set which spans the antenna location space. V is a MM matrix, and each column of
V is a right singular vector, forming an orthonormal set which spans the signal frequency space.
Here U represents the spatial relationship between the TR array and the targets.
In fact, K can be seen as a mapping from the signal frequency space to the antenna space:
p
p pKV U (3)
where Vp is a M1 right singular vector,
p is the pth singular value, and Up is a N1 leftsingular vector with p1,...,P, corresponding to P non-zero singular values. Therefore, Up spans
the signal subspace, and Up' with p' P 1,...,N spans the noise subspace. For certain Up, the N
elements contain the relative phase shift information among the antennas in TR array. If the probing
signal is defined as s t( ) and the frequency spectrum is S( )
, the TR signal retransmitted by the TRarray can be obtained by multiplying S( )
by Up, which is equivalent to conducting the amplitudeand phase weighting to the probing signal:
( ) ( )
TR
pS
r U (4)
Back propagating
r
TR( )
to the probed domain, selective imaging for different targets can beachieved by choosing different Up to construct the back-propagated signal.
For target imaging, the prior knowledge of the background Green’s function at each searching point
s
X
in the probed domain is required. We defineG
(
X X
s,
n, )
as the background Green’s function,where
X
n is the location of the nth antenna. Considering all the antennas, we have:T 1
( s, )
[ (G s, , ),..., (
G s, N, )]
g X X X X X (5)
(
s, )
g X
contains the spatial information of each searching point, and it is dependent on the angularfrequency
. The imaging pseudo-spectral of SF-DORT is defined as:(
)
(
, ),
( )
SF DORT s
s
TR
d
D
X
g X
r
(6)where
denotes the inner product.The ESPRIT exploits the rotation invariance of the signal subspace which is derived from the
translation invariance of the antenna array. Particularly, an array is divided into two subarrays which
contain identical number of antennas. Each corresponding element in the two subarrays has same
spatial displacement, which means that the rotation matrix is the only difference between the two
Brazilian Microwave and Optoelectronics Society-SBMO received 10 Apr 2017; for review 13 Apr 2017; accepted 05 Aug 2017 Brazilian Society of Electromagnetism-SBMag © 2017 SBMO/SBMag ISSN 2179-1074
both comprise
2
N
antennas. Then the left singular vector corresponding to the pth target is divided
as follows: 1 2 p p p
U
U
U
(7)where Up1 and Up2 are 1 2
N
vectors. Similarly, the background Green’s function is divided as
follows: 1 2 ( , ) ( , ) ( , ) s s s
g X g Xg X (8)
where
g X
1(
s, )
andg X
2(
s, )
are also 1 2N
vectors. Then two
2 2
NN
diagonal matrices
Φ
Uand Φg are introduced and satisfy that:
1 2
p U p
U Φ U (9)
1( s, )
g 2( s, )
g X Φ g X (10)
Therefore, if we let
i and
i be the ith element on the main diagonal ofΦ
U and Φg respectively,the imaging pseudo-spectral of SF-ESPRIT is formed by calculating the relative error between
i andi
at each searching point in the probed domain:1 / 2 1 ( ) ( ) N
i s i
SF ESPRIT s
i i
XD X (11)
When the searching point happens to be the target position, the relative error in Equation (11) tends
to zero, and the pseudo-spectral reaches the peak. If the pseudo-spectral is calculated for all searching
points, the imaging for the pth target is achieved. The imaging performance depends on the contrast
between the relative error calculated at the target position and non-target positons. For realizing high
resolution, we revise the background Green’s function by
| | ( , , )=
| | 4 | |
p n
j
p n n
p p n
e G
X X X XU X X (12)
where
is the wave number, and |Unp |is the amplitude of the nth element of Up. Xp andX
n arethe positions of the pth target and the nth antenna respectively.
III. RESULTS AND DISCUSSIONS
Figure 1 shows the model used in the imaging experiments. We consider single target imaging in
both homogenous and random medium. We use the finite difference time domain (FDTD) method to
Brazilian Microwave and Optoelectronics Society-SBMO received 10 Apr 2017; for review 13 Apr 2017; accepted 05 Aug 2017 Brazilian Society of Electromagnetism-SBMag © 2017 SBMO/SBMag ISSN 2179-1074
2m and the point target with relative permittivity of
r
8.3
is embedded in the media. The relativepermittivity of the homogenous media is set as
m=2.9
. The random media is modeled by spatiallyfluctuating permittivity
( )r
m
f( )r , where r xxˆyyˆ is the spatial position [12]. Thefluctuating term
f( )r is the zero-mean Gaussian random variable with Gaussian correlationfunction given by:
* 2 2 2
1 2 1 2 1 2 1 2
( ) f( ) f( ) exp( (| | | | ) / s)
C r r
r
r
x x y y l (13)where
is the variance andl
s is the correlation length. The probing signal is a modulated Gaussianpulse with center frequency of 600MHz, and the number of sampling points is set as 2000. The linear
TR array contains six antennas located at (0.05m, 0.5m), (0.05m, 0.64m), … , (0.05m, 1.2m)
respectively. They are separated by 0.14m which is half of the wave length corresponding to the
center frequency of the probing signal in homogenous media. The FDTD grid size is set as
1cm
x y
, and the perfectly matched layer (PML) is applied as the boundary condition to avoid
the wave reflection on the boundary of the probed domain.
Fig. 1. Illustration of the TR array and the target.
The simulation is carried out for the target located at (0.53m, 1.26m) and (0.91m, 0.39m) in
homogenous and random media respectively. The pulse is transmitted by the 3th antenna and the
scattered signals are recorded by all the antennas only once. The received signals are used to construct
the SF-MDM according to Equation (1). Applying SVD to the SF-MDM, we obtain the singular
values and the left singular vector
U
1. Next we divide the TR array into two subarrays. The firstsubarray contains the 1st, 2nd and 3rd antenna, and the second one contains the 4th, 5th and 6th
antenna. Then the background Green’s function and
U
1 are divided into two groups corresponding tothe two subarrays. At last the rotation matrices are solved and they are utilized to calculate the
pseudo-spectrum according to Equation (11). The imaging results of the SF-ESPRIT in homogenous
Brazilian Microwave and Optoelectronics Society-SBMO received 10 Apr 2017; for review 13 Apr 2017; accepted 05 Aug 2017 Brazilian Society of Electromagnetism-SBMag © 2017 SBMO/SBMag ISSN 2179-1074
pseudo-spectrums are normalized to 1, and the actual position of the target is marked with “○” in each
figure.
(a) (b)
(c) (d)
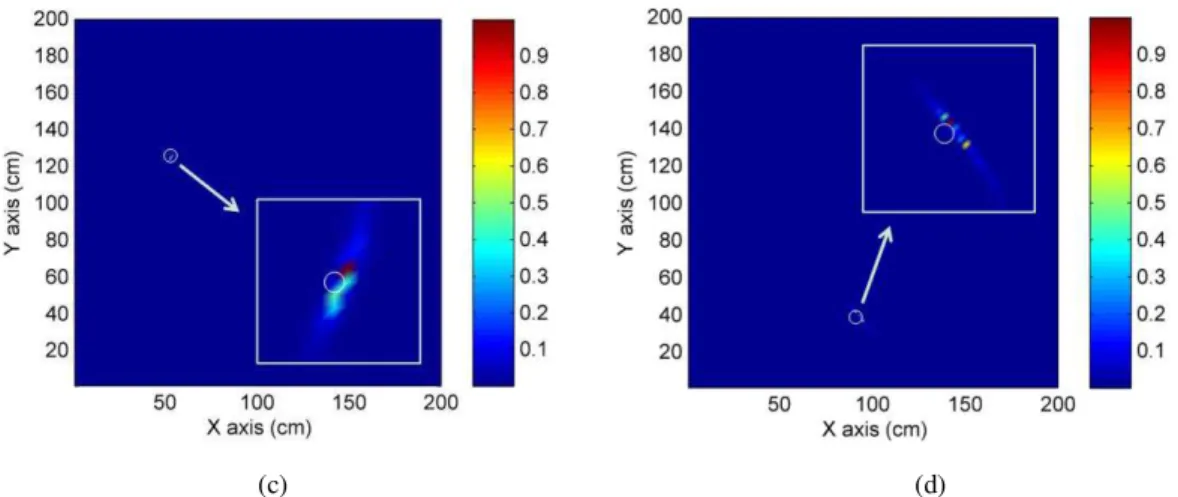
Fig. 2. The imaging results in homogeneous media. (a) The SF-DORT image of the target located at (0.53m, 1.26m); (b) The SF-DORT image of the target located at (0.91m, 0.39m); (c) The SF-ESPRIT image of the target located at (0.53m, 1.26m);
(d) The SF-ESPRIT image of the target located at (0.91m, 0.39m).
(a) (b)
Brazilian Microwave and Optoelectronics Society-SBMO received 10 Apr 2017; for review 13 Apr 2017; accepted 05 Aug 2017 Brazilian Society of Electromagnetism-SBMag © 2017 SBMO/SBMag ISSN 2179-1074
(a) (b)
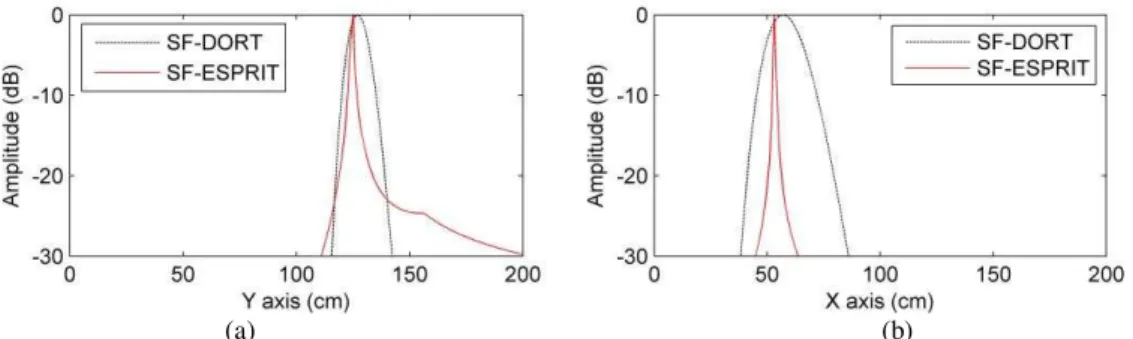
Fig. 4. Resolution comparisons between SF-DORT and SF-ESPRIT for the target located at (0.91m, 0.39m). (a) Lateral resolution; (b) Longitudinal resolution.
From Fig. 2 we can see that both SF-DORT and SF-ESPRIT can give accurate location of the
target. However, the SF-DORT image has blade shape and long trailing which are not observed in the
SF-ESPRIT image. Lateral and longitudinal resolution of the two methods are given in Fig. 3 and Fig.
4 for different target positions (normalized to dB). It can be observed that SF-ESPRIT has much
higher resolution than SF-DORT in both lateral and longitudinal.
If the TR array is divided as follows: the first subarray contains the 1st, 2nd and 3rd antenna and the
second one contains the 6th, 5th and 4th antenna, rotation matrices which are different from Equation
(9) and (10) can be obtained. Then the new rotation invariance is exploited to calculate the
pseudo-spectral. We revise the imaging function by multiplying the new pseudo-spectral by the old one, and
the imaging results of the revised SF-ESPRIT are shown in Fig. 5. It can be seen from Fig. 5 (a) and
(b) that the revised SF-ESPRIT has narrower and sharper pseudo-spectral at the target position, which
provides better focusing performance. Figure 5 (c) and (d) show the imaging results of the target
located at (0.53m, 1.26m) and (0.91m, 0.39m) respectively based on the revised SF-ESPRIT, and the
partial figure is zoomed in to show the focusing details clearly.
In addition, the Monte-Carlo simulations are carried out for 1000 times on the PC with CPU
frequency of 3.3GHz and RAM of 6GHz. It turned out that the SF-DORT takes 2995ms in average,
while the SF-ESPRIT takes 1143ms in average. Therefore the SF-ESPRIT has higher detecting
efficiency and it further improves the real-time capability for TR imaging.
Brazilian Microwave and Optoelectronics Society-SBMO received 10 Apr 2017; for review 13 Apr 2017; accepted 05 Aug 2017 Brazilian Society of Electromagnetism-SBMag © 2017 SBMO/SBMag ISSN 2179-1074
(c) (d)
Fig. 5. (a) Three-dimensional pseudo-spectrum given by the SF-ESPRIT; (b) Three-dimensional pseudo-spectrum given by the revised ESPRIT; (c) The revised ESPRIT image of the target located at (0.53m, 1.26m); (d) The revised
SF-ESPRIT image of the target located at (0.91m, 0.39m).
Then we consider the scenario of the random media where the fluctuating parameters are set as
=0.03
andl
s
8
x
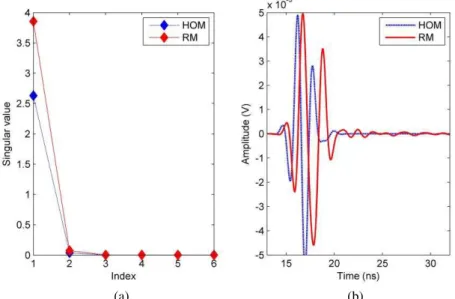
. The distribution of singular values gained in homogeneous and random mediaare shown in Fig. 6 (a). It can be seen that there is only one large (non-zero) singular value in both the
mediums as there is a single target. The target responses recorded by the 5th antenna are shown in
Fig. 6 (b). It can be seen that there are more ripples in the response recorded in random media than
homogeneous media. Figure 7 shows the imaging results of SF-DORT and SF-ESPRIT in random
media. Similarly, both the two methods can locate the target precisely in random media. The
SF-DORT shows stronger robustness as the resolution is almost as same as that in homogenous media.
The resolution of SF-ESPRIT declines to some degree in random medium. It is because that the
multiple scattering caused by the random medium deviates the phase of each element of
U
1 whichcontains the information of the relationship between the target and the TR array. Thus, the rotational
invariance is weakened and the imaging resolution drops off.
For evaluating the performance of the SF-ESPRIT in random media comprehensively, we change
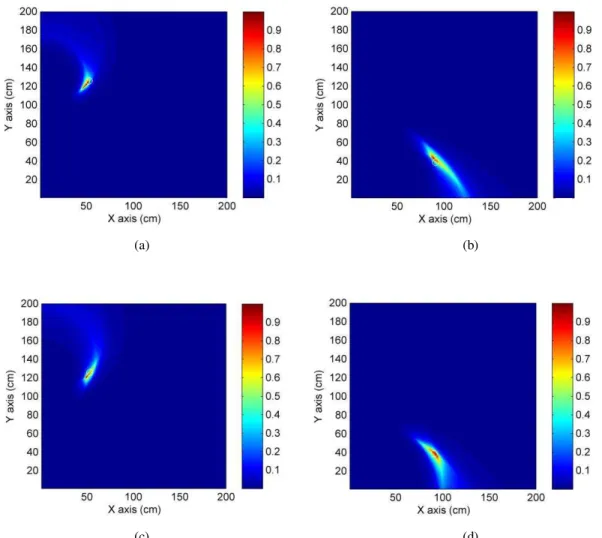
the fluctuating parameters and the results are shown in Fig. 8. Figure 8 (a) and (b) show the images of
the target with
=0.06 andl
s
8
x
, and Fig. 8 (c) and (d) show the images of the target with=0.03
andl
s
20
x
. The results indicate that larger variance or correlation length may causelower imaging resolution, but the target can still be located accurately by SF-ESPRIT. Furthermore,
Brazilian Microwave and Optoelectronics Society-SBMO received 10 Apr 2017; for review 13 Apr 2017; accepted 05 Aug 2017 Brazilian Society of Electromagnetism-SBMag © 2017 SBMO/SBMag ISSN 2179-1074
(a) (b)
Fig. 6. (a) The distribution of singular values; (b) Target responses received by the 5th antenna.
(a) (b)
(c) (d)
Fig. 7. The imaging results in random media. (a) The DORT image of the target located at (0.53m, 1.26m); (b) The SF-DORT image of the target located at (0.91m, 0.39m); (c) The SF-ESPRIT image of the target located at (0.53m, 1.26m); (d)
Brazilian Microwave and Optoelectronics Society-SBMO received 10 Apr 2017; for review 13 Apr 2017; accepted 05 Aug 2017 Brazilian Society of Electromagnetism-SBMag © 2017 SBMO/SBMag ISSN 2179-1074
(a) (b)
(c) (d)
Fig. 8. The SF-ESPRIT imaging results in different random media. (a) The image of the target located at (0.53m, 1.26m) with =0.06 and ls 8 x; (b) The image of the target located at (0.91m, 0.39m) with =0.06 andls 8 x; (c) The image of the target located at (0.53m, 1.26m) with =0.03 andls 20 x; (d) The image of the target located at (0.91m,
0.39m) with =0.03 andls 20 x.
IV. CONCLUSIONS
A new TR imaging method based on the SF-ESPRIT is proposed in this paper. The method requires
only single measurement by the TR array for the SF-MDM acquisition and the imaging function is
constructed based on the rotation invariance of the signal subspace. By using a linear TR array
containing only six antennas, we achieve high resolution imaging for the point target located at
different positions. The imaging resolution in homogenous media can be further promoted by using
the revised imaging function. The comparisons of the imaging results between ESPRIT and
SF-DORT indicate that the SF-ESPRIT has better imaging performance in both homogenous and random
media and also has faster speed than the conventional SF-DORT. Therefore, the SF-ESPRIT has an
application potential for microwave tumor detection, buried target localization, moving target
tracking, etc. Further researches include extending the method to multiple targets detection and
Brazilian Microwave and Optoelectronics Society-SBMO received 10 Apr 2017; for review 13 Apr 2017; accepted 05 Aug 2017 Brazilian Society of Electromagnetism-SBMag © 2017 SBMO/SBMag ISSN 2179-1074
ACKNOWLEDGMENT
This work was supported by the National Natural Science Foundation of China under Grant
61271331 and Grant 61571229.
REFERENCES
[1] Fink M, Cassereau D, Derode A, et al. Time-reversed acoustics[J]. Reports on progress in Physics, 2000, 63(12): 1933. [2] Lerosey G, De Rosny J, Tourin A, et al. Time reversal of electromagnetic waves[J]. Physical review letters, 2004,
92(19): 193904.
[3] Lerosey G, De Rosny J, Tourin A, et al. Focusing beyond the diffraction limit with far-field time reversal[J]. Science, 2007, 315(5815): 1120-1122.
[4] Kosmas P, Rappaport C M. Time reversal with the FDTD method for microwave breast cancer detection[J]. IEEE Transactions on Microwave Theory and Techniques, 2005, 53(7): 2317-2323.
[5] Zhu X, Zhao Z, Yang W, et al. Iterative time-reversal mirror method for imaging the buried object beneath rough ground surface[J]. Progress In Electromagnetics Research, 2011, 117: 19-33.
[6] Yavuz M E, Teixeira F L. Full time-domain DORT for ultrawideband electromagnetic fields in dispersive, random inhomogeneous media[J]. IEEE Transactions on Antennas and Propagation, 2006, 54(8): 2305-2315.
[7] Ciuonzo D, Romano G, Solimene R. Performance analysis of time-reversal MUSIC[J]. IEEE Transactions on Signal Processing, 2015, 63(10): 2650-2662.
[8] Yavuz M E, Teixeira F L. Space–frequency ultrawideband time-reversal imaging[J]. IEEE Transactions on Geoscience and Remote Sensing, 2008, 46(4): 1115-1124.
[9] Zhong X, Liao C, Lin W. Space-Frequency Decomposition and Time-Reversal Imaging[J]. IEEE Transactions on Antennas and Propagation, 2015, 63(12): 5619-5628.
[10]Roy R, Kailath T. ESPRIT-estimation of signal parameters via rotational invariance techniques[J]. IEEE Transactions on acoustics, speech, and signal processing, 1989, 37(7): 984-995.
[11]Gao W, Wang X H, Wang B Z. Time-reversal ESPRIT imaging method for the detection of single target[J]. Journal of Electromagnetic Waves and Applications, 2014, 28(5): 634-640.