Annales
Geophysicae
E-region echo characteristics governed by auroral arc
electrodynamics
S. E. Milan1, N. Sato2, M. Lester1, Y. Murata3, Y. Shinkai3, H. Doi4, H. U. Frey5, and T. Saemundsson6
1Department of Physics and Astronomy, University of Leicester, Leicester LE1 7RH, UK 2National Institute of Polar Research, Tokyo 173-8515, Japan
3Graduate University for Advanced Studies, Tokyo 173-8515, Japan 4Tokai University, Kanagawa 259-1292, Japan
5Space Sciences Laboratory, University of California at Berkeley, California, USA 6Science Institute, University of Iceland, Reykjavik IS-107, Iceland
Received: 23 October 2002 – Accepted: 13 February 2003
Abstract. Observations of a pair of auroral arc features by two imagers, one ground- and one space-based, al-lows the associated field-aligned current (FAC) and elec-tric field structure to be inferred. Simultaneous observations of HF radar echoes provide an insight into the irregularity-generating mechanisms. This is especially interesting for the E-region echoes observed, which form the focus of our analysis, and from which several conclusions can be drawn, summarized as follows. Latitudinal variations in echo char-acteristics are governed by the FAC and electric field back-ground. Particularly sharp boundaries are found at the edges of auroral arcs. Within regions of auroral luminosity, echoes have Doppler shifts below the ion-acoustic speed and are pro-portional to the electric field, suggesting scatter from gra-dient drift waves. Regions of downward FAC are associ-ated with mixed high and low Doppler shift echoes. The high Doppler shift component is greatly in excess of the ion-acoustic speed, but seems to be commensurate with the driv-ing electric field. The low Doppler shift component appears to be much depressed below expectations.
Key words. Ionosphere (ionospheric irregularities; electric fields and currents)
1 Introduction
Previous studies have demonstrated the existence of a num-ber of echo types in HF radar backscatter from the E-region (Villain et al., 1987, 1990; Hanuise et al., 1991; Milan and Lester, 2001; Milan et al., 2003) and have also investigated the relationship between E-region backscatter and visual au-roral forms (Milan et al., 2000, 2001, 2002). In this study we present observations of an auroral feature made from above and below, that is by a ground- and a space-based imager si-multaneously, and show the remarkable association with HF radar E-region echoes. Not only does this allow the associ-Correspondence to:S. E. Milan
ation between echo types and auroral forms (precipitation) to be elucidated, but it also reveals the relationship between electric field and echo characteristics, as we are able to ap-proximate the electrodynamics of the arc system under in-vestigation.
2 Experimental arrangement
The CUTLASS Iceland HF radar, which forms part of the international SuperDARN radar network (Greenwald et al., 1995), has been used extensively to study the characteris-tics of E-region backscatter, due to its favourable viewing geometry. In such studies, the observing mode is optimized for E-region investigation by reducing the gate length to a minimum and concentrating soundings to ranges close to the radar. This “myopic” configuration has been described in de-tail previously (e.g. Milan and Lester, 2001), so here we just summarize the key points. The radar sounds 16 beams in se-quence, taking approximately 1 min to complete a scan. Each beam is gated into 75 cells of 15 km in length, with a range to the first gate of 180 km; hence, the maximum sounded range is 1305 km. The radar location and field-of-view are shown in Fig. 1. Routine analysis of the obtained auto-correlation functions provides backscatter power, spectral width, and Doppler shift of the echo spectra, and a measure of the el-evation angle of the incoming signals, from which the alti-tude of the scattering volume can be estimated. In addition, the “stereo” upgrade of the radar undertaken in late 2001 al-lows the radar to sound at two different frequencies simul-taneously. The “stereo myopic” mode, which was operating during the period of study, transmits continuously at 10 MHz, while also cycling through 8, 12, 14, 16 and 18 MHz in con-secutive scans, as described by Milan et al. (2003). In this paper, we concentrate mainly on the 10-MHz observations.
1568 S. E. Milan et al.: E-region echo characteristics governed by auroral arc electrodynamics
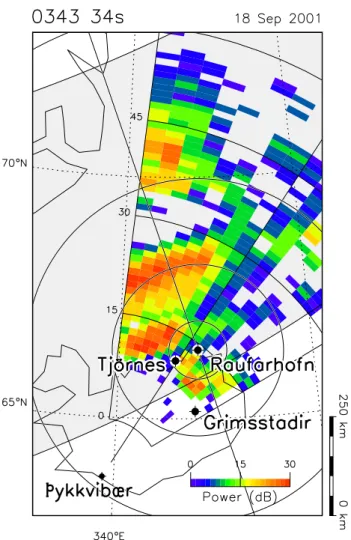
Fig. 1. A map showing the vicinity of Iceland and southeast-ern Greenland, indicating the location of the Pykkvibær radar and the three all-sky camera sites. The radar field-of-view is mapped assuming a backscatter altitude of 110 km. Colour-coded is the backscatter power from the radar scan starting 03:43:34 UT on 18 September 2001. The projection of the Raufarhofn ASC field-of-view is shown, the four concentric circles marking the locii of zenith angles of 30◦, 60◦, 75◦and 85◦mapped to an altitude of 110 km. The geomagnetic meridian employed to produce keograms is also shown. Superimposed is the statistical auroral oval for aKp level
of 3.
as the most northerly of the trio, was best placed for the au-roral conditions experienced during the interval of interest, and it is this imager on which we focus our attention. Com-parison of the radar and auroral observations was achieved using the method described by Milan et al. (2002). Thus, we produced a keogram of the ASC measurements along the geomagnetic meridian passing through the zenith of the ASC field-of-view. This meridian is indicated in Fig. 1, along with the locii of zenith angles 30◦, 60◦, 75◦and 85◦. By mapping the ASC meridian into the radar field-of-view to an altitude of 110 km we are also able to produce “radar keograms” to allow for a direct comparison between the auroral and echo characteristics.
Finally, to allow for a more global overview of the
auro-ral configuration present during the interval of interest we employed images from the Far Ultraviolet Wideband Imag-ing Camera (FUV/WIC) on board the IMAGE spacecraft (Mende et al., 2000a, b). These images were obtained every 2 min, with an exposure time of 10 s. The imager is sensi-tive to emissions in the FUV wavelength band 140-190 nm, which comprises Lyman-Birge-Hopfield (LBH) lines pro-duced by electron impact excitation of N2.
3 Observations
On the night of 18 September 2001, the clouds parted for a brief interval between 02:00 and 04:00 UT. It is the auroral and radar observations from this period that we investigate in this study. Figure 1 shows the backscatter power recorded by the radar during the scan starting at 03:43:34 UT. In the near-range portion of the field-of-view (closer than range gate 30), several high power features are seen to lie along the L-shell direction, that is parallel to the edges of the sta-tistical oval, shown for aKp of 3. Such L-shell-aligned fea-tures are characteristic of E-region backscatter (e.g. Milan and Lester, 2001), and indeed, measurements of the eleva-tion angles of the echoes indicate that they originate from E-region altitudes. At further ranges, echoes are received from the F-region, and here, L-shell-aligned features are not so obvious.
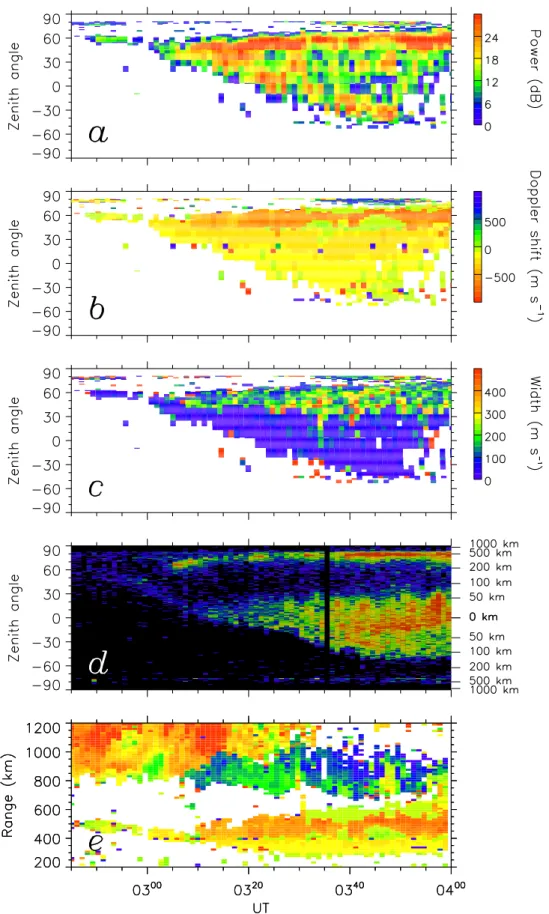
Figure 2 shows three radar keograms (panels (a-c)) from the ASC meridian shown in Fig. 1, indicating backscatter power, Doppler shift, and spectral width, respectively, and the ASC keogram (panel (d)), from the period 02:45 to 04:00 UT. By their very nature, keograms are plotted as a function of zenith angle along the ASC meridian. This is ideal for comparison of the radar and auroral observations, but does tend to squash features at high zenith angles. To allow for a less spatially-distorted view of the radar observa-tions, panel (e) shows the Doppler shift measurements as a function of range along beam 3 of the radar; the range here is the latitudinal distance from the radar.
First, we describe the auroral observations (Fig. 2d). Very little luminosity is observed along the meridian prior to 03:00 UT. After this time an auroral feature appears near a zenith angle of 45◦, and subsequently progresses equator-wards over the zenith of the camera and eventually broadens to cover the zenith angle range−50◦to 30◦. Simultaneously,
1570 S. E. Milan et al.: E-region echo characteristics governed by auroral arc electrodynamics
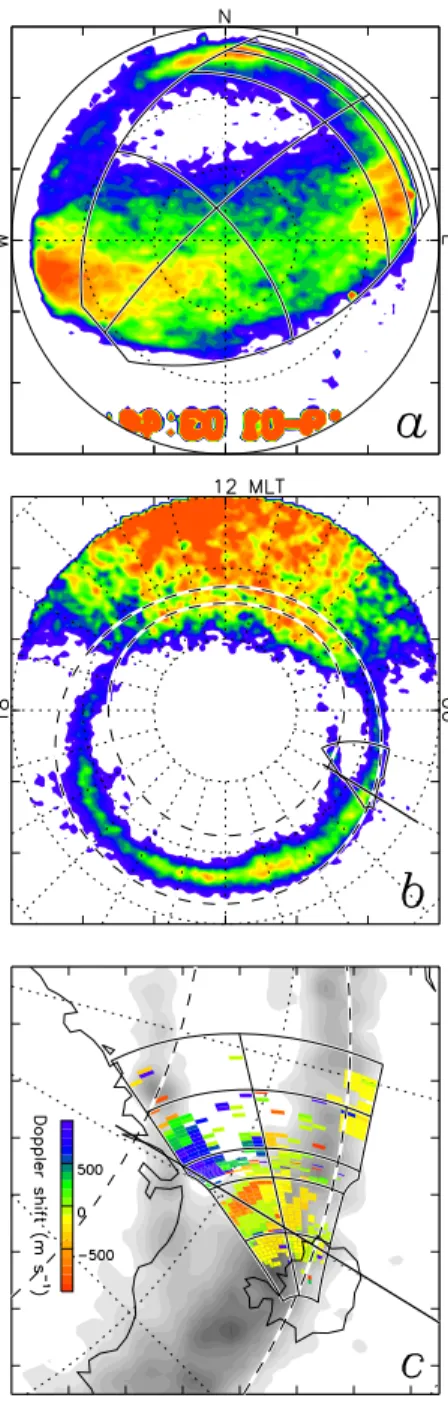
Fig. 3. Near simultaneous observations of the aurora from the ground and space, together with concurrent radar measurements, all from near 03:44 UT.(a)ASC image from 03:44:00 UT, aligned with the magnetic cardinal points. The north-south line is the mag-netic meridian from which keograms are formed. Also shown is the projection of the radar field-of-view. Red features at the bottom of the image are timing information. (b)An auroral image from the IMAGE FUV/WIC instrument, taken at 03:44:34 UT. Super-imposed is theKp = 3 statistical oval (dashed lines), the ASC meridian, and the radar field-of-view. (c) The relationship be-tween Doppler shift, observed by the radar during the scan starting 03:43:34 UT, and auroral luminosity as measured by IMAGE. In the radar field-of-view every 15th range gate is marked. The kink in the field-of-view between range gates 30 and 45 corresponds to a change in projection altitude from the E-region (nearer ranges) to the F-region.
sider the luminosity features to be an arc-pair, though using the term “arc” in a fairly loose way. Auroral arcs, produced by precipitating electrons, are often associated with sheets of upward field-aligned current (FAC), and we will show below that the radar flow observations are consistent with this, es-pecially if the gap between the arc pair is considered to be a sheet of downward return current. We will refer to three regions, from south to north, as arc 1, gap, and arc 2.
Turning to the radar observations in panels (a-c) of Fig. 2, we immediately note the remarkable correspondence be-tween the location of backscatter echoes and the visual aurora shown in panel (d). Specifically, significant radar backscatter only appears after 03:00 UT, starting near a zenith angle of 50◦, though subsequently expanding pole-wards and equatorpole-wards to cover a similar range of zenith angles as the visual arcs. (We note that no backscatter can be observed above a zenith angle of 83◦, as here the ASC meridian falls outside the radar field-of-view.) There are dis-crepancies, however. For instance, backscatter is observed where the gap between the arc-pair lies, though the spectral characteristics of these echoes obviously differ considerably from the echoes associated with either arc. We describe these characteristics now in latitudinal order.
Associated with arc 1, echoes have Doppler shifts which tend to be low and negative (away from the radar), between 0 and−300 m s−1, though increasing slightly in magnitude with latitude. These echoes have variable backscatter pow-ers, though mainly below 30 dB, and low spectral widths, less than 100 m s−1. Associated with the gap, backscatter power is enhanced to around 30 dB, and the spectral widths tend to be higher, though variable, above 100 m s−1. These echoes display a mixture of high (−500 m s−1) and low (near 0 m s−1) Doppler shifts, with few intermediate values. Close ex-amination of the echoes in this region shows that these mixed echoes are the “two-peak E-region echoes” or TWOPEE backscatter population identified by Milan et al. (2003). Such backscatter is thought to result from a pair of scattering lay-ers within the E-region (high and low Doppler shifts from higher and lower in altitude, respectively) in which different irregularity types exist. The high, variable spectral widths occur as a consequence of two components, with high and low Doppler shift, co-existing in the echo spectra. The high Doppler shift component is found close to the line-of-sight component of the electron drift, whereas the low Doppler shift component is depressed significantly below this, ap-proximately 10% of the line-of-sight component of the elec-tron drift. The present observations suggest that such echoes are found not co-located with auroral forms, but adjacent to them, indeed potentially in regions of downward FAC.
echoes only appear in the radar keograms between 03:30 and 03:55 UT (zenith angles greater than 75◦), but are actually present throughout the interval of study (Fig. 2e). These echoes have positive Doppler shifts (towards the radar) and hence, correspond to plasma drift in the opposite direction to that in the lower latitude backscatter regions. Since this scat-ter lies at very high zenith angles, where features are signif-icantly distorted in the keograms, it is difficult to determine the exact relationship with arc 2. Global imagery shown be-low demonstrates that these echoes appear just equatorward of arc 2, not co-located with it. In other words, these echoes are also associated with the arc-pair gap. In the distorting keograms the latitudinal extent of this region of backscatter appears limited, but Fig. 2e reveals that it is just as extensive, if not more so, than the lower latitude gap backscatter.
Figure 3b puts these observations into a more global context, being an IMAGE FUV/WIC snapshot from 03:44:34 UT, presented in a magnetic latitude and local time coordinate system. Overlaid is a statistical auroral oval, the location of the radar field-of-view, and the ASC keogram meridian. Iceland is located near 04 MLT at this time. In the image the auroral oval is clearly evident, though somewhat obscured by dayglow near noon. In addition, in the morning sector, an arc poleward of the main oval is seen, connected to the oval between 03 and 04 MLT, and extending around at least as far as 06 MLT and possibly to 07 MLT. In this image we can draw a clear association between arc 1 in the ASC observation and the main oval, and between arc 2 and the poleward auroral feature, as described previously. Fig-ure 3c zooms in to the vicinity of the radar field-of-view, and overlays the concurrent radar measurements of Doppler shift (scan starting 03:43:34 UT). This places the radar observa-tions somewhat to the east of the fork in the auroral structure, with the high positive Doppler shifts equatorward of arc 2. In addition, there is a limited region of smaller positive Doppler shifts co-located with this arc. In the vicinity of the main oval, high negative Doppler shifts can be seen at the pole-ward edge of the luminosity, and co-located with it smaller negative velocity echoes.
4 Discussion
The CUTLASS Iceland radar has proved important for the study of backscatter echoes from decametre E-region irreg-ularities. However, a major stumbling block in our under-standing of the observations has been an inability to deter-mine accurately the convection electric field E that drives the instability processes, due to a lack of suitable support-ing instrumentation within the field-of-view (see also Milan et al., 2003). Overpassing, low Earth orbit (LEO) satellites can help here, but favourable conjunctions are rare. We show in what follows that in the absence of actual measurements of the electric field, we can infer the latitudinal variation of
E, if not its exact magnitude, using optical observations and applying suitable assumptions. This gives a first stab at plac-ing E-region echo characteristics within the context of the
field-aligned current, ionospheric conductivity, and electric field background. Furthermore, the present observations are not unique, Milan et al. (2001) also having reported a dou-ble arc feature associated with latitudinally-separated regions of positive and negative Doppler shift echoes. This suggests that an understanding of the present interval will shed light on a not uncommon auroral phenomenon.
Our proposed model of the observations is based on sev-eral assumptions, which are detailed below.
1. The arc pair can be treated as two L-shell aligned fea-tures, such that a geomagnetic meridian (for arguments sake, the ASC meridian) can be treated as the sole hor-izontal dimension of the problem. This is a common assumption made when interpreting magnetic field per-turbations associated with FAC structures measured by polar-orbiting LEO satellites; if FAC structures are con-sidered to extend to infinity in the cross-track direction then only the along-track dimension is of importance. In reality, our observations show that the auroral forms meet to the west of the ASC meridian, but this does not seem to overly affect our predictions.
2. Each arc, being produced by precipitating electrons, is a sheet of upward FAC. Typically, significant auroral lu-minosities are associated with current densities of the order of, or in excess of, 1µA m−2. To provide cur-rent closure there must be an accompanying downward FAC, which we assume lies between the upward FAC sheets, that is in the gap between the arc-pair. The up-ward and downup-ward FACs are closed through the iono-sphere by Pedersen currents flowing in the E-region. We assume that the system is closed, that is no Pedersen currents flow into or out of the system at the poleward or equatorward boundaries. For illustrative purposes we assume that the system is symmetrical, the two arcs be-ing equal in latitudinal width (250 km) and carrybe-ing the same FAC density (1µA m−2). We also assume that the gap is twice as wide as each arc, so the associated current density is equal to that in either arc. Thus, in to-tal, the arc system is 1000 km wide along the meridian, consistent with the observations of Fig. 3.
3. The electron density of the E-region is enhanced by the precipitation associated with the arcs, such that the arcs are regions of elevated Pedersen conductivity, whereas the gap is of lower conductivity. We assume that the background conductance (height-integrated conductiv-ity) is 3 mho, and the elevated conductance is 10 mho. Such values are typical for sub-auroral and auroral lat-itudes, that is for a background and a precipitation-enhanced E-region, respectively; conductances can range as high as 30 mho under thin intense arcs (e.g. Milan et al., 1999).
1572 S. E. Milan et al.: E-region echo characteristics governed by auroral arc electrodynamics
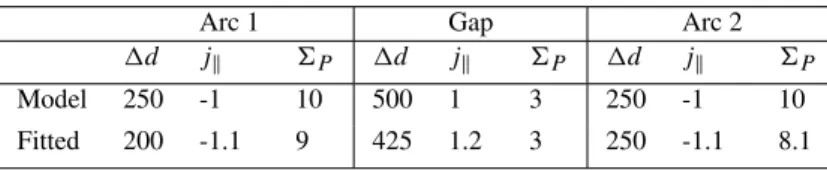
Table 1.Parameters of the arc systems used in the illustrative model (Fig. 4) and the fit to observations (Fig. 5). Parameters indicated are latitudinal width1d(km), field-aligned current densityjk(µAm−2) , and ionospheric Pedersen conductance
6P (mho)
Arc 1 Gap Arc 2
1d jk 6P 1d jk 6P 1d jk 6P
Model 250 -1 10 500 1 3 250 -1 10
Fitted 200 -1.1 9 425 1.2 3 250 -1.1 8.1
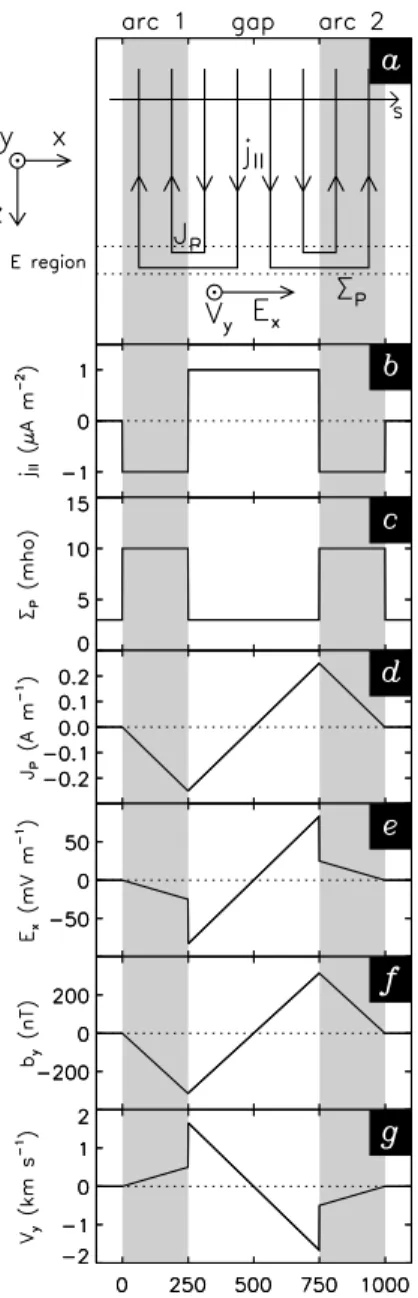
close the system. Figure 4a shows the current system en-visaged, and the panels below, in order, show the FAC mag-nitudejk(positive downwards), the E-region Pedersen
con-ductance6P, the height-integrated Pedersen current density
JP, the polewards electric fieldEx, the magnetic field per-turbation associated with the FAC systemby, and the iono-spheric plasma driftVy. All are a function ofx, the distance polewards along the meridian from the equatorwards edge of arc 1. In our coordinate systemy is positive eastwards, and
zpoints downwards along the magnetic field directionB, as-sumed to be vertical. The model parameters are summarized in Table 1.
Figure 4b shows the variation ofjkwithx, indicating two
regions of upward FAC on either side of a region of down-ward FAC. By current continuity, the Pedersen current must be the integral ofjk, that is
JP = Z x
0
jkdx, (1)
assuming no Pedersen current flows equatorwards of the arc system. If upward and downward FACs are of equal overall magnitude, then no Pedersen current is present polewards of the arc system either, as is the case in the present model, Fig. 4d. From this we can derive the electric field which is necessary to drive this current, as
JP =6PEx, (2)
or, from Eq. 1,
Ex = 1
6p Z x
0
jkdx. (3)
The variation inEx is shown in Fig. 4e. Before compar-ing this with our observations, we determine, for interest, the magnetic perturbation that would be measured by a satellite S passing through the arc FAC structure along the meridian. Representing the FAC density asj = jkzˆ , we can
deter-mine the magnetic perturbationb=bxxˆ+byyˆ+bzzˆfrom Amp´ere’s Law
∇ ×b=µ0j, (4)
which gives
∂by
∂x − ∂bx
∂y =µ0jk. (5)
From assumption (1)∂/∂y=0, so Eq. (5) reduces to
∂by
∂x =µ0jk, (6)
and the perturbation is found to be
by =µ0
Z x
0
jkdx. (7)
Hence, the magnetic deflection occurs only in the cross-track direction, and, if the ionospheric Pedersen conductivity were uniform, the deflection would be proportional to the along-track electric fieldEx (see Eq. 3). The model pertur-bation is shown in Fig. 4f. A negative or positive gradient inbywith increasing latitude indicates upward or downward FAC, respectively. The magnitude of thebyperturbation pre-dicted is of the order of several 100 nT, which is consistent with observations of spacecraft passing through large-scale FAC systems (e.g. Iijima and Potemra, 1976).
Of most interest here is the electric field variation, which is directly associated with the F-region plasma driftE×B/
B2(Fig. 4g), which is directed east-west, with velocity
Vy= 1
B6p Z x
0
jkdx, (8)
where we takeBto have a value of 5×10⁴nT. The latitudinal variation ofVyis as follows. Below arc 1 no plasma drift is expected. Through arc 1 eastwards plasma drift increases in magnitude to several 100 m s−1, with a jump to over 1 km s−1 at the poleward edge due to the drop in conductivity. Across the arc gapVyturns from positive to equally negative, with a drop in magnitude to several 100 m s−1at the equatorward edge of arc 2, coincident with the increase in conductivity. The magnitude of the westward plasma drift decreases to zero towards the poleward edge of arc 2. Clearly, our sit-uation is idealized, and such sharp boundaries between the different flow regimes would not be expected in reality, but the form ofVy gives a prediction that can be tested against our observations.
Fig. 4. A model of the expected field-aligned current (FAC) and electric field structure in the observed double-arc feature. (a)A schematic of the current flow in a coordinate system such thatx
points northwards along the magnetic meridian,ypoints eastwards, andzpoints vertically downwards along the magnetic field direc-tion. Grey bars indicate the location of upward FAC, associated with electron precipitation, and hence, auroral luminosity. (b−g)The latitudinal variation of field-aligned current densityjk, Pedersen conductance6P, Pedersen currentJP, electric fieldEx, the
mag-netic perturbation experienced by a spacecraft S passing through the FAC systemby, and the ionospheric plasma driftVy.
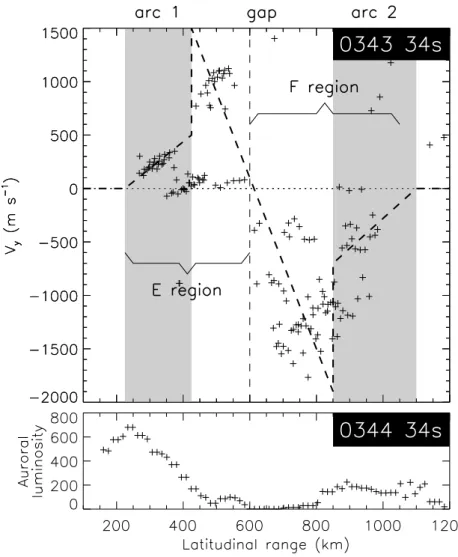
assume that the flows measured by the radar are directed zon-ally (see assumption (1) above). Superimposed is a dashed curve of the same general shape as the prediction ofVy in Fig. 4g; peak magnitudes and the distance scale have been tweaked to achieve a fit with the data, but by no more than 10% and 15%, respectively. The arc parameters required to produce this fit are shown in Table 1. We have marked on the
locations of arcs 1 and 2 (grey bars) determined from theVy prediction, and find that this matches closely the co-located WIC auroral observations shown in the lower panel of Fig. 5. Finally, a vertical dashed line has been superimposed which shows the approximate location of the gap between E- and F-region backscatter.
We find that the prediction ofVyqualitatively reproduces the observations, that is low positiveVyassociated with arc 1, low negativeVyassociated with arc 2, and high positive and negativeVyin the equatorward and poleward portions of the arc gap, respectively. It is always problematic using E-region echoes to infer electric field as it is well known that there is not necessarily a linear correlation between the electric field and Doppler shift. However, that there is also close agree-ment with the F-region observations supports our picture. This suggests that our assumptions regarding the location of FAC structures relative to the regions of auroral luminosity are correct to a first order, lending strength to our assertion that the arc gap is associated with downward field-aligned current. This is the first time in our studies of E-region backscatter that we have been able to state with confidence the exact location of downward FAC relative to auroral lumi-nosity features (cf. Milan et al., 2001, 2002), allowing us to determine the echo characteristics associated with downward current flow.
Within the E-region backscatter, co-located with the arc gap (between ranges of 400 and 600 km), is a mixture of high and low Doppler shift echoes. This TWOPEE E-region echo population has been described in detail by Milan et al. (2003), and a tentative association between it and down-ward FAC structures was drawn by Milan et al. (2001, 2002). We can now make this association more strongly. Villain et al. (1987, 1990) described the high Doppler shift component of such echoes in terms of electrostatic ion cyclotron waves excited in the presence of thermally upwelling electrons car-rying downward FAC. While some doubt has been cast on this interpretation (Milan et al., 2003), the link with down-ward FAC appears concrete. We quickly reiterate here the findings of Milan et al. (2003) that the electric field in the vicinity of these echoes appears sufficient to produce the high Doppler shifts observed (contrary to the suggestion of Villain et al., 1987, 1990), and that it is the low Doppler shift com-ponent that is depressed significantly below expectations, to approximately 10% of the high Doppler shift echoes.
Associated with arc 1 we find E-region echoes with Doppler shifts which vary in concert with the predicted driv-ing electric field. As these echoes have Doppler shifts be-low the ion-acoustic speed, we suggest that they are scattered from gradient drift waves. Without actual electric field mea-surements we cannot determine the exact relationship be-tween the Doppler shift andEx, but we can at least infer that this is close to proportionality.
1574 S. E. Milan et al.: E-region echo characteristics governed by auroral arc electrodynamics
Fig. 5. (Upper panel) The plasma drift Vy inferred from the Doppler
shift measurements along beams 0 to 3 of the radar during the scan starting 03:43:34 UT. The dashed curve indi-cates a fit ofVy from the model. Su-perimposed are grey bars indicating the location of arcs suggested by theVyfit. (Lower panel) The auroral luminosity observed by IMAGE FUV/WIC along beam 0 of the radar at 03:44:34 UT.
addition, however, the predicted electric field within this re-gion is close to 0 mV m−1(Fig. 5), in which case irregulari-ties are not expected to be generated (e.g. Milan et al., 1999).
5 Conclusions
Coherent HF radar measurements of E and F-region backscatter from the postmidnight sector suggest a close re-lationship between echo characteristics and a pair of auro-ral luminosity features. Assumptions regarding the field-aligned current structure associated with the arc system al-low the latitudinal variation in the convection electric field to be predicted, these predictions matching the observed echo Doppler shifts well. Thus, we can place the E-region backscatter characteristics within the context of the FAC structure, allowing several conclusions to be drawn:
1. Milan and Lester (2001) described how E-region echoes often appear delineated into L-shell-aligned “channels” in which the echo characteristics differ, but fall into dis-tinct populations. These channels appear to be asso-ciated with changes in field-aligned current structure, ionospheric conductivity, and the driving electric field,
that is a relationship with visual auroral forms is ex-pected, as also investigated by Milan et al. (2000, 2001, 2002).
2. Mixed high and low Doppler shift echoes (TWOPEEs), as described by Milan et al. (2003), are associated with regions of downward FAC. Villain et al. (1987, 1990) implicated thermally upwelling electrons in the genera-tion of the high Doppler shift echoes, which is consis-tent with our observations. However, as suggested by Milan et al. (2003) and verified by the present study, the electric field within these regions is sufficient to ex-plain the observed Doppler shifts, and so “oblique elec-tron streaming” (Villain et al., 1987) is not necessary to provide additional free energy for instability growth. These high Doppler shifts are greatly in excess of the ion-acoustic speed, seemingly ruling out the two-stream instability as the driving mechanism. In addition, the co-located low Doppler shift echoes have anomalously low shifts, of the order of 100 m s−1, much depressed below expectations, to approximately 10% of the line-of-sight component of the electron drift.
asso-ciated with arc 1, E-region echoes are observed with Doppler shifts below the ion-acoustic speed, but which appear proportional to the expected electric field, sug-gesting that such echoes are scattered from gradient drift waves.
Further study will concentrate on actual measurements of electric field and FAC signatures observed by LEO satellites, allowing for a more direct relationship to be drawn between the instability mechanisms operating in the E-region iono-sphere and the observed echo characteristics.
Acknowledgements. CUTLASS is supported by the Particle Physics and Astronomy Research Council (PPARC grant no. PPA/R/R/1997/00256), UK, the Swedish Institute for Space Physics, Uppsala, and the Finnish Meteorological Institute, Helsinki. The optical auroral observation project in Iceland was facilitated by the Science Institute, University of Iceland, and sup-ported by Grant in Aid for Overseas Science Survey (grant no. A: 11304029) from the Japanese Society for the Promotion of Science (JSPS).
The Editor-in-Chief thanks J.M. No¨el and another referee for their help in evaluating this paper.
References
Greenwald, R. A., Baker, K. B., Dudeney, J. R., Pinnock, M., Jones, T. B., Thomas, E. C., Villain, J.-P., Cerisier, J.-C., Senior, C., Hanuise, C., Hunsucker, R. D., Sofko, G., Koehler, J., Nielsen, E., Pellinen, R., Walker, A. D. M., Sato, N., and Yamagishi, H.: DARN/SuperDARN: A global view of the dynamics of high-latitude convection, Space Sci. Rev., 71, 761–796, 1995. Hanuise, C., Villain, J.-P., Cerisier, J.-C., Senior, C., Ruohoniemi,
J. M., Greenwald, R. A., and Baker, K. B.: Statistical study of high-latitude E-region Doppler spectra obtained with the SHERPA HF radar, Ann. Geophysicae, 9, 273–285, 1991. Iijima, T. and Potemra, T. A.: The amplitude distribution of
field-aligned currents at northern high latitudes observed by Triad, J. Geophys. Res., 81, 2165–2174, 1976.
Mende, S. B., Heetderks, H., Frey, H. U., Lampton, M., Geller, S. P., Habraken, S., Renotte, E., Jamar, C., Rochus, P., Spann, J., Fuselier, S. A., Gerard, J.-C., Gladstone, R., Murphree, S., and
Cogger, L.: Far ultraviolet imaging from the IMAGE spacecraft. 1. System design, Space Sci. Rev., 91, 243–270, 2000a. Mende, S. B., Heetderks, H., Frey, H. U., Lampton, M., Geller,
S. P., Abiad, R., Siegmund, O. H. W., Tremsin, A. S., Spann, J., Dougani, H., Fuselier, S. A., Magoncelli, A. L., Bumala, M. B., Murphree, S., and Trondsen, T.: Far ultraviolet imaging from the IMAGE spacecraft. 2. Wideband FUV imaging, Space Sci. Rev., 91, 271–285, 2000b.
Milan, S. E. and Lester, M.: Spectral and flow angle characteristics of backscatter from decametre irregularities in the auroral elec-trojets, Adv. Space Res., 23, 1773–1776, 1999.
Milan, S. E., Davies, J. A., and Lester, M.: Coherent HF radar backscatter characteristics associated with auroral forms identi-fied by incoherent radar techniques: a comparison of CUTLASS and EISCAT observations, J. Geophys. Res., 104, 22 591–22 604, 1999.
Milan, S. E., Lester, M., Sato, N., Takizawa, H., and Villain, J.-P.: Investigation of the relationship between optical auroral forms and HF radar E-region backscatter, Ann. Geophysicae, 18, 608– 617, 2000.
Milan, S. E. and Lester, M.: A classification of spectral populations observed in HF radar backscatter from the E-region electrojets, Ann. Geophysicae, 19, 189–204, 2001.
Milan, S. E., Lester, M., Sato, N., and Takizawa, H.: On the al-titude dependence of the spectral characteristics of decametre-wavelength E-region backscatter and the relationship with opti-cal auroral forms, Ann. Geophysicae, 19, 205–217, 2001. Milan, S. E., Sato, N., Lester, M., Yeoman, T. K., Murata, Y.,
Doi, H., and Saemundsson, T.: The spectral characteristics of E-region radar echoes co-located with and adjacent to visual au-roral arcs, Ann. Geophysicae, 20, 795–805, 2002.
Milan, S. E., Lester, M., and Sato, N.: Multi-frequency observations of E-region HF radar aurora, Ann. Geophysicae, 21, 761–777, 2003.
Villain, J.-P., Greenwald, R. A., Baker, K. B., and Ruohoniemi, J. M.: HF radar observations of E-region plasma irregularities produced by oblique electron streaming, J. Geophys. Res., 92, 12 327–12 342, 1987.