2Space and Plasma Physics, School of Electrical Engineering, KTH, Stockholm, Sweden 3Univ Tromsø, Dept Phys & Technol, 9037 Tromsø, Norway
4Swedish Institute of Space Physics, Uppsala, Sweden 5EISCAT, 9027 Ramfjordbotn, Norway
Received: 28 November 2008 – Revised: 5 June 2009 – Accepted: 16 June 2009 – Published: 26 June 2009
Abstract. Observations of modifications of the electron temperature in the F-region produced by powerful high fre-quency radiowaves at 4.04 MHz transmitted in X-mode are presented. The experiments were performed during quiet nighttime conditions with low ionospheric densities so no reflections occurred. Electron temperature enhancements of the order of 300–400 K were obtained. Numerical simulation of ohmic heating by the pump wave reproduces both altitude profiles and temporal dependence of the temperature modifi-cations in the experiments.
Keywords. Ionosphere (Wave propagation) – Radio science (Ionospheric propagation; Waves in plasma)
1 Introduction
A powerful High Frequency (HF) radio wave can perturb the ionospheric plasma significantly and induce a great number of interesting plasma-physical phenomena near the reflection altitude (e.g. Gurevich, 2007, and references therein). This includes instabilities and mode conversions driving Lang-muir and upper hybrid turbulence leading to large electron temperature enhancements (Honary et al., 1993; Robinson et al., 1996; Leyser et al., 2000; Rietveld et al., 2003), cre-ation of field aligned density depletions (Kelley et al., 1995; Ponomarenko et al., 1999), acceleration of electrons (Carl-son et al., 1982) and radio induced emissions at HF and optical frequencies (Bernhardt et al., 1989; Leyser, 2001; Br¨andstr¨om et al., 1999; Gustavsson et al., 2001; Kosch et al., 2007).
Correspondence to:N. Ivchenko (nickolay@kth.se)
Along the entire wave propagation path there is also Ohmic heating due to non-zero HF-conductivity and asso-ciated collisional damping of the HF-wave. The Ohmic ef-fect has been studied for overdense conditions (Shoucri et al., 1984; Hansen et al., 1992a; Hansen et al., 1992b). For such conditions most of the energy deposition in the F-region oc-curs just below the reflection altitude. From there heat is convected up and down along the magnetic field (Gonzalez et al., 2005; Mantas et al., 1981). Due to a large number of possible wave-plasma processes acting in the region close to the reflection altitude it is difficult to accurately separate the effects of Ohmic heating from the effects of nonlinear and resonant processes, unless one keeps the ERP (Effective radiated power) low enough to make sure the peak E-field amplitude is below the threshold for the nonlinear processes. When transmitting X-mode waves at frequencies above the critical frequency for reflection, fXF2 there is no standing
wave and only limited beam swelling. Further there is no altitude where the pump frequency is equal to the frequency of upper-hybrid resonance, fU H, or the plasma frequency,
fP, and no resonances are excited. Thus underdense heating
makes it possible to study the effect of Ohmic heating with large amplitude E-fields in a large altitude range.
In order to isolate the effect of Ohmic heating we per-formed a series of experiments at the EISCAT heating facil-ity (Rietveld et al., 1993) between 17 and 19 October 2006 with X-mode transmission at frequencies abovefXF2. The
ionospheric response of the heating was observed with the EISCAT UHF radar (Rishbeth and van Eyken, 1993). In this article we present observations of modulation of 30–40% of the electron temperature,Te, with increases of up to 400 K.
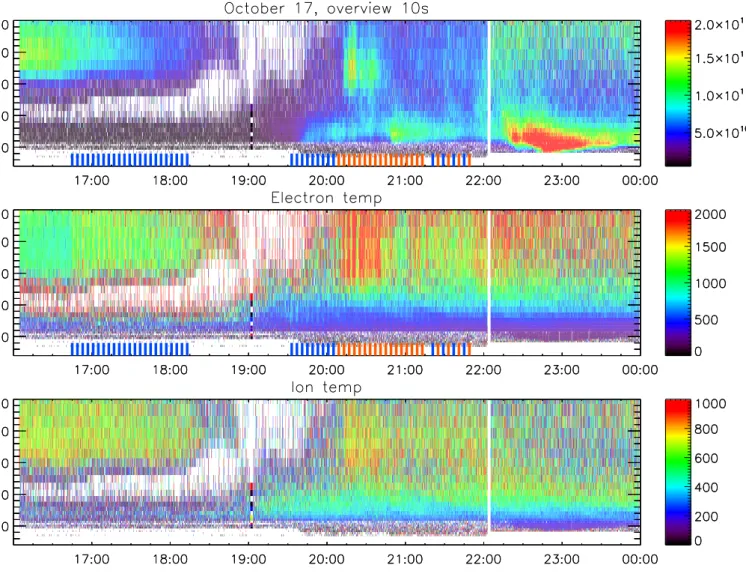
Fig. 1.Overview of the EISCAT data from 17 October 2008. Electron density (upper panel) shows a steady decrease until 19:00 UT while
Te(middle panel) is modulated by the HF-transmission, no significant change is seen inTi (lower panel). The bars under the plots indicate
when the heater facility was running: blue bars indicate X-mode and red bars O-mode
Although there have been predictions and indirect deduc-tions of temperature enhancements caused by X-mode heat-ing, to our knowledge there is only one other publication with observations of X-mode temperature enhancements in the F-region. Showen and Behnke (1978) briefly mention that only rarely has X-mode heating succeeded and only in the reflec-tion case with a maximum change of 100K.
2 Experiments and observations
Three evening experiments with transmission in the magnetic zenith at 4.04 MHz were run with the EISCAT Heating fa-cility (located at 69.6◦N, 19.2◦E outside Tromsø, northern Norway) on 17, 18 and 19 October 2006. The ionospheric
re-sponse was observed with the EISCAT UHF incoherent scat-ter radar also pointed in the direction of the magnetic zenith. Modulations of the F-region electron temperature, Te,
were found even though the peak plasma density was too low for reflection either of X- or O-mode transmission of the 4.04 MHz pump wave in all cases, but the first couple heat-ing pulses on 19 October. There is no conspicuous difference in the electron temperatures between the first pulses and the subsequent ones, suggesting either that the ionosphere was indeed sub-critical or that the energy deposition is similar for the case with reflection near the peak of the electron density profile. In either case, the reflection effects are beyond the scope of this paper.
21:14 UT the transmission was in O-mode. The UHF radar was observing in the magnetic zenith with the tau2pl pro-gram giving an intrinsic time resolution of 5 s and a range resolution of 5 km. At the start of the experiment the peak plasma density measured by the radar was approximately 9×10¹⁰m−3 which corresponds to a plasma frequency of 3.1MHz and afXF2 of 4.01MHz with the peak at 240km,
confirmed independently with ionosonde observations. The density continued to decrease during the experiment and at around 18:00 UT, withf0F2 at 2.1 MHZ corresponding to
an X-mode critical frequency of approximately 3 MHz, the signal became too low to be reliably detected by the radar.
On 18 and 19 October the conditions were similar, with peak densities below the critical value for X-mode reflec-tion, but slightly higher than on 17 October. On 18 October the transmission was in a 2 min on 2 min off cycle between 16:40 UT and 18:42 UT in X-mode when f0F2 decreased
from 3.1 to 2 MHz corresponding to afXF2 decrease from
4.03MHz to 3MHz with the peak at 270km. The radar was running the arc1u program during this experiment giving an intrinsic time resolution of 0.44 s and a range resolution of 0.9 km, which resulted in lower signal to noise ratio in the F-region which gives larger uncertainty in the results. Here, temperature modulation was observed throughout the heater operation. On 19 October the transmission was in a 3 min on 3 min off cycle in X-mode between 16:15 UT and 17:29 UT. The radar was running the tau2pl program. Electron temper-ature modulation in the F-region was also observed in this experiment as well. During the 19 October event the den-sity decreased rapidly, and analysis of radar data gives reli-able results for only five heating cycles between 16:15 and 17:00 UT whenf0F2 decreased from 3.2 to 1.5 MHz
corre-sponding to a decrease infXF2 from 4.14MHz to 2.5 MHz
with the peak at 250km.
To make a more detailed analysis of the characteristic rise and decay times of the temperature enhancements for the low-density conditions (with the accompanying poor signal-to-noise ratio) we apply conditional averaging of the decoded radar acf estimates. In order to reduce noise, and still re-solve the rapid variation of the ionospheric response to the HF-transmission power on/off the autocorrelation functions received at the same offset time from the nearest HF on time
of Langmuir turbulence upon HF turn on, and by Grydeland et al. (2008) to resolve fast variations of backscatter power related to flickering aurora). Ion and electron temperatures, which only depend on the shape of the Incoherent Scatter (IS) spectrum are accurately estimated with this analysis dur-ing stable conditions, where theTe modulation is caused by
the periodic HF-pump cycle. This gives estimates ofTeand
Ti with a time resolution of 10 s for tau2pl and 8 s for arc1u
with a sufficient signal to noise ratio. This time resolution is of the same order of magnitude as the thermal response studied here. The electron density obtained this way is an average over the whole period in question and is not repre-sentative, as the density decreases systematically throughout all three experiments. The integration used a range gate inter-val of 10 km in altitude and was performed between 200 km and 300 km.
In all three experiments the highestTeincreases are found
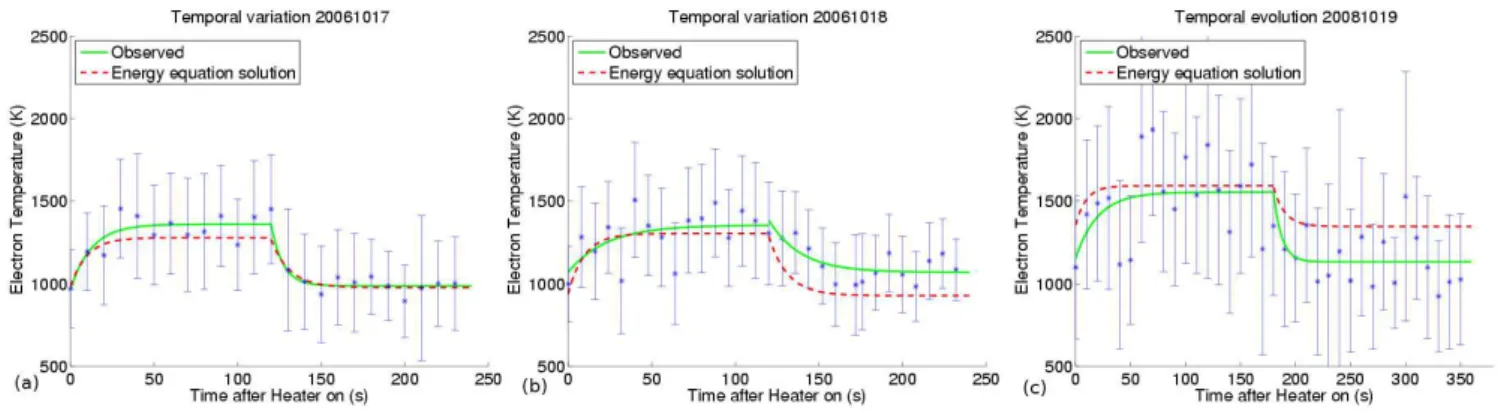
in the 230–240 km altitude interval. The results of the condi-tional averaging over the periods with similar electron den-sity profiles (16:48 UT to 18:14 UT for 17 October, 17:00 UT to 17:40 UT for 18 October and 16:15 UT to 16:45 UT for 19 October) are shown in Fig. 2. On 17 OctoberTeincreases by
approximately 370 K, on 18 October by 290 K and on 19 Oc-tober by 420 K. The characteristic times and temperature in-creases for all three days are shown in the three first columns of Table 1, to examine the characteristic times a model of ex-ponential increase (a(1−e−t /T)+c) and exponential cool-ing ((ae−t /T)+c) is fitted to the data with non-linear least squares. The rise and decay times of the modulation are in the order of ten seconds, with longer times for 18 October.
Fig. 2. Temporal evolution of the electron temperature for the three different days,(a)17 October, (b)18 October and(c)19 October. Temperatures derived from conditionally averaged raw radar data,received at the same offset time from the nearest HF on time, are plotted vs. time along with the error bars. Exponential fits to temperature rise and fall are shown in green. Results of the time dependent modeling of collisional Ohmic heating by the pump wave are shown in red (see text).
Fig. 3. Height dependence of the electron temperature for HF-on (blue) and HF-off (green), for 17 October(a), 18 October(b)and 19 October(c). Both observed profiles (thin line) and the solution of the energy equation (thick line) are shown.
3 Modeling
The ionospheric response to HF-heating on these long time-scales are described by the coupled ion and electron continu-ity, momentum and energy equations (Banks and Kockarts, 1973; Schunk and Nagy, 1978; Shoucri et al., 1984; Hansen et al., 1992a; Hansen et al., 1992b). For the underdense con-ditions of our experiments, the HF-heating is smoothly dis-tributed in altitude and there is no significant density modu-lation and no plasma expulsion from a region close to a re-flection altitude. Our observations also show no detectable change inTiduring the HF transmission thus we can simplify
the model by only considering the electron energy equation. 3.1 The model
Considering that heat conductivity is much larger along the background magnetic field than perpendicular, and that the transverse plasma drifts through the beam are slow com-pared with characteristic times for electron heating and
cool-ing, we can simplify the problem further to only study the variations in one dimension, along the magnetic field. Fur-ther, field-aligned electron drifts are small, making convec-tive terms negligible. Under these assumptions the electron energy equation can be written:
3 2nekB
∂Te(t,z)
∂t =
∂ ∂z
Ke(Te)
∂Te(t,z)
∂z
+Q(t,z)+Q0(t,z)−Le(Te) (1)
whereQ0is the background sources (energy deposition from
photoionisation and other sources),Qis the energy deposi-tion by the pump wave,Leis the rate of energy loss due to
both elastic and inelastic collisions with ions and neutrals, andKeis the parallel thermal conductivity. We use thermal
conductivity from Banks and Kockarts (1973)
Ke=
7.7×10⁵Te5/2
1+3.22×10⁴(T2
e/ne)PsnsQ¯D
defined as (Schunk and Nagy, 1978)
ln3=ln
16π ǫ0kBTe
γ2z ie2ke
−k
2 e+ki2
k2 e
ln (k
2
i +k2e)1/2
ke
!
(5)
and
k2i = niz
2 ie2
ǫ0kBTi
(6)
k2e = nee
2
ǫ0kBTe
(7) If the ionosphere is assumed to consist mainly of NO+,O+
2,O
+,He+and H+and the different ions are assumed to have equal temperature the expression for the cooling rate takes the form
Le,i=3.2×10⁻¹⁴ne
(Te−Ti)
Te3/2
ln3×...
nO++4nH e++16nH++0.5n
O2+
+0.53nN O+) (8)
whereLe,i is given in eVm−3s−1, Te in K and the density
ne,iin m−3(Schunk and Nagy, 1978).
The loss due to collisions with neutrals occurs mainly in inelastic processes exciting rotational, vibrational and atomic states in the molecules and atoms. We use the cooling rates from Pavlov (1998a,b); Pavlov and Berrington (1999). The neutral densites has been obtained from MSIS model (Hedin, 1991) for the actual day and ion densities from IRI-model.
The heat source, Q, we calculate from the ordinary ex-pression for Joule heating (Shoucri et al., 1984)
Q=<J·E>=1 2Re E
∗·σ·E
(9) whereσ is the conductivity tensor and the wave electrical fieldEat altitudezis
E±=E(z0) z
0 z
ǫ
±(z0) ǫ±(z)
1/4
exp
ik0
Z z
z0
N±(z)dz
(10) Here ǫ± denotes the dielectric tensor for the X-mode (+) and O-mode (−) polarized waves,k0is the wave number at
0 1 2 3 4 5 6
x 108
160 180 200
Energy deposition (eV/m3)
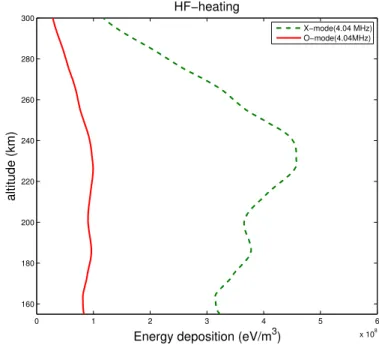
Fig. 4. Profile of X-mode energy deposition from heater used for solution of the energy equation for October 17. Calculated values for O-mode for the same frequency is shown as a comparison.
the bottom of the ionosphere, and finallyN±(z)is the com-plex refractive index. Here we use the formulas of Shou-cri et al. (1984) for the conductivity and dielectric tensors and estimate the HF-pump wave E-field at the bottom of the ionosphere,E(z0), by free space propagation. Here we
usez0=150 km. Even though there is no reflection altitude some beam swelling will occur in the region where the local plasma frequency approaches the pump frequency. There the refractive index for the pump frequency decreases and leads to a reduction of phase velocity, to conserve Poynting flux the wave amplitude grows.
3.2 Results
Good agreement with the observed electron temperature en-hancements is obtained for 17 and 19 October by numeri-cally integrating the electron energy equation (Eq. 1) from a altitude of 180 km up to 320 km, using a Crank-Nicholson scheme with 0.1 s timestep and 3.4 km grid in altitude and Ohmic heating by the pump wave calculated using Eqs. (9) and (10). For 17 and 19 October the integration of Eq. (1) gives a good fit with the observedTe. For 18 October we
ob-tain a slightly higher electron temperature enhancement than is observed, shown in Fig. 2.
0 2 4 6 8 10 12 x 1010 140
160 180 200 220 240 260 280 300 320
n e (m
−3 )
Altitude (km)
n e 17−Oct n
e 18−Oct n
e 19−Oct
Fig. 5.Electron density profiles used for the simulations.
4 4.5 5 5.5 6
0 0.5 1 1.5
Frequency (MHz)
δ
T/T
0
20*1010 m−3 15*1010 m−3 12*1010 m−3 10*1010 m−3 8*1010 m−3 17−Oct (9*1010m−3) 18−Oct (11*1010m−3) 19−Oct (10*1010m−3) ERP=36MW (10*1010m−3) ERP=300MW (10*1010m−3) ERP=500MW (10*1010m−3) ERP=676MW (10*1010m−3)
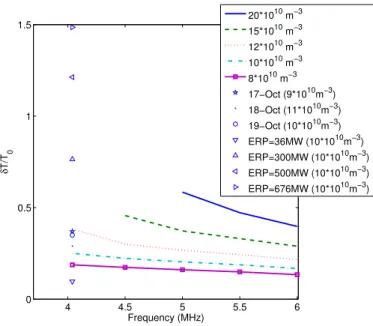
Fig. 6.Temperature increase as a function of heater frequency, ob-served values plotted as comparsion.
K(Te)1Te/1z, at the lower boundary to zero, since at that
altitude local losses dominate. At the upper boundary we ad-just the downward heat flux to give the best agreement with the observed unperturbed backgroundTeprofiles. These
val-ues of the heat flux, shown in Table 2, reproduce the general behavior of the background temperature profiles, but not all of the small-scale details. These are reasonable values for the heat flow in the ionosphere (Roble and Hastings, 1977)
dur-Fig. 7.Rise time as a function of heater frequency, observed values plotted as comparsion. Inset is zoomed in on modeled times.
Table 2.Heat flow used in simulation.
Day Heat flow (eVm−2s−1)
17 Oct 1.1×10¹³ 18 Oct 1.4×10¹³ 19 Oct 2.6×10¹³
ing quiet conditions. For quiet nighttime conditions there are few ambient heat sources and theQ0term can be neglected
in the simulation. In these conditions the background profile is determined only by heat flow at the top of the ionosphere and losses in the ionosphere.
When calculating the electron loss rates we useTifrom the
observations and constant neutral temperatures and density profiles from the MSIS model. The electron density profile used is filtered and smoothed from the radar data at the time of the first heating cycle shown in Fig. 5.
The reason for the higher simulated temperature enhance-ments could be due to the fact that the simulation is done using the electron densities observed during the first heating cycle, but the conditionally averagedTe is an average over
several cycles, with decreasing ne. The same model used
for fitting of experimental data described in the previous sec-tion is also used for describing the simulated data, results are shown in the three last columns of Table 1. One can see that the temperature increases (1T /Te,0) are in good
different peak electron densities. These results are shown in Fig. 6, where the frequency dependence of the fractional temperature increase (1T /Te,0) is shown, and Fig. 7, which
shows the dependence of the rise time on frequency. Both the temperature increase and the rise time for these figures are calculated at an altitude of 220 km. It is possible to see that the temperature increase is larger with increasing ionospheric density, and decreases with heater frequency. The character-istic times are only slightly affected, but significantly lower than our observed, increasing somewhat for lower densities and lower heater frequencies. 1T /Te,0 was calculated for
different ERP the electron density profile of October 17, with a low ERP of 36 MW (typical for HIPAS) and a high ERP of 676 MW (typical for HAARP) shown in Fig. 6. For the low ERP case we get a temperature increase of about 10% and for the high ERP case we get a temperature increase of almost 150% above the background profile. For compar-isons with experimental observations, one should remember that these temperature estimates are for under-dense heating with a pump frequency at 4.04 MHz, and that both HIPAS and HAARP have the ability to transmit at lower frequencies leading to pump-wave reflection and heating from resonant processes even whenfOF2 are below 4 MHz.
It is also possible to note from Fig. 4 that the peak ohmic energy deposition from X-mode is about four times greater than for O-mode. Therefore the effect of ohmic heating is predominantly seen in experiments with X-mode.
4 Conclusions
Observations of strong modulation of the electron tempera-ture in the F-region by X-mode waves are reported. The ther-mal response of the plasma to the external heating has been examined and the rise and decay times and the magnitude of the temperature enhancements have been estimated. We have found temperature enhancements of the order of 300– 400 K and characteristic times of about 10 s for the modu-lations. To explain these modulations we have numerically solved the electron energy equation and found that they can be well described by Ohmic heating from the pump wave. Both characteristic times and temperature enhancements are reproduced in the simulations. The observations were made
Acknowledgements. NI is supported by Swedish Research
Coun-cil. EISCAT is an international association supported by research organisations in China (CRIRP), Finland (SA), France (CNRS, till end 2006), Germany (DFG), Japan (NIPR and STEL), Norway (NFR), Sweden (VR), and the United Kingdom (STFC).
Topical Editor M. Pinnock thanks two anonymous referees for their help in evaluating this paper.
References
Banks, P. M. and Kockarts, G.: Aeronomy Part B, Academic Press, London, UK; New York, USA, 1973.
Bernhardt, P. A., Tepley, C. A., and Duncan, L. M.: Airglow en-hancements associated with plasma cavities formed during iono-spheric heating experiments, J. Geophys. Res., 94, 9071–9092, 1989.
Br¨andstr¨om, B. U. E., Leyser, T. B., Steen, ˚A., Rietveld, M. T., Gustavsson, B., Aso, T., and Ejiri, M.: Unambigous evidence of HF pump-enhanced airglow, Geophys. Res. Lett., 26, 3561– 3564, 1999.
Carlson, H. C., Wickwar, V. B., and Mantas, G. P.: Observations of fluxes of suprathermal electrons accelerated by HF excited insta-bilities, J. Atmos. Terr. Phys., 44, 1089–1100, 1982.
Djuth, F. T., Isham, B., Rietveld, M. T., Hagfors, T., and La Hoz, C.: First 100 ms of HF modification at Tromsø, Norway, J. Geophys. Res.-Space, 109, 11307, doi:10.1029/2003JA010236, 2004. Gonzalez, S. A., Nicolls, M. J., Sulzer, M. P., and Aponte, N.: An
energy balance study of the lower topside ionosphere using the Arecibo incoherent scatter radar and heating facilities, J. Geo-phys. Res., 110, A11303, doi:10.1029/2005JA011154, 2005. Grydeland, T., Gustavsson, B., Baddeley, L., Lunde, J., and Blixt,
E. M.: Conditional integration of Incoherent Scattering in rela-tion to flickering aurora, J. Geophys. Res., 113, A08305, doi: 10.1029/2008JA013039, 2008.
Gurevich, A. V.: Nonlinear effects in the ionosphere, Physics-Uspekhi, 50, 1091–1121, 2007.
Gustavsson, B., Sergienko, T., Rietveld, M. T., Honary, F., Steen, ˚
A., Br¨andstr¨om, B. U. E., Leyser, T. B., Aruliah, A. L., Aso, T., and Ejiri, M.: First Tomographic estimate of volume distribution of enhanced airglow emission caused by HF pumping, J. Geo-phys. Res., 106, 29105–29123, 2001.
Hansen, J. D., Morales, G. J., and Maggs, J. E.: Large-scale HF-induced ionospheric modifications – Theory and modeling, J. Geophys. Res., 97, 17019–17032, 1992b.
Hedin, A. E.: Extension of the MSIS thermosphere model into the middle and lower atmosphere, J. Geophys. Res., 96, 1159–1172, 1991.
Honary, F., Stocker, A. J., Robinson, T. R., Jones, T. B., Wade, N. M., Stubbe, P., and Kopka, H.: EISCAT observations of elec-tron temperature oscillations due to the action of high power HF radio waves, J. Atmos. Terr. Phys., 55, 1433–1448, 1993. Kelley, M. C., Arce, T. L., Salowey, J., Sulzer, M., Armstrong,
W. T., Carter, M., and Duncan, L.: Density depletions at the 10-m scale induced by the Arecibo heater, J. Geophys. Res., 100, 17367–17376, 1995.
Kosch, M. J., Pedersen, T., Rietveld, M. T., Gustavsson, B., Grach, S. M., and Hagfors, T.: Artificial optical emissions in the high-latitude thermosphere induced by powerful radio waves: An ob-servational review, Adv. Space Res., 40, 365–376, doi:10.1016/j. asr.2007.02.061, 2007.
Leyser, T. B.: Stimulated electromagnetic emissions by high-frequency electromagnetic pumping of the ionospheric plasma, Space Science Rev., 98, 223–328, 2001.
Leyser, T. B., Gustavsson, B., Br¨andstr¨om, B. U. E., Steen, ˚A., Honrary, F., Rietveld, M. T., Aso, T., and Ejiri, M.: Simulta-neous measurements of high-frequency pump-enhanced airglow and ionospheric temperatures at auroral latitudes, Adv. Polar Up-per Atmos. Res., 14, 1–11, 2000.
Mantas, G. P., Carlson, H. C., and LaHoz, C. H.: Thermal Response of the F Region Ionosphere in Artificial Modification Experi-ments by HF Radio Waves, J. Geophys. Res., 86, 561–574, 1981. Pavlov, A. V.: New electron energy transfer rates for vibrational
excitation of N2, Ann. Geophys., 16, 176–182, 1998a, http://www.ann-geophys.net/16/176/1998/.
Pavlov, A. V.: New electron energy transfer and cooling rates by excitation of O-2, Ann. Geophys.-Atm. Hydr, 16, 1007–1013, 1998b.
Pavlov, A. V. and Berrington, K. A.: Cooling rate of thermal elec-trons by electron impact excitation of fine structure levels of atomic oxygen, Ann. Geophys., 17, 919–924, 1999,
http://www.ann-geophys.net/17/919/1999/.
Ponomarenko, P. V., Leyser, T. B., and Thid´e, B.: New electron gy-roharmonic effects in HF scatter from pump-excited magnetic field-aligned ionospheric irregularities, J. Geophys. Res., 104, 10081–10087, 1999.
Rietveld, M., Kosch, M., Blagoveshchenskaya, N., Kornienko, V., Leyser, T., and Yeoman, T.: Ionospheric electron heating, optical emissions and striations induced by powerful HF radio waves at high latitudes: Aspect angle dependence, J. Geophys. Res., 108, 1141, doi:10.1029/2002JA009543, 2003.
Rietveld, M. T., Kohl, H., Kopka, H., and Stubbe, P.: Introduction to ionospheric heating at Tromsø– I. Experimental overview, J. Atmos. Terr. Phys., 55, 577–599, 1993.
Rishbeth, H. and van Eyken, A. P.: EISCAT – Early history and the 1st 10 years of operation, J. Atmos. Terr. Phys., 55, 525–542, 1993.
Robinson, T. R., Honary, F., Stocker, A. J., and Stubbe, P.: First EISCAT observations of the modification of F-region electron temperatures during RF heating at harmonics of the electron gyro frequency, J. Atmos. Terr. Phys., 58, 385–395, 1996.
Roble, R. G. and Hastings, J. T.: Thermal response properties of the Earth’s ionospheric plasma, Planet Space Sci., 25, 217–231, 1977.
Schunk, R. W. and Nagy, A. F.: Electron temperatures in F-region of ionosphere - Theory and observations, Rev. Geophys., 16, 355– 399, 1978.
Shoucri, M. M., Morales, G. J., and Maggs, J. E.: Ohmic heating of the polar F-region by HF pulses, J. Geophys. Res.-Space, 89, 2907–2917, 1984.