Electron temperatures during rapid subauroral ion drift events
R. J. Moett1, A. E. Ennis1, G. J. Bailey1, R. A. Heelis2, L. H. Brace3 1
Upper Atmosphere Modelling Group, School of Mathematics and Statistics, University of Sheeld, Sheeld S3 7RH, UK
2William B. Hanson Center for Space Sciences, University of Texas at Dallas, Richardson, TX 75083, USA 3
Space Physics Research Laboratory, University of Michigan, Ann Arbor, MI 48109-2143, USA
Received: 24 February 1997 / Revised: 29 October 1997 / Accepted: 20 November 1997
Abstract. Examples of data from DE-2 satellite instru-ments are presented. These illustrate the behaviour of plasma parameters in the F-region and adjacent topside ionosphere during rapid sub-auroral ion drift (SAID) events. In particular, a variety of behaviours of the electron temperature Te is demonstrated, both within and equatorward of the SAID region. The Sheeld University plasmasphere-ionosphere model (SUPIM) is used to perform calculations in which a model SAID is applied to a plasma ¯ux tube. The model results indicate that strongly elevated ion temperature (a recognised signature of SAID events) is on occasion sucient to raiseTeto observed values by ion-electron heat transfer. On other occasions, an additional heat source is required. It is suggested that such a source for the electron gas may be due to interaction between the ring current and the plasmasphere at high altitudes. The magnitude of the downward heat ¯ux is consistent with that necessary to produce sub-auroral red arcs. The resulting strongly heated electron gas causes vibrational excitation of molecular nitrogen in the thermosphere.
Key words. Electron temperatureá Subauroral ion
drift áPlasmasphere-ionosphere SUPIM
1 Introduction
Occurrences of a narrow band of rapid westward ion drift (of order 1 km s)1) in the evening sector of the
subauroral ionosphere were detected by instruments on board satellites. References to an early observation (Galperin et al., 1973) and to subsequent clari®cations of the properties and signatures of these drifts (known as
SAID) may be found in the work of Anderson et al., (1993), who investigated the temporal relationship between SAID and auroral substorms. A phenomeno-logical model of SAID production, based on the ideas of Southwood and Wolf (1978) and Harelet al. (1981), has been proposed by Anderson et al. (1993) in order to account for the observed ionospheric signatures and their temporal relationship with substorms.
Using the observed ion drifts as inputs, mathematical models of the ionosphere have been used to study the causes of the observed signatures of SAID (Selleket al., 1991, 1992; Moett et al., 1991, 1992a,b, 1993; KoÈroÈsmezey et al., 1992; Heelis et al., 1993). Elevated and anisotropic ion temperatures, depletion of electron density, changes in ion composition, enhanced ®eld-aligned plasma ¯ows and the behaviour of Hand He in the topside ionosphere have been modelled for various SAID conditions.
The behaviour of the electron temperature Te has been neglected, apart from a passing mention by KoÈroÈsmezey et al. (1992). The chief reason for the neglect is the sparseness of published data of Te during SAID events. The present paper shows examples of observed Te (Sect. 2). Also, the Sheeld University plasmasphere-ionosphere model (SUPIM), with inclu-sion of ion-temperature anisotropy and vibrational excitation of molecular nitrogen (Sect. 3), is used to interpret the Te data (Sect. 4). It is found that ion-electron heat transfer due to the elevated ion tempera-ture Tiis sometimes sucient to generate theTevalues, but on other occasions an additional heat source for the electron gas is required, since Te may become compa-rable with Ti.
2 Observations of SAID
The Dynamics Explorer-2 satellite was launched into a 90°inclination orbit in August, 1981, with apogee near 1000 km altitude and perigee near 300 km altitude. The DE-2 instruments giving data of interest in this study are the ion drift meter (Heelis et al., 1981), the retarding
Correspondence to:R. J. Moett
potential analyser (RPA) (Hanson et al., 1981) and the Langmuir probe (Krehbielet al., 1981). The drift meter provided data on the bulk ion drift velocity in the plane perpendicular to the satellite track, nominally east-west and up-down. The RPA provided the ion concentration and composition and the ion temperature and bulk velocity in the direction of satellite motion. The Langmuir probe provided the electron concentration and temperature.
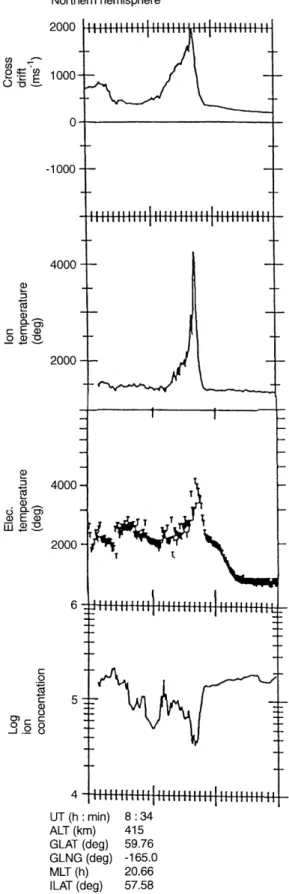
Figure 1 shows DE-2 data from a SAID encountered at about 420 km altitude on day 280 (7 October) in 1982. The top panel illustrates the characteristic spike in the east-west ion drift, with a maximum magnitude of about 2 km s)1at 08:34:40 UT. The peak inTi, trough
in Ni and peak in Te are collocated with the maximum drift. The Ne measured by the Langmuir probe (not shown) agrees with the total ion concentration in the bottom panel.
The elevation ofTiabove its background value in the plasmasphere is caused by ion-neutral frictional heating (Schunket al., 1976; Andersonet al., 1991; Selleket al., 1991). St.-Maurice and Schunk (1977) predicted theo-retically that the ion thermal velocity distribution becomes anisotropic and is distorted towards a toroidal form when the ion drift exceeds the neutral wind speed by more than the neutral thermal speed. Toroidal distributions had been observed by the RPA on the AE-C satellite (St.-Mauriceet al., 1976). More recently, incoherent-scatter radar observations have given evi-dence forTi?>T
k
i , whereTi?and T
k
i are the
perpendic-ular and parallel ion velocity distribution temperatures, respectively (Lockwood et al., 1993, and references therein). In the present context, the RPA essentially sees the perpendicular velocity distribution and thus mea-sures Ti?, which is expected to be signi®cantly greater thanTik (Moettet al., 1993, and references therein). It
is to be noted that the DE-2 satellite passes almost radially through the Ne trough region where the ion drifts are aligned almost perpendicular to the meridian, and thus gradients in the ram ion drift are not expected to be large. Along the satellite track, the maximum density gradient is about one order of magnitude in about 12 s. This amounts to less than a 10% change in the density over the nominal 0.5 s it takes to apply the retarding potential. The eects of this gradient on the derived temperature are small and less than the 8% error in the overall least-square analysis procedure.
The increase in the eective temperature in the loss rates for O+ with N2 and O2 (St.-Maurice and Torr,
1978) leads to increased abundance of NO+ and O2 relative to O+ (Anderson et al., 1991; Moett et al., 1992a) but a net decrease in Ne in the F-region. The depth of the trough is emphasised by being embedded in the evening sector mid-latitude trough (Andersonet al., 1991), which may be substantially formed by plasma stagnation (Spiro et al., 1978).
The Te value reaches 4500 K, comparable with Ti, during the SAID event. Since heat transfer from the ion gas to the electron gas is roughly proportional to temperature dierence, this isprima facie evidence that
Fig. 1. Observations by DE-2 of a SAID event seen after 0834 UT on day 180, 1982.Top panel: zonal component of horizontal ion drift; second panel: ion temperature; third panel: electron temperature;
the electrons have an additional heat source. The latitudinal pro®le ofTe also shows a ``shoulder'' that is located equatorward of the SAID Te spike. This shoulder lies within the outer plasmasphere. There is experimental evidence that Te typically increases with increasing latitude in the outer plasmasphere on the nightside (Brace et al., 1982, 1988). The nightside heating could arise from photoelectron energy that is stored in the plasmasphere during the daytime (Brace et al., 1988) but may also necessitate another and stronger heat source.
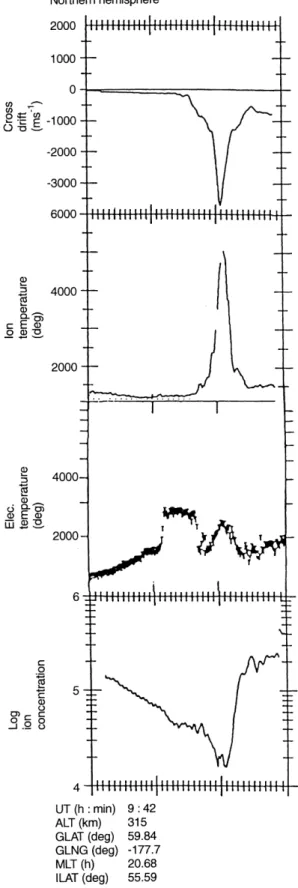
In the second example of SAID data (Fig. 2), the ion drift velocity at about 320 km altitude reaches 4 km s)1
westward at about 0943 UT, with the ion temperature as measured by the RPA about 5000 K. The Te pro®le shows four features worthy of note: (1) a shoulder from about 0941 to 0942UT: (2) an elevation to about 3000 K, between 0942 and 0943UT, followed by (3) a minimum; and (4) a spike reaching 2300 K, where the ion drift speed is at its greatest value. Remarks on feature (1) are similar to those already made on theTe
shoulder in Fig. 1. In this case, in addition, Ne is decreasing with latitude and thus less heat (from whatever source) will be necessary to cause the shoulder. Features (2) and (3) indicate that additional heating of the electron gas may take place equatorward of the SAID or that the observed plasma may have been heated previously in a SAID region. On the other hand, feature (4) (the spike in Te in the SAID event) may be produced by ion-electron heat transfer alone, given the relatively largeTi observed.
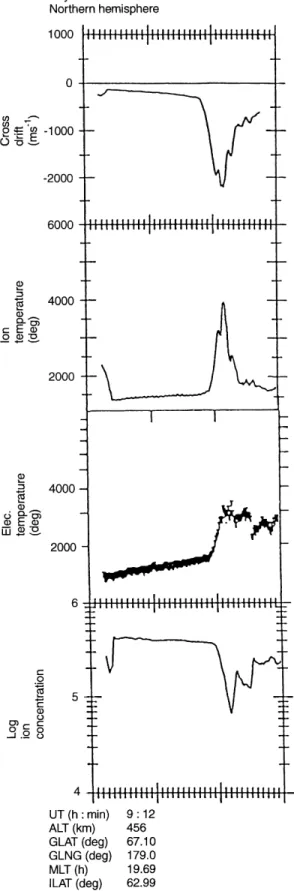
The ®nal example (Fig. 3) shows another form ofTe
behaviour. The value of Te increases steadily with latitude in the outer plasmasphere but is still less than 2000 K before the SAID event is encountered (just after 0912 UT). A complication is the reducing solar zenith angle (<100°), leading to some direct solar heating of the electron gas. In this case, within the SAID region,Te
rises towardsTi, as in Fig. 1.
3 Plasmasphere-ionosphere model
Bailey and Balan (1996) have described the standard version of SUPIM that is based on the model of Bailey and Sellek (1990) and now includes an eccentric dipole geomagnetic ®eld. This version is used for low- and moderate-latitude applications. Brie¯y, values of the concentrations, ®eld-aligned ¯uxes and temperatures of the O;H;He;N2;O2 and NO ions, and the
electrons, are obtained from time-dependent mathemat-ical equations describing the chemmathemat-ical and physmathemat-ical processes controlling the behaviour of the thermal plasma. These equations, for the continuity, momentum and energy balance of the plasma con®ned within closed magnetic ¯ux tubes, are solved along the axis of an eccentric dipole ¯ux tube connecting the conjugate hemispheres.
For the present application, two major recent amendments to SUPIM have been utilised: (1) allow-ance for temperature anisotropy in O and NO, with
these ions also having separately calculated tempera-tures (Moett et al., 1993; Jenkins et al., 1997); (2) inclusion of vibrational excitation of molecular nitrogen
(Ennis et al., 1995). In amendment (1), the ion-neutral frictional heating,Fin, is partitioned into the parallel and perpendicular ion distributions according to ion
fric-tional heating partition coecients, Bk and B?. Thus
BkFinis input to the parallel ion energy balance equation and B?Fin to the perpendicular ion energy balance equation. The values of Bk and B? are based on the Monte Carlo cross-sections of Winkler et al. (1992), whose results were expressed in terms of temperature coecients, bk and b?. The coecients Bk and B? depend on the composition of the ion and neutral gases. A more detailed explanation is given by Moett et al. (1993), in which it is pointed out that expressingTk and
T?in terms ofbkandb?is valid only in the region where the frictional heating is intense and the ion density relatively high (whereas theBkFinandB?Finterms can be used at all altitudes). Typical values forBk andB? have been presented by Jenkinset al. (1997). For amendment (2), the inclusion of vibrationally excited N2(denoted by
N2), the continuity and diusion equations for the ®rst ®ve vibrational states of N2have been solved. The main
source of N2 is excitation by the high-energy tail of the energy distribution of the thermal electron gas. The main loss process of N2, at the altitudes of interest, is through collisions with atomic oxygen.
4 Model runs and results
The model has been used to investigate the processes that may have to be invoked to explain the data. Model results shown here are for 1982 equinox (day 82), an L
value of 4,F10:715010ÿ22W m)2Hz)1andAp4.
The MSIS-86 neutral model atmosphere (Hedin, 1987) gives the neutral concentrations and temperatures; the neutral air wind velocities are taken from the HWM 90 thermospheric wind model (Hedinet al., 1991); and the solar EUV ¯uxes from the EUV 91 solar EUV ¯ux model (Tobiska, 1991).
The model was run for 32 model hours, with a corotating ¯ux tube starting at local noon and ®nishing at 2000 LT. The neutral atmosphere conditions were then held at those relevant to 2000 LT. In order to see the undisturbed evolution of the model ionosphere, a 90-min continuation run was carried out with only the corotation velocity and no applied SAID. Starting from the same initial conditions, the undisturbed evolution was followed for 15 min, after which time a sudden westward EB drift of 2 km s)1 was applied for a
period of 30 min, so that comparison can be made with the data of Fig. 1. The drift was then turned o and the subsequent behaviour followed. The time after a con-tinuation run is started is calledelapsed time. A further set of calculations was made with the use of an additional high-altitude heat source for the electron gas. The heat source was applied linearly about the equator, switched on at the same time as the applied SAID (i.e. at 15 min elapsed time) and lasted for 20 min. In all cases, the model calculations were repeated with the inclusion of vibrationally excited nitrogen.
It should be pointed out that many studies (for example, Spiro et al., 1978; Quegan et al., 1982; Anderson et al., 1993) suggest that a depleted density
in the mid-latitude trough region can be explained by the presence of slow or stagnant ¯ow that is moving poleward in darkness. Thus the background density level, upon which the SAID and/or the high-altitude heat source must act, may be lower than that used in these calculations; we simply have assumed that the background plasma density pro®le used to de®ne the trough is taken to be constant and equal to the values in the auroral zone poleward of the event and in the corotating plasmasphere equatorward of the event.
The results displayed in Figs. 4±8 illustrate the response of the model ionosphere to the input drift magnitude and atmospheric conditions appropriate to the SAID event of Fig. 1. The ion temperature pro®les of Fig. 4 show the elevated ion temperatures, compared with the unperturbed temperature, which are a charac-teristic signature of the SAID event. The O gas has a greater temperature anisotropy than the NO gas because the frictional heat due to the ion-neutral relative motion is partitioned more strongly into the perpendic-ular distribution for the O compared to the NO. The curve labelledTi0 shows the composition-weighted aver-age of the three-dimensional temperatures for the O and NO, i.e.,
Ti0 N O 1
3Tk O
2
3T? O
N NO 1
3Tk NO
2
3T? NO
.n
N ON NOo ;
1
whereN O;N NOare the Oand NO concentra-tions, respectively,Tk OandTk NOare the parallel temperatures of the ion gases andT? OandT? NO the perpendicular temperatures; here O2 has been neglected, since it appears to play a minor role in the
molecular ion abundance during SAID events (Moett et al., 1992a). This average ion temperature enters into the electron-ion heat transfer term in the heat balance equations.
The following factors determine the behaviour of the ion temperatures. Frictional heating is the dominant heat input below about 350 km altitude and this is countered by collisional cooling to the neutral gas. In the topside ionosphere the initial temperature increase is dominated by ®eld-aligned advective transport of hot plasma from lower altitudes until the plasma attains a new scale height (Heeliset al., 1993). The time evolution of the ion temperature is determined by the relatively small contributions of heat conduction in the parallel and perpendicular ion distributions, and by collisional heat transfer between the ion gases and between the ions and electrons.
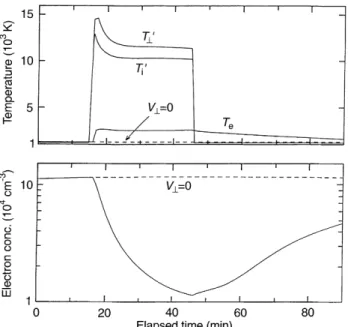
This time evolution is illustrated in Fig. 5 for 420 km altitude, corresponding to the observations of Fig. 1. The average ion temperature, Ti0, is shown because, as
already noted, this is the ion temperature that enters into the electron-ion collisional heat transfer term in the heat balance equations. The other ion temperature, that of the O perpendicular distribution, dominates the temperature measured by the RPA. The satellite is moving almost perpendicular to the magnetic ®eld and, at 420 km altitude, NOcontributes only a few percent to the ion abundance. The agreement of the model
T? Oand the observed quantity (Fig. 1) is satisfacto-ry.
Also presented in Fig. 5 are the Te and Ne values during the model SAID event. The electron temperature rises quickly in response to heat transfer from the ion gas at elevated temperature. During the remainder of the event, Te remains almost constant at around 200 K.
Fig. 4. Model ion temperature pro®les at 30 min elapsed time for a drift of 2 km s)1for atmospheric conditions appropriate to Fig. 1.
Shown are parallel and perpendicular O+and NO+temperatures;T0
i
is the composition-weighted three-dimensional average [see Eq. (1)]
Fig. 5. Model ion temperatures, electron temperature and electron
Examination of the heat balance terms for the electron gas (results not shown) reveals that this value ofTeand those of the F-region represent a balance between ion-electron and ion-electron-neutral collisional heat transfers. The decay in the electron density is caused by increased loss rate of Odue to increased eective temperature for OÿN2 and OÿO2 collisions.
The results in Figs. 4 and 5 were obtained without allowance for vibrational excitation of N2. When the
runs were repeated with the inclusion of vibrationally excited N2, the results (not shown here) diered very
little. This is readily explained by noting that the Te
values of Fig. 5 are not high enough to give signi®cant amounts of N2; it was found that the abundance of N2 was less than 5% at 420 km altitude at 45 min elapsed time. Comparison of Figs. 1 and 5 shows clearly that, while the model results cannot be expected to mimic the observational results exactly, the disagreement in the maximum value ofTe is severe.
The eects onTeof the uncertainty in the calculated values of Ne can be assessed both qualitatively and quantitatively. If the initial values of Ne are increased, the modelled trough values will be far from agreement with the observed values. If the initial values ofNe are decreased, ion-electron heat transfer will be aected more (since it is proportional to Ne2) than
electron-neutral heat transfer or electron thermal conduction. Thus the need for an additional heat source would be strengthened. The magnitude of the proposed heat source depends of the local value of Ne and could be lower than that used in our calculations. These quali-tative assessments were con®rmed by computations that used diering initialNe and so gave diering Ne results within the SAID event. Detailed results are not
present-ed. To quote one example, however: for results corre-sponding to Fig. 5, when theNeminimum is lowered to 4104cm)3,Tereaches 2000 K within the SAID event.
The obvious candidate to improve the model results is an additional heat source for the electron gas due to ring current-plasmasphere interaction (Kozyra et al., 1987; Chandler et al., 1988; Fok et al., 1991). Heat produced at great altitudes is conducted downwards by the electron gas to the ionosphere, raising the electron temperature and thus sometimes causing SAR arcs. The heat ¯ux to the ionosphere in the absence of the additional heat source is shown in Fig. 6. It is seen that at 1000 km altitude the downward ¯ux is about 109eV cm)2s)1. It is found that about an order of
magnitude greater ¯ux is required to elevate Te to the observed level. Such a ¯ux is consistent with the studies by Rees and Roble (1975) and Kozyraet al. (1987; 1990) on SAR arcs. For the results presented in Figs. 6±8, the equatorial heat source was turned on at the time of onset of the model SAID (15 min elapsed time) and switched o at 36 min elapsed time. Figure 6 also shows the boosted downward heat ¯ux.
The eects of this ¯ux are demonstrated in Fig. 7 (without N2) and Fig. 8 (with N2). In both cases, the average ion temperature,Ti0, and the O
+
perpendicular temperature show little change from their values in Fig. 5, for 420 km altitude. In the F-region and adjacent topside, frictional heating and ion-neutral heat transfer dominate the ion thermal balance. Larger changes are evident, however, in the topside ionosphere (above about 500 km; results not shown) since ion-electron heat transfer contributes to the ion heat balance there.
By contrast,Teresponds signi®cantly to the increased electron heat ¯ux, both directly and indirectly. In Fig. 7
(without N2Tepeaks at 4000 K; the strong convergence of the heat ¯ux as theTealtitude gradient changes leads to deposit of heat in the electron gas. The further reduction of theNe value in the trough (Fig. 7) relative to that in Fig. 5 is due to a change of shape of the Ne
altitude pro®le (results not shown); the level of the F2-peak is lowered by the increase in the plasma temper-ature TeTi. Vibrationally excited N2 gives a greater
loss rate with O than unexcited N2, leading to reduced
Ne, which decreases the heat capacity of the electron
gas, tending to raise Te again. Thus the eects of inclusion of N2 (Fig. 8) are to lower theNeminimum to 5104 cm)3and to raise Te further, to a maximum of
4200 K. For the results of Fig. 8, the abundance of N2 was about 10% (at 45 min elapsed time at 420 km).
Control results in Figs. 5, 7 and 8 (i.e. with no SAID) also reveal the eects of the additional heat source for the electrons. Figure 5 simply shows that, with neither the additional heat source nor the frictional heat source,
Te remains unperturbed. Figure 8 shows that the addi-tional heat source, with the help of N2, can alone raiseTe
to about 3800 K.
The behaviour ofTe around 20 min elapsed time in Figs. 7 and 8 may be tentatively suggested as relevant to the spatial shoulders in the observedTe (Figs. 1 and 3) already mentioned. With Ne still relatively high, the eect of the downward heat ¯ux shows a tendency to ¯atten out, whereas at later times, as the Ne trough deepens, the Te value climbs to about 4000 K. Further investigation is needed to determine whether a further contribution to the increasing Te within the shoulder is due to energy stored at high altitudes in the plasma-sphere.
Finally, for this set of model results related to Fig. 1, Fig. 9 illustrates the dependence of theTeandNeresults on the temporal phasing of the additional heat input. If the additional heat input is moved forward by 15 min (now starting at 0 min elapsed time and ending at 21 min elapsed time, while the SAID still begins at 15 min elapsed time), Te reaches a plateau at about 3750 K. It is noticeable in Figs. 7±9 that the time required for cooling of the electron gas after the SAID event is signi®cantly greater than that required for heating the gas. About 45 min after the event, Te has decreased to about 3000 K.
Computations have also been performed with a SAID V? of 4 km s)1. In this case the high ion-neutral relative velocity causes high ion temperatures (Fig. 10), leading to increased abundances of NO. This is consistent with experimental data and model results Fig. 7.As for Fig. 5, but with inclusion of additional heat source for
the electron gas
Fig. 8.As for Fig. 7, but with inclusion of vibrationally excited N2
presented previously (Anderson et al., 1991; Moett et al., 1992a). In Fig. 10 is shown the composition-weighted average perpendicular ion temperature, denot-ed by T?0, for 320 km altitude. This is the parameter most likely to be comparable with the ion temperature measured by the RPA instrument (Fig. 2). Also shown in Fig. 10 areTi0andTe. The former, de®ned by Eq. (1),
is the composition-weighted average three-dimensional ion temperature. The dierence Ti0ÿTeenters into the rate of collisional heat transfer between ions and electrons. It is striking that, although this dierence is very much greater in the 4-km s)1case compared to the
2-km s)1 case (Fig. 5), the resulting Te is only slightly
greater. It is readily shown that the reduction in heat transfer from ions to electrons is due to the severe reduction in Ne (Fig. 10); ion-electron heat transfer depends on Ne2, whereas electron-neutral heat transfer
depends onNeand the neutral concentration.
Results in Fig. 11 show the eects of including an additional heat input and vibrationally excited nitrogen. The heat input was chosen as the same at that used in the 2-km s)1 V
? case, so that the downward ¯uxes of heat in the electron gas are similar to those of Fig. 6. As in Fig. 8,Teexceeds 4000 K by the end of the event. The
Ne value is only slightly aected.
5 Discussion
Examples of observed electron temperature behaviour in SAID events have been presented. These demonstrate responses of Te to particular SAID conditions. Model simulations of SAID events have been performed in order to try to identify the main physical processes that lead to the observed Te behaviour.
However, when discussing the issues that arise from the model-observational comparisons, two general
ca-veats must be borne in mind. First, the observations have been obtained along the single trajectories of the satellite. Each set of results represents a snapshot of a SAID event over a period of a few minutes. In contrast, the model calculations are performed for an EB
drifting tube of plasma. Care must therefore be exercised in attempting to separate spatial or temporal features. As a ¯ux tube enters the SAID region, the temporal behaviour of the plasma is simulated by the model calculations; the spatial structure at a certain time is made up of the total set of ¯ux tubes entrained in the SAID event at that time. Thus the behaviour of the plasma within a single ¯ux tube is indicative of the behaviour that is likely to be observed, but an exact correspondence is not possible without detailed infor-mation on the time evolution and spatial extent of the SAID. Secondly, the model Ne values within the SAID event depend on the values ofNe previous to the event. These initial values are not well known. The period of entrainment of the plasma in the convection stagnation region, prior to the SAID event, is also not known. Thus computations have been performed with diering initial values of Ne; these results con®rm the discussion and conclusions that follow.
The modelled elevation and anisotropy ofTi due to the SAID is in accord with the present and previous observational results and with previous model results. The resulting dierence in Ti and Te leads to heat transfer from the ions to the electrons. The results show that this can raiseTe(from less than 1500 K) to between 2000 and 3000 K for both theV? 2 andV?4 km s)1 cases; in the latter case,Neis likely to be less than in the former case and so compensates (in the rate of heat transfer) for the greater TiÿTe dierence. This modest increase in Te is (1) clearly compatible with the results within the SAID region of Fig. 2, and (2) perhaps compatible with the SAID results of Fig. 3.
Fig. 10.Model ion temperatures, electron temperature and electron concentration, for an altitude of 320 km, as a function of elapsed time for input drift of 4 km s)1(without additional heat source and N
2)
Fig. 11.As for Fig. 10, but with additional heat source and inclusion of N
It is evident also that the greater elevation ofTein the SAID region in Fig. 1 requires an additional heat source. The model results demonstrate that the down-wards ¯ux of heat usually invoked to explain the occurrence of SAR-arcs (Kozyra et al., 1987) is of the correct order of magnitude to explain the elevated Te. Furthermore, Catonet al. (1996) found that downward heat ¯ow from the magnetosphere was needed as an input in order to obtain agreement with EISCAT topside measurements.
Liu et al. (1995) and Caton et al. (1996) have also invoked the eects of soft electron precipitation in modelling electron temperature and plasma up¯ows observed by DE-2 and by EISCAT, respectively. By contrast, the SAID events lie equatorward of the region of electron precipitation that has a source in the plasma sheet. Mechanisms for producing the electric ®eld in the trough may require the SAID to be embedded in the region of weak ion precipitation associated with the inner edge of the ring current. Thus any heat source required to account for elevated electron temperatures in SAID events is identi®ed as arising from a source in the ring current.
The persistence of elevated Te after the SAID event in the model results bears on consideration of the elevated Te feature seen equatorward of the SAID in Fig. 2. This feature may arise directly from heating of the electron gas that is occurring at that location and that presumably arises from the ring current. However, the plasma with elevatedTemay have recently emerged from a SAID region, and so the heating may have ceased. With the Te value about 3000 K in the feature, it is likely that the origin of the heated plasma still requires additional heating either in, or equatorward of, a SAID region.
Allowance for the vibrational excitation of molecular nitrogen by thermal electrons has negligible eect when the increase inTeis modest. This is to be expected, since the high-energy tail of the electron distribution is insuciently intense. On the other hand, when the additional heat source is applied and Te is further elevated, vibrationally excited N2 plays a noticeable
role. The excitation that occurs is sucient to increase the loss rate of O+ with N2and so deepen the density
trough within the SAID event. There is some positive feedback since lowerNe leads to higherTe.
6 Conclusions
From comparison of the observational and model results, it is concluded that:
1. The ion temperatures observed during SAID events are caused by ion-neutral frictional heating which is preferentially partitioned into the ion perpendicular distribution.
2. Heat transfer from the ion gas to the thermal electron gas can raise the electron temperature to between 2000 and 3000 K.
3. To obtain greater elevations of electron temperature, an additional heat source for the electron gas is
required. It is suggested that the likely candidate is ring current-plasmasphere interaction; the downward ¯ux heat required in the present study is consistent with that used in modelling SAR arcs and in modelling topside measurements by EISCAT. The persistence of increased electron temperatures after a SAID event raises the possibility that plasma with elevated Te observed equatorward of a SAID may recently have emerged from such an event.
4. Vibrational excitation of molecular nitrogen by higher-energy thermal electrons can deepen the plas-ma density trough, associated with the SAID, by increasing the O+ loss rate. This in turn allows the electron temperature to increase further.
Acknowledgements. This work was supported by grant GR/L 20238 from the Particle Physics and Astronomy Research Council at the University of Sheeld and by NSF grants ATM-9311392 and ATM-9615064 at the University of Texas at Dallas.
Topical Editor D. Alcayde thanks J. L. Horwitz and J. Sojka for their help in evaluating this paper.
References
Anderson, P. C., W. B. Hanson, and R. A. Heelis,The ionospheric
signatures of rapid subauroral ion drifts,J. Geophys. Res.,96, 5785, 1991.
Anderson, P. C., W. B. Hanson, R. A. Heelis, J. D. Craven, D. N.
Baker, and L. A. Frank,A proposed production model of rapid
subauroral ion drifts and their relationship to substorm evolution,J. Geophys. Res.,98, 6069, 1993.
Bailey, G. J., and N. Balan, A low-latitude
ionosphere-plasma-sphere model,STEP Handbook on Ionospheric Models, Ed. R. W. Schunk, Utah State University, p. 173; 1996.
Bailey, G. J., and R. Sellek,A mathematical model of the Earth's
plasmasphere and its application in a study of He+atL= 3.0,
Ann. Geophysicae,8,171, 1990.
Brace, L. H., R. F. Theis, and W. R. Hoegy,A global view of
F-region electron density and temperature at solar maximum,
Geophys. Res. Lett.,9,989, 1982.
Brace, L. H., C. R. Chappell, M. O. Chandler, R. H. Comfort, J. L.
Horwitz, and W. R. Hoegy, F-region electron temperature
signatures of the plasmasphere based on Dynamics Explorer 1 and 2 measurements,J. Geophys. Res.,93,1896, 1988.
Caton, R., J. L. Horwitz, P. G. Richards, and C. Liu,Modeling of
F-region ionospheric up¯ows observed by EISCAT, Geophys. Res., Lett.,23,1537, 1996.
Chandler, M. O., J. U. Kozyra, J. L. Horwitz, R. H. Comfort, and
L. H. Brace, Modeling of the thermal plasma in the outer
plasmasphere ± a magnetospheric heat source, in Modeling magnetospheric plasma Eds. T. E. Moore and J. H. Waite Jr. AGU Monogr.44,p. 101, 1988.
Ennis, A. E., G. J. Bailey, and R. J. Moett,Vibrational nitrogen concentration in the ionosphere and its dependence on season and solar cycle,Ann. Geophysicae,13,1164, 1995.
Fok, M.-C., J. U. Kozyra, and L. H. Brace,Solar cycle variation in the subauroral electron temperature enhancement: comparison of AE-C and DE2 satellite observations,J. Geophys. Res.,96, 1861, 1991.
Galperin, Y. I., Y. N. Ponomarov, and A. G. Zosinova, Direct
measurements of ion drift velocity in the upper atmosphere during a magnetic storm,Kosm. Issled.,11,273, 1973. Hanson, W. B., R. A. Heelis, R. A. Power, C. R. Lippincott, D. R.
Zucarro, B. J. Holt, L. H. Harmon, and S. Sanatani, The
Harel, M., R. A. Wolf, R. W. Spiro, P. H. Rei, C. K. Chen, W. J.
Burke, F. J. Rich, and M. Smiddy,Quantitative simulation of a
magnetospheric substorm, 1, Comparison with observations,J. Geophys. Res.,86,2261, 1981.
Hedin, A. E.,MSIS-86 thermospheric model,J. Geophys. Res.,92,
4649, 1987.
Hedin, A. E., M. A. Biondi, R. G. Burnside, G. Hernandez, R. M. Johnson, T. L. Killeen, C. Mazaudier, J. W. Meriwether, J.E. Salah, R. J. Sica, R. W. Smith, N. W. Spencer, V. B. Wickwar,
and T. S. Virdi,Revised global model of thermosphere winds
using satellite and ground-based observations,J. Geophys. Res., 96,7657, 1991.
Heelis, R. A., W. B. Hanson, C. R. Lippincott, D. R. Zucarro, L. H.
Harmon, B. J. Holt, J. E. Doherty, and R. A. Power,The ion
drift meter for Dynamics Explorer-B, Space Sci. Instrum., 5, 511, 1981.
Heelis, R. A., G. J. Bailey, R. Sellek, R. J. Moett, and B. Jenkins, Field-aligned drifts in subauroral ion drift events,J. Geophys. Res.,98,21493, 1993.
Jenkins, B., R. J. Moett, J. A. Davies, and M. Lester,Nightside
ion frictional heating: atomic and molecular ion temperature anisotropy and ion composition changes,J. Atmos. Solar-Terr. Phys.,59,1329, 1997.
KoÈroÈsmezey, A., C. E. Rasmussen, T. I. Gombosi, and G. V. Khazanov,Anisotropic ion heating and parallel O+acceleration in regions of rapidEBconvection,Geophys. Res. Lett.,19, 2289, 1992.
Kozyra, J. U., E. G. Shelley, R. H. Comfort, L. H. Brace, T. E.
Cravens, and A. F. Nagy, The role of ring current O+in the
formation of stable auroral red arcs,J. Geophys. Res.,92,7487, 1987.
Kozyra, J. U., C. E. Valladares, H. C. Carlson, M. J. Buonsanto, and D. W. Slater,A theoretical study of the seasonal and solar cycle variations of stable auroral red arcs,J. Geophys. Res.,95, 12219, 1990.
Krehbiel, J. P., L. H. Brace, R. F. Theis, W. H. Pinkus, and R. B.
Kaplan,The Dynamics Explorer Langmuir probe instrument,
Space Sci. Instrum.,5,493, 1981.
Liu, C., J. L. Horwitz, and P. G. Richards,Eects of frictional ion heating and soft-electron precipitation on high-latitude F-region up¯ows,Geophys. Res. Lett.,22,2713, 1995.
Lockwood, M., I. W. McCrea, G. H. Millward, R. J. Moett, and H. Rishbeth, EISCAT observations of ion composition and temperature anisotropy in the high-latitude F-region,J. Atmos. Terr. Phys.,55,895, 1993.
Moett, R. J., R. Sellek, and G. J. Bailey,The behaviour of H+
and He+ ions in the topside ionosphere during a short-lived
subauroral ion drift,Planet. Space Sci.,39,1209, 1991.
Moett, R. J., R. A. Heelis, R. Sellek, and G. J. Bailey, The
temporal evolution of the ionospheric signatures of subauroral ion drifts.Planet. Space Sci.,40,663, 1992a.
Moett, R. J., G. J. Bailey, and B. Jenkins, Eects of greatly
increased O+loss in the ionospheric F-region, Planet. Space Sci.,40,1631, 1992b.
Moet, R. J., B. Jenkins, and G. J. Bailey,A modelling study of
anisotropic ion temperatures generated in the F-layer by subauroral ion drifts.Ann. Geophysicae,11,1051, 1993. Quegan, S., G. J. Bailey, R. J. Moett, R. A. Heelis, T. J.
Fuller-Rowell, D. Rees, and R. W. Spiro, A theoretical study of the
distribution of ionization in the high-latitude ionosphere and plasmasphere: ®rst results on the mid-latitude trough and the light-ion trough,J. Atmos. Terr. Phys.,44,619, 1982.
Rees, M. H., and R. G. Roble, Observations and theory of the
formation of stable auroral red arcs,Rev. Geophys. Space Phys.,
13,201, 1975.
Schunk, R. W., P. M. Banks, and W. J. Raitt,Eects of electric
®elds and other processes upon the nighttime high-latitude F layer,J. Geophys. Res.,81,3271, 1976.
Sellek, R., G. J. Bailey, R. J. Moett, R. A. Heelis, and P. C. Anderson,Eects of large zonal plasma drifts on the subauroral ionosphere,J. Atmos. Terr. Phys.,53,557, 1991.
Sellek, R., R. J. Moett, and G. J. Bailey,Eects of rapid zonal
plasma ¯ow in the mid-latitude ionosphere: modulation of the ®eld-aligned plasma ¯ow by neutral air upwelling,Adv. Space Res.,12,(6), 171, 1992.
Southwood, D. J., and R. A. Wolf, An assessment of the role of
precipitation in magnetospheric convection, J. Geophys. Res., 83,5227, 1978.
Spiro, R. W., R. A. Heelis, and W. B. Hanson,Ion convection and
the formation of the mid-latitude F-region ionization trough,
J. Geophys. Res.,83,4255, 1978.
St.-Maurice, J.-P., and R. W. Schunk, Auroral ion velocity
distributions for a polarization collision model,Planet. Space Sci.,25,243, 1977.
St.-Maurice, J.-P., and D. G. Torr,Nonthermal rate coecients in
the ionosphere: the reactions of O+ with N2, O2 and NO,
J. Geophys. Res.,83,969, 1978.
St.-Maurice, J.-P., W. B. Hanson, and J. C. G. Walker,Retarding
potential analyzer measurements of the eect of ion-neutral collisions on the ion velocity distribution in the auroral ionosphere,J. Geophys. Res.,81,5438, 1976.
Tobiska, W. K., Revised solar extreme ultraviolet ¯ux model,
J. Atmos. Terr. Phys.,53,1005, 1991.
Winkler, E., J.-P. St.-Maurice, and A. R. Barakat, Results from