ACPD
13, 14377–14403, 2013Intense atmospheric pollution modifies
weather
A. Ding et al.
Title Page
Abstract Introduction
Conclusions References
Tables Figures
◭ ◮
◭ ◮
Back Close
Full Screen / Esc
Printer-friendly Version Interactive Discussion
Discussion
P
a
per
|
Dis
cussion
P
a
per
|
Discussion
P
a
per
|
Discussio
n
P
a
per
Atmos. Chem. Phys. Discuss., 13, 14377–14403, 2013 www.atmos-chem-phys-discuss.net/13/14377/2013/ doi:10.5194/acpd-13-14377-2013
© Author(s) 2013. CC Attribution 3.0 License.
Atmospheric Chemistry and Physics
Open Access
Discussions
Geoscientiic Geoscientiic
Geoscientiic Geoscientiic
This discussion paper is/has been under review for the journal Atmospheric Chemistry and Physics (ACP). Please refer to the corresponding final paper in ACP if available.
Intense atmospheric pollution modifies
weather: a case of mixed biomass
burning with fossil fuel combustion
pollution in the eastern China
A. J. Ding1, C. B. Fu1, X. Q. Yang1, J. N. Sun1, T. Pet ¨aj ¨a2, V.-M. Kerminen2, T. Wang3, Y. N. Xie1, E. Herrmann1,2, L. F. Zheng1, W. Nie1, X. L. Wei4, and M. Kulmala2
1
Institute for Climate and Global Change Research & School of Atmospheric Sciences, Nanjing University, Nanjing, 210093, China
2
Department of Physics, University of Helsinki, 00014 Helsinki, Finland
3
Department of Civil and Environmental Engineering, The Hong Kong Polytechnic University, Hong Kong, China
4
Shenzhen Meteorological Bureau, Shenzhen, China
Received: 30 April 2013 – Accepted: 19 May 2013 – Published: 3 June 2013
Correspondence to: C. Fu ([email protected]) and M. Kulmala ([email protected])
ACPD
13, 14377–14403, 2013Intense atmospheric pollution modifies
weather
A. Ding et al.
Title Page
Abstract Introduction
Conclusions References
Tables Figures
◭ ◮
◭ ◮
Back Close
Full Screen / Esc
Printer-friendly Version Interactive Discussion
Discussion
P
a
per
|
Dis
cussion
P
a
per
|
Discussion
P
a
per
|
Discussio
n
P
a
per
|
Abstract
The influence of air pollutants, particularly aerosols, on regional and global climate is widely investigated, but only a very limited number of studies reports their impacts on everyday weather. In this work, we present for the first time direct (observational) evidence of a clear effect how a mixed atmospheric pollution changes the weather 5
with a substantial modification in air temperature and rainfall. By using comprehensive measurements in Nanjing, China, we found that mixed agricultural burning plumes with fossil fuel combustion pollution resulted in a decrease of solar radiation by more than 70 %, of sensible heat flux over 85 %, a temperature drop by almost 10 K, and a change of rainfall during daytime and nighttime. Our results show clear air pollution – weather 10
interactions, and quantify how air pollution affects weather with the influence of air pollution-boundary layer dynamics and aerosol-radiation-cloudy feedbacks. This study highlights a cross-disciplinary needs to study the environmental, weather and climate impact of the mixed biomass burning and fossil fuel combustion sources in the East China.
15
1 Introduction
Air pollution and weather forecast are traditionally considered as two separate topics of interest in the field of atmospheric science. Synoptic weather is known to be an important factor driving air pollution episodes through processes like turbulent mixing, long-range transport, photochemical production and deposition (e.g. Hegarty et al., 20
2007; Ding et al., 2009; Zhang et al., 2013). Many efforts have been put into devel-oping methods of air quality prediction based on the numerical weather forecasts (Ja-cobson, 2001a; Otte et al., 2005; Byun and Schere, 2006). However, only very few attempts were performed to investigate the weather-air pollution relations on the other way round, i.e. to understand the effects of air pollution on synoptic weather (e.g. Grell 25
ACPD
13, 14377–14403, 2013Intense atmospheric pollution modifies
weather
A. Ding et al.
Title Page
Abstract Introduction
Conclusions References
Tables Figures
◭ ◮
◭ ◮
Back Close
Full Screen / Esc
Printer-friendly Version Interactive Discussion
Discussion
P
a
per
|
Dis
cussion
P
a
per
|
Discussion
P
a
per
|
Discussio
n
P
a
per
Due to a rapid industrialization and a vast consumption of fossil fuel (FF), China has been suffering from poor air quality for decades (He et al., 2002; Richter et al., 2005; Ding et al., 2008; Tie and Cao, 2009). The Eastern and Northern China Plain, which contains more than half of the population of China and 10 % of the world, is characterized with an intense atmospheric pollution due to high amounts of FF com-5
bustion (Richter et al., 2005; Chan and Yao, 2008; Tie and Cao, 2009). During the last few years, many studies were conducted with a focus on air quality monitoring and understanding reasons and consequences of air pollution from these anthropogenic pollutants (e.g. Zhang et al., 2003, 2013; Xu et al., 2008; Ding et al., 2013). Meanwhile, this area is one of the most important agricultural bases in China and the agricultural 10
activities, like intensive seasonally burning activities of agricultural straw, could cause mixed air pollution in this region (e.g. Wang et al., 2004; Yuan et al., 2010; Zhang et al., 2011; Ding et al., 2013). Many studies shows that biomass burning (BB) smoke can change synoptic weather significantly (Robock et al., 1991; Andreae et al., 2004; Feingold et al., 2005; Grell et al., 2011), and that the mixed aerosols from BB and FF 15
pollutions played unique roles on changing regional even global climate (e.g. Jacob-son, 2001b; Ramanathan et al., 2007). However, to the best of our knowledge, studies of air pollution-meteorology interactions in China mainly focused on FF pollutants (e.g. Zhang et al., 2007; Gong et al., 2007; Qian et al., 2009; Fan et al., 2012), and there is a lack of direct observation evidence showing the impact from either FF or BB pollutions 20
on everyday weather.
In this study, we report an outstanding case observed in western Yangtze River Delta (YRD) of East China during the intensive BB period in June 2012. Based on a compre-hensive field measurement data, we explore the important connections between the mixed air pollution and synoptic weather in this region by showing a significant weather 25
ACPD
13, 14377–14403, 2013Intense atmospheric pollution modifies
weather
A. Ding et al.
Title Page
Abstract Introduction
Conclusions References
Tables Figures
◭ ◮
◭ ◮
Back Close
Full Screen / Esc
Printer-friendly Version Interactive Discussion
Discussion
P
a
per
|
Dis
cussion
P
a
per
|
Discussion
P
a
per
|
Discussio
n
P
a
per
|
analysis and discussions in Sect. 3. A summary and discussion on the implications are given in Sect. 4.
2 Experiment, data and modeling
2.1 Field experiment
We performed an intensive field measurement of trace gases, aerosols, fluxes and me-5
teorological parameters in Nanjing during May–June 2012 to characterize the impact of BB activities on the environment in the western YRD of East China. Aerosols and trace gases (O3, CO, SO2, NO, NOxand NOy) were measured at the Xianlin “flagship”
central site of the Stations for Observing Regional Processes of the Earth System (SORPES) (Ding et al., 2013), which is located on the top a hill (about 40 m a.g.l.) in 10
20 km east of suburban Nanjing (118◦57′10′′E, 32◦07′14′′N). Ding et al. (2013) gave detailed information of trace gases and PM2.5 mass measurements, which have been
continuously conducted at the site since July 2011. Besides these parameters, scat-tering and backscatscat-tering coefficients were measured with a Nephelometer (Aurora 3000), and water soluble ions of PM2.5were measured on-line with a time resolution of
15
1 h using Monitor for Aerosols and Gases in Air (MARGA, Metrohm Co). Sub-micron particle sizing (6–800 nm) was measured using the differential mobility particle sizer (DMPS) (Aalto et al., 2001; Herrmann et al., 2013). Solar radiation, sensible heat flux were measured at an urban “satellite” flux site 15 km southwest to the Xianlin site, and details about the instruments was given by Liu et al. (2009).
20
2.2 Meteorological modeling and weather forecast products
ACPD
13, 14377–14403, 2013Intense atmospheric pollution modifies
weather
A. Ding et al.
Title Page
Abstract Introduction
Conclusions References
Tables Figures
◭ ◮
◭ ◮
Back Close
Full Screen / Esc
Printer-friendly Version Interactive Discussion
Discussion
P
a
per
|
Dis
cussion
P
a
per
|
Discussion
P
a
per
|
Discussio
n
P
a
per
day during the study period. In this work, the WRF-ARW model was run in three two-way nested domains, with a horizontal grid size of 45, 15 and 5 km, covering East Asia, East China and the YRD region, respectively. All domains have 37 terrain-following vertical sigma levels. A Mellor–Yamada–Janjic turbulence kinetic energy scheme was used for PBL closure, and a Kain–Fritsch (new Eta) scheme was chosen for cumu-5
lus parameterization. A similar model configuration has been applied in our previous studies (e.g. Ding et al., 2009).
We used the NCEP Final Operational Global Analysis (FNL) data, on 1.0◦
×1.0◦grids and 26 vertical pressure levels, prepared operationally every six hours, to provide the boundary and initial conditions for the WRF simulations. This product is from the Global 10
Data Assimilation System (GDAS), which continuously collects observational data from the Global Telecommunications System (GTS), and other sources, for many analyses. The original data are available from the RDA (http://dss.ucar.edu) in dataset number ds083.2. We also used 12 h air temperature forecasts data provided by the European Centre for Medium-Range Weather Forecasts (ECMWF). The data were operationally 15
made by ECMWF Atmospheric forecast model. The products have a horizontal reso-lution as 0.125◦
×0.125◦ and a temporal resolution as 6 h. Besides these simulation results, we also referenced the daily weather forecasts report made by the Chinese Meteorological Agency and Jiangsu Provincial Meteorological Bureau. These forecasts were generally made based on ensemble numerical modeling products and referencing 20
of global modeling products from ECMWF and Japan Meteorological Agency etc.
3 Results and discussions
3.1 Chemical measurements
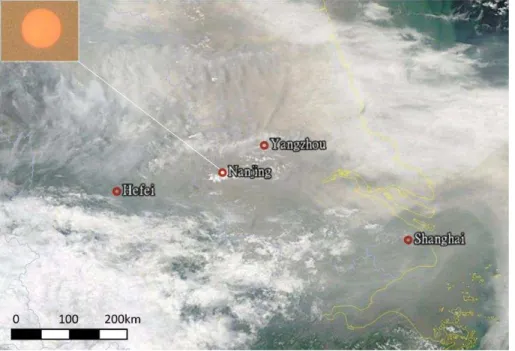
During 9–11 June 2012, a thick yellow haze blanketed Nanjing and adjacent cities in the west Yangtze River Delta region. Satellite image showed a brown and a foggy belt 25
ACPD
13, 14377–14403, 2013Intense atmospheric pollution modifies
weather
A. Ding et al.
Title Page
Abstract Introduction
Conclusions References
Tables Figures
◭ ◮
◭ ◮
Back Close
Full Screen / Esc
Printer-friendly Version Interactive Discussion
Discussion
P
a
per
|
Dis
cussion
P
a
per
|
Discussion
P
a
per
|
Discussio
n
P
a
per
|
haze with very low visibility. MODIS Active fire data clearly showed that the intensive burning activities occurred in the north of Anhui Province on 9 June 2012 (Fig. 2). Ding et al. (2013) briefly discussed weather and air mass transport characteristics for this case, and clearly showed the agriculture burning plumes transported from the north to Nanjing and adjacent areas on 10 June 2012.
5
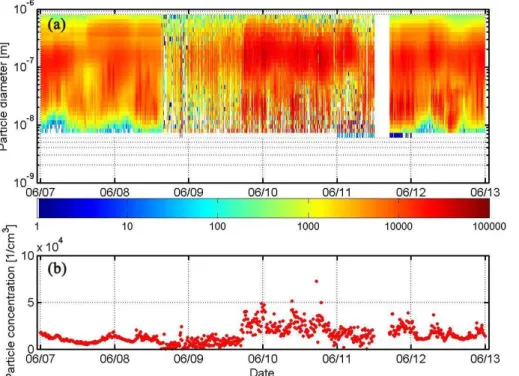
We observed extremely high PM mass and number concentrations together with high concentrations of trace gases like CO, NOy, and SO2 from late afternoon of 9 June to the morning of 11 June (Fig. 4). In late afternoon of 9 June, 2012, the PM2.5
con-centration experienced a sharp increase with a 5 min maximum up to 468 µg m−3 at 20:00 LT, followed by the high concentration of PM2.5 mass with an average value in 10
excess of 200 µg m−3that lasted for about 36 h. The total mass concentration of PM
2.5
together with the water soluble ions also show that carbonaceous matter contributed a large fraction (about 50 %) of the mass during the pollution event. A measurement of aerosol number size distribution during the event shows high aerosol number con-centrations, particularly in the nucleation mode sizes at 10–25 nm and in accumulation 15
mode sizes at 100–200 nm, indicating emissions of both ultrafine particles and larger particles (Fig. 4). The concurrent measurement of aerosol optical properties shows that the “dry” aerosol scattering coefficients reached up to 5000 Mm−1during the pollution event (Fig. 3b). The real aerosol scattering was even more pronounced considering the hygroscopic growth of aerosol particles under conditions of high relative humidity 20
(Kulmala et al., 2001; Malm and Day, 2001; Liu et al., 2011).
The time series of water-soluble ions of PM2.5given in Fig. 3b also indicated a high concentration of sulfate (SO2−
4 ), with an average value of about 40 µg m
−3during the
pollution episode. Previous studies reported a high proportion of sulfate in PM2.5 (20–
30 %) in the eastern China region because of a high consumption of coal (Zhou et al., 25
ACPD
13, 14377–14403, 2013Intense atmospheric pollution modifies
weather
A. Ding et al.
Title Page
Abstract Introduction
Conclusions References
Tables Figures
◭ ◮
◭ ◮
Back Close
Full Screen / Esc
Printer-friendly Version Interactive Discussion
Discussion
P
a
per
|
Dis
cussion
P
a
per
|
Discussion
P
a
per
|
Discussio
n
P
a
per
gas phase SO2and particulate sulfate with a maximum of 23.5 ppbv and 69.9 µg m− 3
, respectively. As the biomass burning produces smaller emissions of SO2 and sulfate
than FF combustion, these results suggest a mixture of pollution from FF combus-tion and BB plumes. A high percentage of KCl (about 10 %) and carbonaceous matter (about 50 %) of the mass during the event confirmed that Nanjing was influenced by 5
young BB smoke (Li et al., 2003). The measurements also showed a very high concen-tration and fraction of sulfate (SO2−
4 ) in the PM2.5 mass, especially in the afternoon of
10 June when sulfate reached a maximum concentration of 69.9 µg m−3accompanied with a SO2plume over 20 ppbv.
The scatter plots of KCl, sulfate and CO vs. PM2.5mass concentration for the episode 10
and non-episode days given in Fig. 5 suggests a remarkable difference in the chemical composition of particulate matter during the episode and non-episode days. A higher KCl/PM2.5ratio, and a lower sulfate/PM2.5and CO/PM2.5ratios were well defined, sug-gesting a different emission and chemical characteristics of the BB and FF combustion plumes. Examining of black ellipses given in Fig. 5a–c, which mark the data on the 15
afternoon of 10 June, suggests that the observed air masses had a clear signal of BB plumes (see high KCl/PM2.5ratio in Fig. 5a) and also had signals from FF combustion
(see the marked data and the blue regression line of SO2−
4 and CO vs. PM2.5in Fig. 5b
and c, respectively). These results further confirm that the pollution on 10 June was caused by a mixture of particulate pollutants originating both from the FF burning and 20
from the BB activities.
3.2 Evidences of weather modification
The high concentrations of scattering and absorbing aerosols could affect significantly the radiative transfer of solar radiation during the episode. Both measured solar radi-ation intensity and sensible heat flux showed very low values on 10 June (128.5 and 25
ACPD
13, 14377–14403, 2013Intense atmospheric pollution modifies
weather
A. Ding et al.
Title Page
Abstract Introduction
Conclusions References
Tables Figures
◭ ◮
◭ ◮
Back Close
Full Screen / Esc
Printer-friendly Version Interactive Discussion
Discussion
P
a
per
|
Dis
cussion
P
a
per
|
Discussion
P
a
per
|
Discussio
n
P
a
per
|
meteorological agency suggested a daily maximum air temperature as high as 34◦C and formation of thunderstorms in the afternoon of 10 June in Nanjing. However, the measured daily maximum air temperature rose only up to 26.5◦C, and no any rainfall occurred in Nanjing and the surrounding cities during that afternoon. The difference between the forecast and the observations indicate a modification of weather by the air 5
pollution.
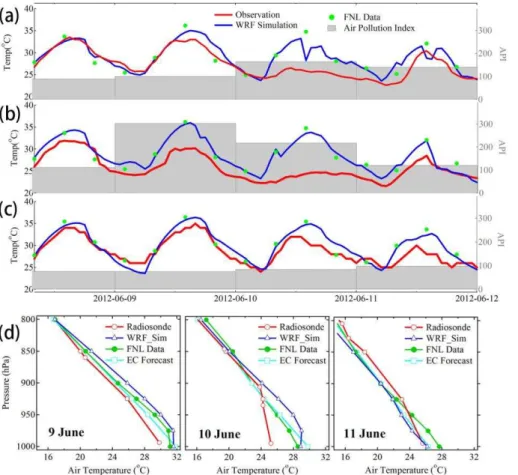
In order to understand to what extent the air pollution changed the regional and local meteorological conditions, we compared the observed surface air temperature with WRF simulations and NCEP FNL data for the three cities, Nanjing, Yangzhou and Hefei, in the period of 8–11 June (Fig. 6a–c). The simulations and data showed 10
a good agreement with observations for the three cities when heavy air pollution was not present. However, a large difference in the air temperature occurred in Nanjing on 10 June, with a daily maximum anomaly as large as 7.1◦C. At Yangzhou the di
fference was 5.9◦C and 9.2◦C on 9 and 10 June, respectively. Even larger di
fferences were detected between the FNL data and the observations. For Hefei city, which was not 15
affected by the pollution event during the four days, only a small difference (∼1.2◦C in average) was found between the simulated and observed air temperature.
Here our results suggest a much more substantial cooling (5–10◦C) associated with extreme pollution events than previously observed (1–5◦C) under the influence of for-est fire smokes in remote areas like Amazon, Africa, Siberia and Wfor-est United States 20
(Wexler, 1950; Robock, 1991; Carmona et al., 2008). Since clouds also play an im-portant role in the radiative transfer (Andreae et al., 2004; Li et al., 2011; Wang et al., 2012), we calculated the ratio of “blocked” solar radiation over PM2.5mass (R SR/PM).
Figure 3c shows a similar diurnal pattern of the ratio on 10 June with 8–9 June but a different one on 11 June, on which day the high peaks of the ratio were associated 25
ACPD
13, 14377–14403, 2013Intense atmospheric pollution modifies
weather
A. Ding et al.
Title Page
Abstract Introduction
Conclusions References
Tables Figures
◭ ◮
◭ ◮
Back Close
Full Screen / Esc
Printer-friendly Version Interactive Discussion
Discussion
P
a
per
|
Dis
cussion
P
a
per
|
Discussion
P
a
per
|
Discussio
n
P
a
per
but it looked like an orange in color in broad daylight in Nanjing (see the left-up corner of Fig. 1).
To further understand the difference in vertical air temperature profiles, we compared results from radiosonde measurements, WRF simulations, FNL data and ECMWF 12 h forecasts at Nanjing for 20:00 LT of 9–11 June (Fig. 6d). On the pre- and post-event 5
days, the numerical models agreed quite well with the radiosonde data, but for 10 June, a significant difference is apparent extending from the surface to the 950-hPa level. Converting the temperature profile into potential temperature identified a stable bound-ary layer below 900 hPa, which corresponds approximately the lowermost 1 km of the planetary boundary layer (PBL). This kind of inverted potential temperature profile is 10
very likely caused by the heat absorbed to the suspended aerosols like black carbon in the upper PBL, whereas the lower PBL cools down due to reduced amount of so-lar radiation reaching down to the surface. Previous studies have reported such kinds of effects in smoke plumes and suggested that the upper level heating together with a surface cooling could increase the PBL stability (Andreae et al., 2004; Feingold et al., 15
2005).
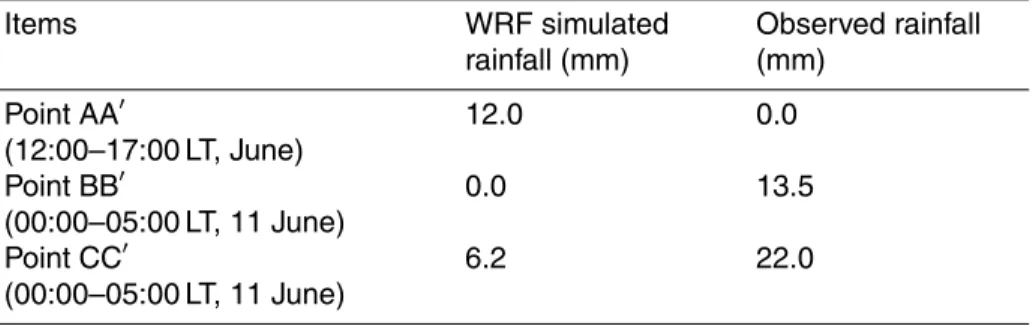
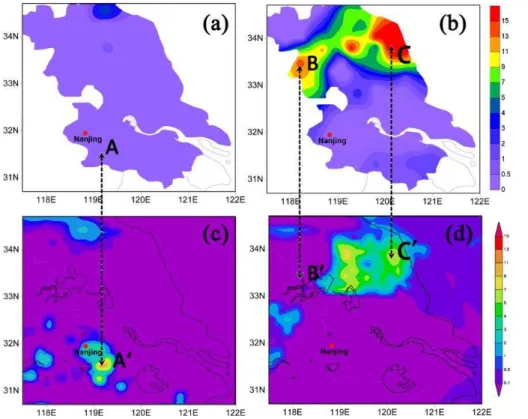
Besides the direct effects and associated feedbacks outlined above, there are indi-cations that aerosols affected the precipitation pattern, especially convective precipi-tation. Figure 7 shows a comparison of WRF simulated and observed 6 h rainfall over Jiangsu Province for the periods of afternoon of 10 June and early morning of 11 June 20
2012. For the afternoon of 10 June, it can be clearly seen that the WRF simulation sug-gested a convective rainfall occurred in Nanjing and the south region with a scale about 100 km, with the rainfall center passing by Nanjing around 14:00 LT, corresponded with the sharp drop of air temperature shown in Fig. 7a. The WRF simulations are consistent with the weather predictions by the local meteorological agency.
25
ACPD
13, 14377–14403, 2013Intense atmospheric pollution modifies
weather
A. Ding et al.
Title Page
Abstract Introduction
Conclusions References
Tables Figures
◭ ◮
◭ ◮
Back Close
Full Screen / Esc
Printer-friendly Version Interactive Discussion
Discussion
P
a
per
|
Dis
cussion
P
a
per
|
Discussion
P
a
per
|
Discussio
n
P
a
per
|
pattern deviated from the observed one, with the latter showing a stronger rainfall in coast region and an isolated precipitation center in the north of Nanjing (see Fig. 7b and Table 2). Previous studies in Amazon suggest that biomass-burning plumes can cause a decrease or an increase of cloudiness depending on the height of plumes (Feingold et al., 2005). Researches also suggest that a suppression of low-level aerosol rain-5
out/washout may cause intense thunderstorms and large hail (Andreae et al., 2004; Rosenfeld et al., 2008). In this case, the pollution seems to have both features de-pending on the time of the day and location. The increased daytime PBL stability and the reduced convection might be the main causes for burning off of the mesoscale convection system in the afternoon.
10
4 Summary and implications
Here we have shown how significantly the intense air pollution modifies the local syn-optic weather by influencing solar radiation, sensible heat flux, air temperature and precipitation. This leads a crucial failure of daily weather forecast under a condition of mixed agriculture burning plumes and FF combustion pollutants. The above find-15
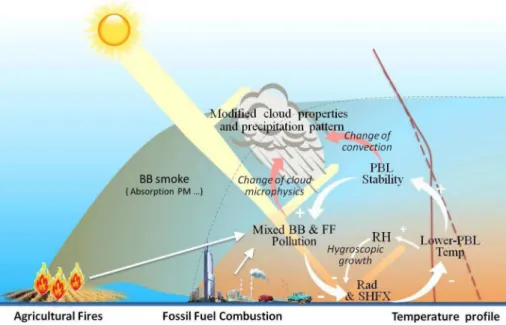
ings from this case are suggestive of strong positive feedback mechanisms between a heavy aerosol loading, radiative transfer, air temperature profile/stability and precip-itation. We summarize the main processes and their interactions in a schematic fig-ure (Fig. 8). Here the enhanced PBL stability initiated by the pollution suppresses the vertical mixing and dispersion of the pollutants, resulting in more intense pollution in 20
the lower PBL. The cooling of the PBL and resulting increase in the relative humidity amplify the feedback further by increasing the aerosol scattering coefficient through hydroscopic effects (Malm and Day, 2001; Liu et al., 2011). The changed PBL stability and the mixed aerosols further modify cloud properties and the precipitation patterns. These feedbacks between air pollution-boundary layer dynamics and aerosol-radiation-25
ACPD
13, 14377–14403, 2013Intense atmospheric pollution modifies
weather
A. Ding et al.
Title Page
Abstract Introduction
Conclusions References
Tables Figures
◭ ◮
◭ ◮
Back Close
Full Screen / Esc
Printer-friendly Version Interactive Discussion
Discussion
P
a
per
|
Dis
cussion
P
a
per
|
Discussion
P
a
per
|
Discussio
n
P
a
per
Firstly, from the weather forecast point of view, this case clearly demonstrates that heavy and complex air pollution could modify weather in a substantial way in China. Although on-line coupled models have recently been developed and improved, and may have capability to address some of these interactions and feedbacks (Grell et al., 2005, 2011), their performance is not sufficiently evaluated in heavily polluted areas 5
like in the East Asia. The real-time changed emissions like manmade agriculture fires also challenge the capability of numerical weather forecast.
Secondly, for the aspect of air pollution control measures, the mechanisms shown in Fig. 8 suggests that change of PBL stability by a unwind regional plumes may further enhance the accumulation of local anthropogenic pollutants in lower PBL and cause 10
extreme air pollution around the surface. Currently, complains were often heard that off -line air quality forecast models sometimes significantly underestimated the extremely high pollution concentrations in megacities in the eastern and northern China. The main reasons could be because that the interactions of PBL-air pollution plays impor-tant roles but were not included in the offline forecast models. However, for the North 15
and East China a fully coupled meteorology-air quality model should be needed be-cause this region is facing frequent heavy aerosol pollution and also with a complex multi-scale distribution of pollutant emission (i.e. from single city, city clusters to re-gional scales, mixed BB/FF sources).
Finally, though this study is an extreme case observed until recently with advanced 20
measurement techniques, a statistics of 11 yr (2002–2012) MODIS active fire data sug-gests that there was a well-defined BB band located from the central to eastern China, which overlapped with high rate of FF combustion emission (Fig. 9). The seasonal vari-ation of the fires suggests that June (mainly in the first two weeks of June), the fires data have a portion up to 70 % of the entire year in average. Because the early and 25
ACPD
13, 14377–14403, 2013Intense atmospheric pollution modifies
weather
A. Ding et al.
Title Page
Abstract Introduction
Conclusions References
Tables Figures
◭ ◮
◭ ◮
Back Close
Full Screen / Esc
Printer-friendly Version Interactive Discussion
Discussion
P
a
per
|
Dis
cussion
P
a
per
|
Discussion
P
a
per
|
Discussio
n
P
a
per
|
This study further highlights the significant role of comprehensive measurements based on “flagship” station suggested by Hari et al. (2009), and also suggests a way forward of cross-disciplinary efforts, including meteorology and atmospheric chemistry and physics utilizing both observations and modeling, in improving the understanding of the earth system processes and their interactions in this region monsoon region with 5
intensive human activities.
Acknowledgements. This work was funded by the MOST 973 Program (2010CB428500 and
2010CB950700) and National Natural Science Foundation of China (D0510/41275129). The SORPES-NJU stations were supported by the 985 program and the Fundamental Research Funds for Central Universities from Ministry of Education China. Part of the activities were also
10
supported by the Academy of Finland projects (1118615, 139656) and the European Com-mission via ERC Advanced Grant ATM-NUCLE. We appreciate iLEAPS SSC for brainstorm-ing discussions on the Interdisciplinary Biomass Burnbrainstorm-ing Initiative (IBBI). We acknowledge P. Hari from University of Helsinki (UH) for his advice in the development of SORPES-NJU, and Pasi Aalto of UH for technical support of the DMPS instrument and data analysis. We
15
thank W. X. Wang’s team at Shandong University for their support on the field study. We also thank Metrohm Co. China for providing the MARGA analyzer and Z. Yan and J. Gao for their technical support for the instrument.
References
Aalto, P., H ¨ameri, K., Becker, E., Weber, R., Salm, J., M ¨akel ¨a, J. M., Hoell, C., O’dowd, C. D.,
20
Hansson, H.-C., V ¨akev ¨a, M., Koponen, I. K., Buzorius, G., and Kulmala, M.: Physical char-acterization of aerosol particles during nucleation events, Tellus B, 53, 344–358, 2001. Andreae, M. O., Rosenfeld, D., Artaxo, P., Costa, A. A., Franck, G. P., Longo, K. M., and
Silva-Dias, M. A. F.: Smoking rain clouds over the Amazon, Science, 303, 1338–1342, doi:10.1126/science.1092779, 2004.
25
ACPD
13, 14377–14403, 2013Intense atmospheric pollution modifies
weather
A. Ding et al.
Title Page
Abstract Introduction
Conclusions References
Tables Figures
◭ ◮
◭ ◮
Back Close
Full Screen / Esc
Printer-friendly Version Interactive Discussion
Discussion
P
a
per
|
Dis
cussion
P
a
per
|
Discussion
P
a
per
|
Discussio
n
P
a
per
Carmona, I., Kaufman, Y. J., and Alpert, P: Using numerical weather prediction errors to esti-mate aerosol heating, Tellus, 608, 729–741, 2008.
Chan, C. K. and Yao, X. H.: Air pollution in Mega cities in China – a review, Atmos. Environ., 42, 1–42, 2008.
Ding, A. J., Wang, T., Thouret, V., Cammas, J.-P., and N ´ed ´elec, P.: Tropospheric ozone
clima-5
tology over Beijing: analysis of aircraft data from the MOZAIC program, Atmos. Chem. Phys., 8, 1–13, doi:10.5194/acp-8-1-2008, 2008.
Ding, A. J., Wang, T., Xue, L. K., Gao, J., Stohl, A., Lei, H. C., Jin, D. Z., Ren, Y., Wang, Z. F., Wei, X. L., Qi, Y. B., Liu, J., and Zhang, X. Q.: Transport of north China midlatitude cyclones: case study of aircraft measurements in summer 2007, J. Geophys. Res., 114, D08304,
10
doi:10.1029/2008JD011023, 2009.
Ding, A. J., Fu, C. B., Yang, X. Q., Sun, J. N., Zheng, L. F., Xie, Y. N., Herrmann, E., Pet ¨aj ¨a, T., Kerminen, V.-M., and Kulmala, M.: Ozone and fine particle in the western Yangtze River Delta: an overview of 1-yr data at the SORPES station, Atmos. Chem. Phys. Discuss., 13, 2835–2876, doi:10.5194/acpd-13-2835-2013, 2013.
15
Fan, J. W., Leung, L. R., Li, Z. Q., Morrison, H., Chen, H. B., Zhou, Y. Q., Qian, Y., and Wang, Y.: Aerosol impacts on cloud and preciptation in eastern China: results from bin and bulk micro-physics, J. Geophys. Res., 117, D00K36, doi:10.1029/2011JD016537, 2012.
Feingold, G., Jiang, H. L., and Harrington, J. Y.: On smoke suppression of clouds in Amazonia, Geophys. Res. Lett., 32, L02804, doi:10.1029/2004GL021369, 2005.
20
Fu, C. B.: A possible relationship between pulsation of plum rains in Chang-Jiang valley and snow and ice cover on Antarctica and the Southern Ocean, Chinese Sci. Bull., 27, 71–71, 1982.
Giglio, L., Csiszar, I., and Justice, C. O.: Global distribution and seasonality of active fires as observed with the Terra and Aqua MODIS sensors, J. Geophys. Res., 111, G02016,
25
doi:10.1029/2005JG000142, 2006.
Gong, D. Y., Ho, C. H., Chen, D. L., Qian, Y., Choi, Y. S., and Kim, J. W.: Weekly cycle of aerosol-meteorology interaction over China, J. Geophys. Res., 112, D22202, doi:10.1029/2007JD008888, 2007.
Grell, G., Peckham, S. E., Schmitz, R., McKeen, S. A., Frost, G., Skamarock, W. C., and
30
ACPD
13, 14377–14403, 2013Intense atmospheric pollution modifies
weather
A. Ding et al.
Title Page
Abstract Introduction
Conclusions References
Tables Figures
◭ ◮
◭ ◮
Back Close
Full Screen / Esc
Printer-friendly Version Interactive Discussion
Discussion
P
a
per
|
Dis
cussion
P
a
per
|
Discussion
P
a
per
|
Discussio
n
P
a
per
|
Grell, G., Freitas, S. R., Stuefer, M., and Fast, J.: Inclusion of biomass burning in WRF-Chem: impact of wildfires on weather forecasts, Atmos. Chem. Phys., 11, 5289–5303, doi:10.5194/acp-11-5289-2011, 2011.
Hari, P., Andreae, M. O., Kabat, P., and Kulmala, M: A comprehensive network of measuring stations to monitor climate change, Boreal. Eviron. Res., 14, 442–446, 2009.
5
He, K. B., Huo, H., and Zhang, Q.: Urban air pollution in China: current
sta-tus, characterizes and progress, Annu. Rev. Energ. Env., 27, 397–431,
doi:10.1146/annurev.energy.27.122001.083421, 2002.
Hegarty, J., Mao, H., Talbot, R.: Synoptic controls on summertime surface ozone in the north-eastern United States, J. Geophys. Res., 112, D14306, doi:10.1029/2006JD008170, 2007.
10
Herrmann, E., Ding, A. J., Pet ¨aj ¨a, T., Yang, X. Q., Sun, J. N., Qi, X. M., Manninen, H., Hakala, J., Nieminen, T., Aalto, P. P., Kerminen, V.-M., Kulmala, M., and Fu, C. B.: New particle formation in the western Yangtze River Delta: first data from SORPES-station, Atmos. Chem. Phys. Discuss., 13, 1455–1488, doi:10.5194/acpd-13-1455-2013, 2013.
Jacobson, M. Z.: GATOR-GCMM: a global-through urban-scale air pollution and weather
fore-15
cast model 1. Model design and treetment of subgrid soil, vegetation, roads, rooftops, water, sea ice and snow, J. Geophys. Res., 106, 5385–5401, 2001a.
Jacobson, M. Z.: Strong radiative heating due to the mixing state of black carbon in atmospheric aerosols, Nature, 409, 695–697, 2001b.
Kulmala, M., Maso, M. D., Makela, J. M., Pirjola, L., Vakeva, M., Aalto, P., Miikkulainen, P.,
20
Hameri, K., and O’dowd, C. D.: On the formation, growth and composition of nucleation mode particles, Tellus B, 53, 479–490, 2001.
Li, J., Posfai, M., Hobbs, P. V., and Buseck, P. R.: Individual aerosol particles from biomass burning in southern Africa: 2. Composition and aging of inorganic particles, J. Geophys. Res., 108, 8484, doi:10.1029/2002JD002310, 2003.
25
Li, Z., Niu, F., Fan, J. W., Liu, Y. G., Rosenfeld, D., and Ding, Y. N.: Long-term impacts of aerosols on the vertical development of clouds and precipitation, Nat. Geosci., 4, 888–894, 2011.
Liu, G., Sun, J. N., and Jiang, W. M. Observational verification of urban surface roughness parameters derived from morphological models, Meteorol. Appl., 16, 205–213, 2009.
30
ACPD
13, 14377–14403, 2013Intense atmospheric pollution modifies
weather
A. Ding et al.
Title Page
Abstract Introduction
Conclusions References
Tables Figures
◭ ◮
◭ ◮
Back Close
Full Screen / Esc
Printer-friendly Version Interactive Discussion
Discussion
P
a
per
|
Dis
cussion
P
a
per
|
Discussion
P
a
per
|
Discussio
n
P
a
per
of aerosol particles at high relative humidity and their diurnal variations in the North China Plain, Atmos. Chem. Phys., 11, 3479–3494, doi:10.5194/acp-11-3479-2011, 2011.
Malm, W. C. and Day, D. E.: Estimates of aerosol species scattering characteristics as a function of relative humidity, Atmos. Environ., 35, 2845–2860, 2001.
Otte, T. L., Pouliot, G., Pleim, J. E., Young, J. O., Schere, K. L., Wong, D. C., Lee, P. C. S.,
5
Tsidulko, M., McQueen, J. T., Davidson, P., Mathur, R., Chung, H. Y., DiMego, G., and Sea-man, N. L.: Linking the Eta Model with the Community Multiscale Air Quality (CMAQ) model-ing system to build a national air quality forecastmodel-ing system, Weather Forecast., 20, 367–384, 2005.
Qian, Y., Gong, D. Y., Fan, J. W., Leung, L. R., Bennartz, R., Chen, D. L., and Wang, W. G.:
10
Heavy pollution suppresses light rain in China: observations and modeling, J. Geophys. Res., 114, D00K02, doi:10.1029/2008JD011575, 2009.
Ramanathan, V., Li, F., Ramana, M. V., Praveen, P. S., Kim, D., Corrigan, C. E., Nguyen, H., Stone, E. A., Schauer, J. J., Carmichael, G. R., Adhikary, B., and Yoon, S. C.: Atmospheric brown clouds: hemispherical and regional variations in long-range transport, abosption, and
15
radiative forcing, J. Geophys. Res., 112, D22S21, doi:10.1029/2006JD008124, 2007. Richter, A., Burrows, J. P., Nub, H., Granier, C., and Niemeier, C.: Increase in
tro-pospheric nitrogen dioxide over China observed from space, Nature, 437, 129–132, doi:10.1038/nature04092, 2005.
Robock, A.: Surface cooling due to forest fire smoke, J. Geophys. Res., 96, 20869–20878,
20
1991.
Rosenfeld, D., Lohmann, U., Raga, G. B., O’Dowd, C. D., Kulmala, M., Fuzzi, S., Reissell, A., and Andreae, M. O.: Flood or drought: how do aerosols affect precipitation? Science, 321, 1309–1313, 2008.
Skamarock, W. C., Klemp, J. B., Dudhia, J., Gill, D. O., Barker, D. M., Wang, W., and Powers,
25
J. G.: A Description of the Advanced Research WRF Version 2, Natl. Cent. for Atmos. Res., Boulder, CO, USA, 2005.
Tie, X. X. and Cao, J. J.: Aerosol pollution in China: present and future impact on environment, Particuology, 7, 426–431, 2009.
Wang, M. H., Ghan, S., Liu, X. H., L’Ecuyer, T. S., Zhang, K., Morrison, H., Ovchinnikov, M.,
30
ACPD
13, 14377–14403, 2013Intense atmospheric pollution modifies
weather
A. Ding et al.
Title Page
Abstract Introduction
Conclusions References
Tables Figures
◭ ◮
◭ ◮
Back Close
Full Screen / Esc
Printer-friendly Version Interactive Discussion
Discussion
P
a
per
|
Dis
cussion
P
a
per
|
Discussion
P
a
per
|
Discussio
n
P
a
per
|
Wang, T., Wong, C. H., Cheung, T. F., Blake, D. R., Arimoto, R., Baumann, K., Tang, J., Ding, G. A., Yu, X. M., Li, Y. S., Streets, D. G., and Simpson, I. J.: Relationships of trace gases and aerosols and the emission characteristics at Lin’an, a rural site in eastern China, during spring 2001, J. Geophys. Res., 109, D19S05, doi:10.1029/2003JD004119, 2004. Wexler, H.: The great smoke pall – September 24–30, 1950, Weatherwise, 3, 129–142, 1950.
5
Xu, X., Lin, W., Wang, T., Yan, P., Tang, J., Meng, Z., and Wang, Y.: Long-term trend of surface ozone at a regional background station in eastern China 1991–2006: enhanced variability, Atmos. Chem. Phys., 8, 2595–2607, doi:10.5194/acp-8-2595-2008, 2008.
Yuan, B., Liu, Y., Shao, M., Lu, S. H., and Streets, D.: Biomass burning contributions to ambient VOCs species at a receptor site in the Pearl River Delta (PRD), China, Environ. Sci. Technol.,
10
44, 4577–4582, 2010.
Zhou, Y., Wang, T., Gao, X. M., Xue, L. K., Wang, X. F., Wang, Z., Gao, J., Zhang, Q. Z., and Wang, W. X.: Continuous observations of water soluble ions in PM2.5 at Mount Tai (1534 m a.s.l.) in central-eastern China, J. Atmos. Chem., 64, 107–127, 2009.
Zhang, H., Hu, D., Chen, J., Ye, X. N., Wang, S. X., Hao, J. M., Wang, L., Zhang, R. Y., and
15
An, Z. S.: Particle size distribution and polycyclic aromatic hydrocarbons emissions from agriculture crop residue burning, Environ. Sci. Technol., 45, 5477–5482, 2011.
Zhang, M., Chen, J. M., Chen, X. Y., Cheng, T. T., Zhang, Y. L., Zhang, H. F., Ding, A. J., Wang, M., and Mellouki, A.: Urban aerosol characteristics during the World Expo 2010 in Shanghai, Aerosol Air Qual. Res., 13, 36–48, doi:10.4209/aaqr.2012.02.0024, 2013.
20
Zhang, Q., Streets, D. G., Carmichael, G. R., He, K. B., Huo, H., Kannari, A., Klimont, Z., Park, I. S., Reddy, S., Fu, J. S., Chen, D., Duan, L., Lei, Y., Wang, L. T., and Yao, Z. L.: Asian emissions in 2006 for the NASA INTEX-B mission, Atmos. Chem. Phys., 9, 5131–5153, doi:10.5194/acp-9-5131-2009, 2009.
Zhang, R. J., Xu, Y. F., and Han, Z. W.: Inorganic chemical composition and source signature
25
of PM2.5in Beijing during ACE-Asia period, Chinese Sci. Bull., 48, 1002–1005, 2003. Zhang, R. Y., Li, G. H., Fan, J. W., Wu, D. L., and Molina, M. J. Intensification of Pacific storm
track linked to Asian pollution, P.Natl. Acad. Sci. USA, 104, 5295–5299, 2007.
Zhang, Y., Mao, H. T., Ding, A. J., Zhou, D. R., and Fu, C. B.: Impact of synoptic weather patterns on spatio-temporal variation in surface O3levels in Hong Kong during 1999–2011,
30
ACPD
13, 14377–14403, 2013Intense atmospheric pollution modifies
weather
A. Ding et al.
Title Page
Abstract Introduction
Conclusions References
Tables Figures
◭ ◮
◭ ◮
Back Close
Full Screen / Esc
Printer-friendly Version Interactive Discussion
Discussion
P
a
per
|
Dis
cussion
P
a
per
|
Discussion
P
a
per
|
Discussio
n
P
a
per
Table 1.Solar radiation, sensible heat flux and PM2.5mass for episode and non-episode days.
Items Episode day (10 June) Pre- and post- episode days
Maximum solar radiation 128.5 W m−2(12:00 LT) Average: 580.9 W m−2
618.3 W m−2
(11:30 LT 9 June) 578.9 W m−2(12:00 LT 11 June)
Maximum sensible heat flux 21.6 W m−2
(12:00 LT) Average: 172.4 W m−2
177.0 W m−2(12:00 LT 9 June)
167.8 W m−2
(13:00 LT 11 June)
PM2.5mass 261 µg m−3(12:00 LT) Average: 85 µg m−3
104 µg m−3(11:30 LT 9 June)
66 µg m−3
ACPD
13, 14377–14403, 2013Intense atmospheric pollution modifies
weather
A. Ding et al.
Title Page
Abstract Introduction
Conclusions References
Tables Figures
◭ ◮
◭ ◮
Back Close
Full Screen / Esc
Printer-friendly Version Interactive Discussion
Discussion
P
a
per
|
Dis
cussion
P
a
per
|
Discussion
P
a
per
|
Discussio
n
P
a
per
|
Table 2.Observed and WRF simulated rainfall at Points AA′, BB′and CC′ in Fig. 7.
Items WRF simulated
rainfall (mm)
Observed rainfall (mm)
Point AA′
(12:00–17:00 LT, June)
12.0 0.0
Point BB′
(00:00–05:00 LT, 11 June)
0.0 13.5
Point CC′
(00:00–05:00 LT, 11 June)
ACPD
13, 14377–14403, 2013Intense atmospheric pollution modifies
weather
A. Ding et al.
Title Page
Abstract Introduction
Conclusions References
Tables Figures
◭ ◮
◭ ◮
Back Close
Full Screen / Esc
Printer-friendly Version Interactive Discussion
Discussion
P
a
per
|
Dis
cussion
P
a
per
|
Discussion
P
a
per
|
Discussio
n
P
a
per
Fig. 1.A TERRA satellite true color image of East China on 10 June 2012. Note: the satellite
ACPD
13, 14377–14403, 2013Intense atmospheric pollution modifies
weather
A. Ding et al.
Title Page
Abstract Introduction
Conclusions References
Tables Figures
◭ ◮
◭ ◮
Back Close
Full Screen / Esc
Printer-friendly Version Interactive Discussion
Discussion
P
a
per
|
Dis
cussion
P
a
per
|
Discussion
P
a
per
|
Discussio
n
P
a
per
|
Fig. 2.A map showing emission inventory of carbon monoxide and fire events on 9 June 2012 in
ACPD
13, 14377–14403, 2013Intense atmospheric pollution modifies
weather
A. Ding et al.
Title Page
Abstract Introduction
Conclusions References
Tables Figures
◭ ◮
◭ ◮
Back Close
Full Screen / Esc
Printer-friendly Version Interactive Discussion
Discussion
P
a
per
|
Dis
cussion
P
a
per
|
Discussion
P
a
per
|
Discussio
n
P
a
per
μg m
Fig. 3. (a) Solar radiation, sensible heat flux and relative humidity recorded at a urban flux
ACPD
13, 14377–14403, 2013Intense atmospheric pollution modifies
weather
A. Ding et al.
Title Page
Abstract Introduction
Conclusions References
Tables Figures
◭ ◮
◭ ◮
Back Close
Full Screen / Esc
Printer-friendly Version Interactive Discussion
Discussion
P
a
per
|
Dis
cussion
P
a
per
|
Discussion
P
a
per
|
Discussio
n
P
a
per
|
Fig. 4. (a)Aerosol size distribution measured with a Differential Mobility Particle Sizer (DMPS),
ACPD
13, 14377–14403, 2013Intense atmospheric pollution modifies
weather
A. Ding et al.
Title Page
Abstract Introduction
Conclusions References
Tables Figures
◭ ◮
◭ ◮
Back Close
Full Screen / Esc
Printer-friendly Version Interactive Discussion
Discussion
P
a
per
|
Dis
cussion
P
a
per
|
Discussion
P
a
per
|
Discussio
n
P
a
per
Fig. 5.Scattering plots of(a)KCl,(b)sulfate and(c)CO vs. PM2.5mass concentration
ACPD
13, 14377–14403, 2013Intense atmospheric pollution modifies
weather
A. Ding et al.
Title Page
Abstract Introduction
Conclusions References
Tables Figures
◭ ◮
◭ ◮
Back Close
Full Screen / Esc
Printer-friendly Version Interactive Discussion
Discussion
P
a
per
|
Dis
cussion
P
a
per
|
Discussion
P
a
per
|
Discussio
n
P
a
per
|
Fig. 6.A comparison of (a)2 m air temperature from the WRF simulation, FNL and from the
ACPD
13, 14377–14403, 2013Intense atmospheric pollution modifies
weather
A. Ding et al.
Title Page
Abstract Introduction
Conclusions References
Tables Figures
◭ ◮
◭ ◮
Back Close
Full Screen / Esc
Printer-friendly Version Interactive Discussion
Discussion
P
a
per
|
Dis
cussion
P
a
per
|
Discussion
P
a
per
|
Discussio
n
P
a
per
Fig. 7. A comparison of observed and WRF simulated amounts of precipitation. (a and b)
ACPD
13, 14377–14403, 2013Intense atmospheric pollution modifies
weather
A. Ding et al.
Title Page
Abstract Introduction
Conclusions References
Tables Figures
◭ ◮
◭ ◮
Back Close
Full Screen / Esc
Printer-friendly Version Interactive Discussion
Discussion
P
a
per
|
Dis
cussion
P
a
per
|
Discussion
P
a
per
|
Discussio
n
P
a
per
|
Fig. 8.A schematic figure for interactions of air pollution-PBL dynamics and
aerosol-radiation-cloud under a condition of mixed agriculture burning plumes and fossil fuel combustion pollu-tants. Note: yellow bands show the radiative transfer of solar radiation. The brown solid and dashed lines mean the air temperature profiles for episode and non-episode cases, respec-tively. The black thin dashed line represent the top of fossil fuel combustion plume under a non-episode condition. The plus (+) and minus (−) signs mean enhancement and reduction of
ACPD
13, 14377–14403, 2013Intense atmospheric pollution modifies
weather
A. Ding et al.
Title Page
Abstract Introduction
Conclusions References
Tables Figures
◭ ◮
◭ ◮
Back Close
Full Screen / Esc
Printer-friendly Version Interactive Discussion
Discussion
P
a
per
|
Dis
cussion
P
a
per
|
Discussion
P
a
per
|
Discussio
n
P
a
per
Fig. 9. A map show anthropogenic emission inventory of CO (Zhang et al., 2009) and averaged