www.atmos-chem-phys.net/9/9315/2009/ © Author(s) 2009. This work is distributed under the Creative Commons Attribution 3.0 License.
Chemistry
and Physics
Wildfire smoke in the Siberian Arctic in summer: source
characterization and plume evolution from airborne measurements
J.-D. Paris1, A. Stohl2, P. N´ed´elec3, M. Yu. Arshinov4, M. V. Panchenko4, V. P. Shmargunov4, K. S. Law5, B. D. Belan4, and P. Ciais1
1Laboratoire des Sciences du Climat et de l’Environnement/IPSL, CNRS-CEA-UVSQ, Orme des Merisiers,
CEA Saclay, Gif sur Yvette, France
2Norwegian Institute for Air Research, Kjeller, Norway 3Laboratoire d’A´erologie, CNRS-UPS, Toulouse, France 4Institute of Atmospheric Optics, SB-RAS, Tomsk, Russia
5UPMC Univ. Paris 06, Univ. Versailles St-Quentin, CNRS/INSU, LATMOS-IPSL, Paris, France
Received: 27 July 2009 – Published in Atmos. Chem. Phys. Discuss.: 2 September 2009 Revised: 24 November 2009 – Accepted: 1 December 2009 – Published: 11 December 2009
Abstract. We present airborne measurements of carbon dioxide (CO2), carbon monoxide (CO), ozone (O3),
equiv-alent black carbon (EBC) and ultra fine particles over North-Eastern Siberia in July 2008 performed during the YAK-AEROSIB/POLARCAT experiment. During a “golden day” (11 July 2008) a number of biomass burning plumes were encountered with CO mixing ratio enhancements of up to 500 ppb relative to a background of 90 ppb. Number con-centrations of aerosols in the size range 3.5–200 nm peaked at 4000 cm−3 and the EBC content reached 1.4 µg m−3.
These high concentrations were caused by forest fires in the vicinity of the landing airport in Yakutsk where measure-ments in fresh smoke could be made during the descent. We estimate a combustion efficiency of 90±3% based on CO and CO2 measurements and a CO emission factor of
65.5±10.8 g CO per kilogram of dry matter burned. This suggests a potential increase in the average northern hemi-spheric CO mixing ratio of 3.0–7.2 ppb per million hectares of Siberian forest burned. For BC, we estimate an emis-sion factor of 0.52±0.07 g BC kg−1, comparable to values
reported in the literature. The emission ratio of ultra-fine particles (3.5–200 nm) was 26 cm−3(ppb CO)−1, consistent
with other airborne studies.
The transport of identified biomass burning plumes was in-vestigated using the FLEXPART Lagrangian model. Based on sampling of wildfire plumes from the same source but with different atmospheric ages derived from FLEXPART,
Correspondence to:J.-D. Paris ([email protected])
we estimate that the e-folding lifetimes of EBC and ultra fine particles (between 3.5 and 200 nm in size) against removal and growth processes are 5.1 and 5.5 days respectively, sup-porting lifetime estimates used in various modelling studies.
1 Introduction
BC is a light-absorbing fraction of the total aerosol emit-ted by forest fires. It represents a highly variable fraction (8%±6%) of the total aerosol mass (Reid et al., 2005), with the bulk (between half and two thirds) consisting of organic carbon. BC from boreal forest fires has a signifi-cant radiative impact on the Arctic atmosphere through mid-troposphere warming and deposition on snow (Quinn et al., 2008; Flanner et al., 2007), especially in spring. Little is known about emission, transport and deposition of BC from Siberian forest fires to the Arctic. Based on transport model calculations, Stohl (2006) argued that boreal forest fires, especially Siberian fires, are the largest source of BC to the Arctic in summer, exceeding all contributions from anthropogenic sources. In a measurement-based modelling study, Generoso et al. (2007) found that the 2003 Russian fires emitted 0.5 TgC as BC, and contributed about 40–56% of the total BC mass deposited north of 75◦N. However,
Koch and Hansen (2005) find this contribution generally sec-ondary compared to South Asian anthropogenic and tropical biomass burning sources, due to efficient transport in their model.
The impact of Siberian wildfires on the atmospheric com-position is very difficult to determine for a number of rea-sons. Characterization of fire plumes over Siberia is largely lacking (see e.g. N´ed´elec et al., 2005). Areas burned, biomass fraction consumed, combustion efficiency, height of plume injection into the atmosphere and emission ratios are all highly uncertain for Siberia. Ground-truth data from Siberia is largely lacking. A few prescribed fires provided in-sight into Siberian forest fire processes and values for emis-sion ratio of various species (FIRESCAN Science Team, 1996; Cofer et al., 1996, 1998; McRae et al., 2006). An-nual areas burned are known to have been underestimated by earlier official data (Conard et al., 2002). Van der Werf et al. (2006) used burned area information from MODIS, but (1) the resolution of MODIS is coarse for this application, and (2) validation with high resolution Landsat data show for Africa an underestimation of burned area by 40% for 60% of land cover (Lehsten et al., 2009). Further, these detections do not fully capture the spatio-temporal variability of fires because of infrequent satellite overpasses or clouds. Further-more, chemistry-transport models are very sensitive to the injection height of fire emissions (e.g. Turquety et al., 2007), which depends both on synoptic conditions and type of fire.
Although sparse, aircraft observations can provide valu-able constraints on the emission factors (e.g. Ward et al., 1991), injection heights and subsequent transport (e.g. An-dreae et al., 1998). Here we investigate the outflow from major fires burning in Siberia in July 2008. Our instrumented aircraft crossed several plumes originating from the same fire region. These observations provide insight in the injection of the forest fire plume, its transport toward the Arctic, its evo-lution and removal processes.
2 Methods
2.1 Field sampling
YAK-AEROSIB (Airborne Extensive Regional Observations in Siberia) performs a series of airborne measurement cam-paigns over Siberia. Two camcam-paigns were carried out be-tween 7 and 29 July 2008 in a collaborative effort with the POLARCAT (Polar Study using Aircraft, Remote Sensing, Surface Measurements and Models, of Climate, Chemistry, Aerosols, and Transport) programme, following three previ-ous campaigns in 2006 and 2007 (Paris et al., 2008, 2009b). The campaign consisted of two large loops in North and Cen-tral Siberia (Fig. 1a), intended to document the distribution of CO2, CO and O3as well as aerosols in the Siberian
tro-posphere. As a contribution to the POLARCAT programme, the flight route (which had to be fixed prior to the campaign) was chosen to sample as many different air masses as pos-sible with a flight pattern consisting of frequent ascents and descents between close to the ground and 7 km altitude. Here we focus on data obtained during flight 17 on 11 July 2008, a south-bound leg starting from the Siberian Arctic coast. The aircraft departed from Chokurdakh (70◦N, 147◦E) and
landed in Yakutsk (62◦N, 130◦E) (Fig. 1b). Fires were
burn-ing near Yakutsk (Fig. 1b), and several plumes from these fires were encountered during the flight.
2.2 Instruments
1 3
1 4 1 5 1 6
1 7
1 8,21 1 9,20
2 2
2 3,24 2 5
45°N
60°N 75°N
90°N
Yakutsk
Yakutsk
Chokurdakh Yakutsk
(a)
(b)
Fig. 1. (a)Flight route for the July 2008 campaigns. In blue: northern Siberia loop; in black: central Siberia loop. Flight 17 on 11 July is highlighted in red.(b)Itinerary of flight 17 from Chokurdakh (North) to Yakutsk. Area burnt by forest fires (Sukhinin et al., 2004) during the period 1–7 July is indicated in red, between 7–14 July in blue. Along the aircraft trajectory, individual plumes with CO>120 ppb are marked by black dots, and CO>150 ppb by red dots.
MBC=
Sf·ln(I1/I2) k·V·t ·10
5 (1)
whereSfis the filter area (cm2),I1andI2the signal before
and after pumping,kthe mass coefficient (28 cm2µg−1)
ob-tained during calibration,V the flow rate (l/min), and t the time of pumping (min). The sensitivity of the aethalometer is∼0.01 µg m−3EBC.
CO and O3mixing ratios were measured by modified
com-mercial gas analysers Thermo 48C and Thermo 49 (Thermo Environmental Instruments, USA; see N´ed´elec et al., 2003; Paris et al., 2008). CO2was measured using a modified
Li-Cor 6262 improved with pressure and flow rate control and temperature stability, as well as three calibration gases with mixing ratios bracketing ambient ones (Paris et al., 2008). The instrument precision is∼0.15 ppm.
2.3 Modelling of air mass transport
The origin of air masses and the contribution of biomass burning to CO enhancements was investigated using the FLEXPART Lagrangian model (Stohl et al., 2005; Seibert and Frank, 2004). FLEXPART calculates the trajectories of tracer particles using the mean winds interpolated from meteorological analysis fields plus random motions repre-senting turbulence and convection. Results presented here use ECMWF (European Centre for Medium-Range Weather Forecasts) analysis fields, although GFS (Global Forecast
System of NOAA/NCEP) fields were used, too, as dif-ferences between the two simulations allow estimating the transport error. Both data sets were used at 0.5◦×0.5◦
res-olution and 3-h time resres-olution. The ECMWF data used has 91 vertical levels, whereas for the GFS data only 26 pres-sure levels were available. Both backward and forward sim-ulations were performed. While the forward simsim-ulations served to investigate the extension of fire plumes, the back-ward simulations were used to analyse transport pathways from potential source regions to the aircraft position. Each backward simulation consists of 40 000 particles released whenever the aircraft has moved 0.15◦ in latitude or
lon-gitude, or 10 hPa in altitude. Released particles were fol-lowed 20 days backward in time and an emission sensitiv-ity (ES) was calculated at a resolution of 0.5◦, which can
be folded with available emission fluxes to calculate source contributions (e.g., Stohl et al., 2007). Results are available at http://zardoz.nilu.no/∼andreas/YAK/.
C
O
(p
pb
)
(a)
80 100 120 140
C
O2
(p
pm)
(b)
365 370 375 380 385
O3
(p
pb
)
(c )
20 40 60 80 100
B
C
(µ
g
L
−1)
(d)
0 0.2 0.4
N
(x1
0
3cm −3)
Flight nb
(e)
13 14 15 16 17 18 19 20 21 22 23 24 25 0
1 2 3 4
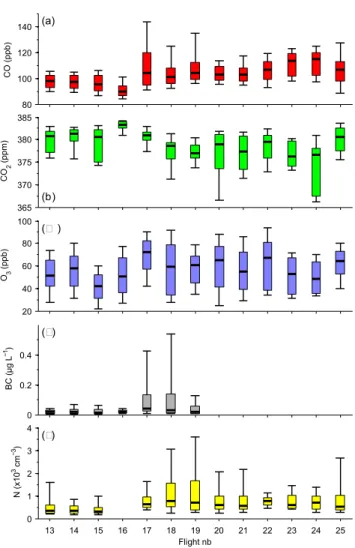
Fig. 2. Statistical summary of all observations for each flight in July 2008. The central bar indicates the median, the box indicates the inter-quartile range, and the error bars extend from the 10th to the 90th percentiles.(a)CO,(b)CO2,(c)O3,(d)EBC,(e)ultrafine (between 3 and 200 nm) particle total number concentrations. BC data are not available for flights 20–25, and particle number con-centrations are not available for flight 16.
persistence over the fire locations. Unfortunately, this also smoothes the source strength over both days and leads to somewhat less episodic behaviour than in reality. Forest fire emissions are injected homogeneously between the ground and 3 km altitude, as we found that it provided a significant improvement over simple ground-level injection in the sim-ulation of the smoke plumes. Anthropogenic emissions were taken from the EDGAR 3.2 Fast Track 2000 dataset (Olivier et al., 2001). The “age” of each fire plume identified in this study was calculated by taking the average age of the FLEX-PART fire CO tracer at the time of the maximum observed CO.
For the forward simulations, a CO and a BC tracer were initialized at the exact location of every fire detected in the northern hemisphere, with emissions estimated as described
CO
(ppb)
←Apr 06
←Sep 06 ←Aug 07 Jul 08,
Arctic→
←Jul 08, Central
2006 2007 2008 2009
80 100 120 140 160 180 200
Fig. 3. Comparison of CO median mixing ratios and interquartile range (error bars) for July 2008 and previous YAK-AEROSIB cam-paigns.
above. The simulation covered the period March–July 2008 and particles in this simulation were dropped from the sim-ulation after 20 days. A maximum of 18 million particles were simultaneously present in the simulation. The BC tracer was subject to wet and dry deposition parameterizations in FLEXPART, while the CO tracer was only removed when particles were dropped after 20 days.
3 Results and discussion
Figure 2 shows the frequency distributions of aerosols and trace gases in Siberia during the 2008 campaign flights. A CO background emerges from this distribution, with median mixing ratios generally between 90 and 100 ppb. Compar-ing the CO distribution with that of the three previous mea-surement campaigns (Paris et al., 2008, 2009b), irrespective of altitude, suggests that overall CO mixing ratios observed during this campaign were within the range observed dur-ing previous summer campaigns (Fig. 3). Higher CO mixdur-ing ratios (∼160–180 ppb) were only observed in April 2006, a consequence of the seasonal cycle of CO. The measurements are not biased by sampling strategy because the campaign itinerary needs to be announced to Russian authorities a long time in advance and therefore targeting of particular plumes is impossible. Figure 3 also reveals that northern Siberia CO mixing ratios are consistently lower than those sampled in central Siberia, probably due to the sampling of a different air mass within the polar dome at the northern leg of the flight track.
C
O
(p
pb
)
100
200
) 0 0 4 0 0 5 0 0 = 0 0
2 2 . . CO 7 l e
x
l
e
(
p
−
(
(a)
0 0 t ) 0 0 1 t 0 0 0 1 t ) 0 0 2 t 0 0 0 2 t ) 0 0 ) t 0 0 0 ) t ) 0
0 2 4 = / 1 0
0
(
x
1
0
3R
−
−3(
3
.
C
(
µ
g
L
−1)
0 1 2 3 4 5 3 − 5 . 3
5 . 3 − 2 0 . 5 2 0 . 5 − 2 0 0 BC
CO
C
O
(p
pb
)
(b)
00: 3 0 0 1 : 0 0 0 1 : 3 0 0 2 : 0 0 0 2 : 3 0 0 3 : 0 0 0 3 : 3 0
0 1 0 0 2 0 0 3 0 0 4 0 0 5 0 0 6 0 0
C
O
,
O3
(p
pb
)
0
5 0 1 0 0 1 5 0 2 0 0 2 5 0
3 0 0 CO
O3 CO2
C
O2
(p
p
−
(
(c )
8 4 − e U 8C3 2 l 4 1 h e 1 7 3 1 1 / 0 7 / 2 0 0 /
0 0 t ) 0 0 1 t 0 0 0 1 t ) 0 0 2 t 0 0 0 2 t ) 0 0 ) t 0 0 0 ) t ) 0
) 7 0 ) 7 5 ) / 0 ) / 5 ) 9 0 1
2 3 4
5 6
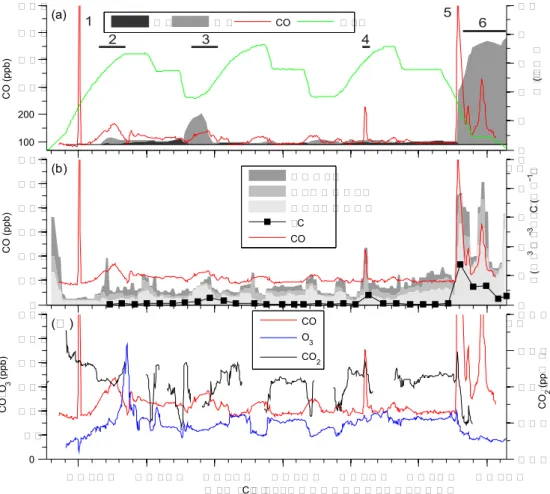
Fig. 4. Tracer time series during flight 17 on 11 July 2008. (a)observed CO (red line) and CO mixing ratios simulated with FLEXPART (shaded area). Simulated CO mixing ratios from biomass burning (BB, light grey) and fossil fuel burning (FF, dark grey) were accounted for during the last 20 days before the flight and an arbitrary background of 90 ppb was added. Aircraft altitude is shown in green. Six events correspond to high CO plume encounters. Events 2, 3, 4 and 6 are highlighted (thick bars) where FLEXPART identifies a dominant BB contribution. (b)Observed ultra-fine particles number concentration (shaded area) and black carbon. CO is plotted again in red. The particles are divided in three size bins: 3–5.3 nm (dark grey), 5.3–20.5 nm (medium grey) and 20.5–200 nm (light grey).(c)Observed mixing ratios of CO2, O3and CO.
ratios vary considerably and are not well correlated with CO. They are suggested to be determined largely by the variabil-ity in exchange processes at the surface. For instance, flights over Northern Siberia and tundra typically revealed verti-cal profiles with weak or absent CO2 gradient toward the
ground, whereas at lower latitudes CO2 decreases strongly
towards the ground (not shown) because of efficient CO2
uptake by trees for photosynthesis (Nakazawa et al., 1997; Paris et al., 2009b). Similarly, O3 spatial variability in the
lower troposphere could be largely driven by deposition pro-cesses, with a possible contribution to variability from the import of stratospheric O3. Paris et al. (2009b) found that
in spring, tropospheric O3over Siberia was negatively
corre-lated (R= −0.53) to the residence time of the air mass close to the ground (<300 m) over the region and positively corre-lated to the model stratospheric tracer (R=0.43). In summer, the negative correlation with local residence time is enhanced
(up toR= −0.76) but the clear correlation with stratospheric contribution is lost.
The more elevated CO levels during flights 17–19 are as-sociated with strongly enhanced EBC and ultrafine particle concentrations, which can be attributed to influence from biomass burning. Of the three flights, flight 17 is clearly the one with the strongest CO and EBC enhancements and, thus, the remainder of this paper analyzes the data obtained during this flight in detail.
3.1 Identification of biomass burning influence
Figure 4 shows the CO, O3and aerosol concentrations
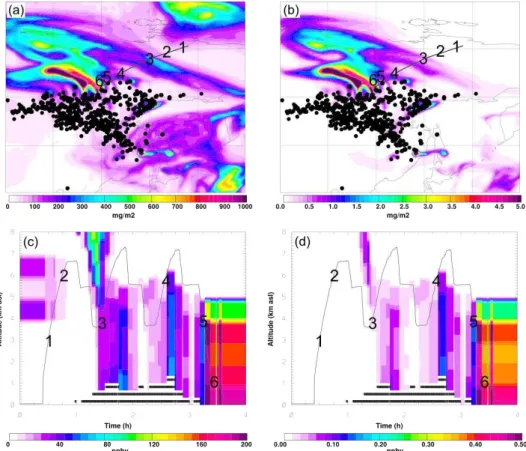
Fig. 5. Results from the FLEXPART forward simulation of biomass burning CO (left) and BC (right) tracers over Northern Siberia on 11 July 2008. Upper panels show total atmospheric columns, lower panel are curtains through the model output along the flight track. The flight track is shown as a black line in all panels; striped areas in the lower panels indicate model topography. Note that while the FLEXPART output is gridded at 1 km vertical resolution (apparent “steps” in lower panels), smaller-scale processes are taken into account in the simulation and are reflected in the model output. Black dots represent active fires detected by MODIS. Approximate position and number of plumes is given in each panel.
from wildfires. The origin of these elevated CO plumes was tested with the FLEXPART Lagrangian model (Fig. 4a). Ac-cording to the model anthropogenic emissions had a negli-gible influence during the entire flight in this remote region, with a predicted median anthropogenic CO contribution (in-tegrated over the last 20 days before the flight) of 0.6 ppb (interquartile range 0.5–2.4 ppb; black shading in Fig. 4a). On the contrary, FLEXPART suggests substantial influence from biomass burning (median 2.4 ppb, interquartile range 0.4–9.5 ppb; grey shading in Fig. 4a). The simulated high CO mixing ratios due to the influence of biomass burning (BB) plumes correctly match some of the observed CO en-hancements (Fig. 4a). The modelled amplitude of CO mixing ratios, however, appears to be often over- or underestimated and a thin smoke layer shortly after take-off in Chokurdakh is missed altogether by the model. Reasons for the model shortcomings in addition to potential transport errors (e.g. not fully resolving the boundary layer height diurnal cycle due to the 3-hourly temporal resolution of the meteorological input data) are (1) the high uncertainty of the emissions associated with each individual fire detection from satellite, (2) the poor
temporal resolution of the MODIS fire detections and miss-ing detections in the presence of clouds, and (3) uncertain injection heights into the atmosphere of the biomass burning emissions.
Using the algorithm used by FLEXPART, we estimate that a total of 27 Mt CO were emitted for fire detections over forested areas in Siberia (defined roughly as the region be-tween 30–180◦E and 40–80◦N), and another 30 Mt CO were
emitted by fires detected over other land use types, between March and October 2008.
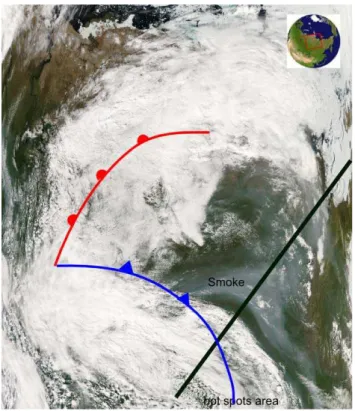
Fig. 6. Aqua/MODIS image over Siberia at 2008/193 (11/07/08) at 04:45 UTC, showing an area coincident with flight 17 (approx-imate flight track is shown in black). Approximative delineation of the fronts present at 12:00 UTC is shown in blue and red. A higher resolution version with hot spots indicated is available at http://rapidfire.sci.gsfc.nasa.gov/realtime/2008193/.
instrument (Pommier et al. 2009), illustrating the dominant fire origin of the CO enhancements. Emissions from fires located near Yakutsk at the time of the campaign were trans-ported to the north on average but significant frontal activ-ity sheared and isolated the BB emissions in several separate plumes. According to the Russian Hydrometcenter weather chart, a strong low at 110◦E, 67◦N was centered to the west
of the flight, provoking vigorous frontal activity and attract-ing the fire plumes close to the source. A cold front was located in the middle of the flight track, which marks corre-spondingly the steep gradient between smoke and clean air in the cold air mass, and an occluded front was located near Yakutsk, where the highest CO and BC concentrations are found (Fig. 5). Consequently, a thick cloud deck was present over large parts of the flight (Fig. 6).
3.2 Characterization of background air composition
Mixing ratios in plumes are mostly reported as excess above background. The CO background was determined to be 90±10 ppb (when excluding CO plumes; Paris et al., 2008). The ultra fine (3–200 nm) particles’ background concentra-tion was taken at 400 cm−3, which is approximately the 20th
percentile of the distributions, and reflects typical
concentra-374 376 378 380 382 384 386
0 1 2 3 4 5 6 7
CO2(ppm)
CO2 CO O3 BC
0 0.5 1 1.5
−1 0 1 2 3 4 5 6 7
BC (µg m−3)
0 100 200 300 400 500 600 700
0 1 2 3 4 5 6 7
CO, O3x2 (ppb)
A
lti
tu
de
(km)
1
2
Fig. 7.Vertical profiles of CO (red line), CO2(black line), O3(blue line) and EBC (black squares) shortly after take off from Chokur-dakh. Position of plumes 1 and 2 is indicated.
tions in CO-poor regions (Fig. 4b). Similarly, the observed EBC background is estimated to be∼2 10−2µg m−3, near
detection limit.
Due to its high temporal (depending on recent ecosystem net primary production) and spatial variability (due to the gradient across the BL entrainment zone), the CO2
back-ground cannot be readily estimated from measurements in surrounding air masses. We interpolated a relevant back-ground value from measurements in clean air (CO<110 ppb) within the boundary layer elsewhere during the campaign, at similar local time and latitude. The resulting CO2
back-ground valid for recent smoke observed at low levels during the flight on 11 July (plumes 5 and 6) is 372.3±2.5 ppm (median±std dev). This value is used for background mix-ing ratio of CO2 measured far from the boundary layer in
Table 1. We observe from the last profile an apparent back-ground of ∼374±1 ppm (Fig. 8). Since this value has less uncertainty associated with it, it is used for measure-ments obtained in the boundary layer during the descent near Yakutsk.
3.3 Characterization of individual plumes
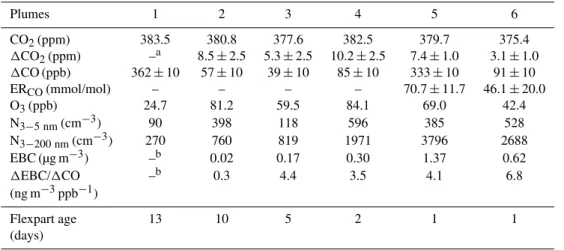
Table 1.Species mixing ratio and enhancements above background, ratio to reference species CO and CO2and FLEXPART age of plumes. 1-σmixing ratios uncertainties due to background estimation are reported.
Plumes 1 2 3 4 5 6
CO2(ppm) 383.5 380.8 377.6 382.5 379.7 375.4
1CO2(ppm) –a 8.5±2.5 5.3±2.5 10.2±2.5 7.4±1.0 3.1±1.0
1CO (ppb) 362±10 57±10 39±10 85±10 333±10 91±10
ERCO(mmol/mol) – – – – 70.7±11.7 46.1±20.0
O3(ppb) 24.7 81.2 59.5 84.1 69.0 42.4
N3−5 nm(cm−3) 90 398 118 596 385 528
N3−200 nm(cm−3) 270 760 819 1971 3796 2688
EBC (µg m−3) –b 0.02 0.17 0.30 1.37 0.62
1EBC/1CO –b 0.3 4.4 3.5 4.1 6.8
(ng m−3ppb−1)
Flexpart age 13 10 5 2 1 1
(days)
aNo background was applicable to Plume 1.
bNo data available.
3 km altitude (Fig. 7). Plume 1 is associated to a well correlated (R2=0.78,p=0.007,n=10) negative (∼ −20 ppb) O3 excursion, resulting in a low mixing ratio of 24.7 ppb.
The O3/CO regression slope is−0.04 ppb O3/ppb CO. This
might indicate that O3 loss processes dominated over
pho-tochemical production (Val Martin et al., 2006; Real et al., 2007), or that mixing with air having low O3 mixing
ra-tio occurred in the boundary layer. O3 losses could occur
through reaction with organic compounds on biomass burn-ing aerosols and concurrently with night-time oxidation of volatile organic compounds but the combination of mecha-nisms is not fully explained yet (Val Martin et al., 2006). No enhancement of particle concentration was observed, prob-ably due to wet scavenging from the plume. CO2
enhance-ment in this plume appears to be very weak relative to sur-rounding air, but is difficult to quantify due to the absence of a well defined background. No EBC observations were available for this plume.
Plume 1 is predicted to have a very low CO excess (1CO=8 ppb) by the FLEXPART backward simulations and its age is 13 days. The observed low number concentration of fine aerosol is consistent with an aged plume. As discussed above, these measurements were likely made at the edge of a major plume predicted in the FLEXPART forward run just to the north of the flight track, over the East Siberian Sea (Fig. 5). The model suggests no BC in this plume but a sig-nificant CO enhancement (30–40 ppb, 1 km thick) near the flight track (much higher mixing ratios further north), con-sistent with the measurements (fine particle number concen-trations near background levels; EBC data missing). The ver-tical curtain plots in Fig. 5 suggest that plumes 1 and 2 are simulated at altitudes matching well the observations, albeit plume 1 is slightly too high by∼1.5 km.
Plume 2 corresponds to an upper-tropospheric CO en-hancement of 57 ppb (Table 1), encountered at 6 km altitude (Fig. 7). It is capped by a layer with a stratospheric signature, identified by increasing O3mixing ratios (up to 220 ppb) and
decreasing relative humidity, at flight ceiling. This strato-spheric signature is further confirmed by the FLEXPART backward simulation, with more than 60% of particles orig-inating from the stratosphere one day or less before mea-surement. In addition to elevated CO the fire plume has a weak BC enhancement of 0.02 µg m−3. The FLEXPART
simulation indicates that the BB-related CO enhancement in this airmass occurred 10 days prior to encounter (Table 1). O3 average mixing ratio in this plume is 81.2 ppb. CO is
negatively correlated both with CO2(R2=0.84;p=<0.001;
n=32, slope=−27.9±2.1) and O3(R2=0.24;p=0.004; slope: −0.79±0.13). An explanation for these anticorrelations is partial mixing of the plume with air of recent stratospheric origin immediately above.
Plume 3 shows no correlation between CO and O3. CO2
data are scarce for this plume because of a concurrent in-flight calibration. This plume was encountered on a in-flight plateau at 3.5 km altitude and was not found above this al-titude on descent to/ascent from this plateau. A slight BC increase was observed for this plume (0.17 µg m−3).
FLEX-PART overestimated the BB CO enhancement in this plume (∼100 ppb) compared to the measurements (39 ppb).
Plume 4 differs significantly from plumes 2 and 3 since CO is positively correlated to CO2 (R2=0.84; p=<0.001;
n=13; slope: 57.8±8.1) and to O3(R2=0.40;p=0.02;n=13;
slope: 7.2±2.0). It has a strong excess of ultrafine particles, with particles in the range 20–200 nm totalling 2000 cm−3.
EBC excess is also significant with 0.3 µg m−3. It constitutes
374 376 378 380 382 384 386 0
1 2 3 4 5 6 7
CO2(ppm)
CO2 CO O3 BC
0 0.5 1 1.5
−1 0 1 2 3 4 5 6 7
BC (µg m−3)
0 100 200 300 400 500 600 700
0 1 2 3 4 5 6 7
CO, O3x2 (ppb)
A
lti
tu
de
(km)
5
6
Fig. 8.Vertical profiles of CO (red line), CO2(black line), O3(blue line) and EBC (black squares) shortly before landing in Yakutsk. Position of plumes 5 and 6 is indicated.
As the aircraft was descending toward Yakutsk, close to the fire source area (Fig. 1), high CO mixing ratios were ob-served below 3 km (Fig. 8, plumes 5 and 6). Plume 5 exhibits a CO mixing ratio up to 600 ppb and caps a couple of other high-CO plumes (varying between 150 and 300 ppb) down to the surface (labelled “6” in Fig. 4a). The layering of plumes 5 and 6 is explained by the presence of two temperature in-version layers at corresponding heights (not shown). FLEX-PART estimates the age of these plumes at less than 1 day. High tracer mixing ratios, strong correlation of CO with par-ticles concentrations, EBC and CO2 observed in plumes 5
and 6, combined with the<1 day of travel time from the fire suggest that these observations can be used to determine the emission ratios of the species observed.
3.4 Emission ratio, emission factor and combustion efficiency
Combustion efficiency (CE) is defined as the ratio between the carbon emitted as CO2to the total amount of carbon
emit-ted to the atmosphere (Ward et al., 1991).
CE= C[CO2]
C[CO2]+C[CO]+C[CH4]+C[NMHC]+C[PC]
(2) A CE higher than 90% is an indicator of a flaming fire, whereas a CE lower than 90% indicates a smoldering fire. This ratio is sensitive essentially to CO and CO2as these two
species represent 95% of C emissions (Ward et al., 1991). In
the case where not all species are measured, a modified com-bustion efficiency can be used where the carbon emitted as CO and CO2approximates the total amount of carbon
emit-ted. Based on the measurements in plumes 5 and 6 we esti-mate a CE of 90±3%, which does not discriminate between flaming and smoldering phases of the fire.
Emission factors were calculated using the carbon mass balance method (Ward et al., 1991). This method is based on the partial oxidation of combustion fuel into CO2and other
incomplete combustion products, including CO, hydrocar-bons and particulate matter. The emission factor (EF) of a species X corresponds to the mass of C emitted per mass of dry matter burned according to Eq. (3).
EFX=
[X]
C[CO2]+C[CO]+C[CH4]+C[NMHC]+C[PC]
(3) where C[X]refers to the amount of C released as species X.
The emission ratios for CO and particles relative to CO2are
given according to Eq. (4), in terms of concentration and mixing ratio:
ERX= [X]
C[CO2]
= 1[X]/MX
1[CO2]/MCO2
(4) where MXis the molecular mass of compound X. Estimates
for the terms of Eqs. (3) and (4) are provided by the mea-surement of the excess concentrations of these compounds in very recent smoke close to the source. Excess concentra-tions are considered relative to a surrounding clean air back-ground. ER can be also taken as the regression slope between high-frequency measurements of the two species throughout the plume. In the following, ERCOis based on linear
regres-sion, while ERBCis based on maximum enhancement ratio
with measurement technique having a lower frequency of ac-quisition. However in the case of CO the two methods were tried and give results within 10% of each other.
The CO emission per kg dry biomass burned (EF) can al-ternatively be derived from the ER. Here we use the follow-ing equation:
EFCO=MCO×
EFCO2
MCO2
×ERCO (5)
Because we do not observe directly EFCO2, we hypothesize
that values from the literature for Siberia can be applied. From prescribed forest fire experiments in Siberia, Cofer et al. (1996) suggest a value of 1475±40 g CO2kg−1, lower
than in a more recent experiment with EFCO2 ∼1650 g kg −1
(McRae et al., 2006). The latter further identified a large range of EFCO2 depending on the fuel type, ranging from
1060 g kg−1 for moss and lichen to 1717 g kg−1 for rotten
wood. Separating crown and smoldering fires, Cofer et al. (1998) report 1500±50 for crown fire and 1100±50 for smoldering emissions. Here we consider a range of EFCO2
values between 1475 and 1650 g kg−1, from the two
Accounting for observational and methodological errors, we obtain an ERCOof 66.5±3.9 mmol mol−1and an EFCO
of 65.5±10.8 g CO kg−1 from a linear regression of CO
vs. CO2 in the plumes 5 and 6. The uncertainty reported
here should be considered with caution since we did not measure EFCO2 directly. Our CO emission factor is at the
lower end of values reported in the literature for boreal forest fires. Observed EFCOvalues range from 68.8 g kg−1(Cofer
et al., 1989) up to 350±45 g kg−1 (Cofer et al., 1998) for
Siberian smoldering taiga fires. However, the vast majority of data on boreal emission factors used as reference were obtained from North American boreal forest fires (Andreae and Merlet, 2001). Andreae and Merlet (2001) reported an average of 107±37 g kg−1for extratropical forest fires (this
value being the one used for the emissions in FLEXPART; see Stohl et al., 2007). In their prescribed burning experi-ments, McRae et al. (2006) found a range of EFCObetween
98 and 135 g kg−1. Kajii et al. (2002) report their lower
es-timate of EFCOof 81 g CO kg−1for crown and light surface
fires.
During Siberian boreal forest fires, the total fuel con-sumption (below and above ground) likely ranges between 2.5 kg m−2dry matter (Cahoon et al., 1994) and 3.7 kg m−2
(FIRESCAN Science Team, 1996). An average of 45% of C in dry fuel (Cahoon et al., 1994) suggests that 1.1– 1.7 kg C m−2are available to combustion. As a result, a total
of between 1.25 and 3.10 t CO (ha burned)−1may have been
emitted by the forest fires during this period. This compares with the estimate of Kajii et al. (2002) of 2.5–4.5 t CO ha−1
for the intense fire years of 1987 and 1998. Our values can also be expressed as a northern hemispheric 3.0–7.2 ppb CO increase per million hectare burned, a range higher than found in a regression analysis by Wotawa et al. (2001) for Russian fires (3 ppb CO Mha−1). This can be put further in
perspective when considering that 5–10 Mha are burnt each year (with large inter-annual variability) in Siberia (Conard et al., 2002).
Siberian forest fires are comparatively less intense than North American boreal fires, with more surface-type fires in Siberia (Wooster and Zhang, 2004). As a result, their com-bustion should be comparatively less efficient. However here the combustion efficiency is not clearly indicative of a smol-dering surface fire and the EFCOis at the lower end of the
range of values reported in the literature, suggesting that we sample emissions from the flaming phase of the forest fire.
The EBC emission ratio is estimated to 0.52±0.07 g BC kg−1. Calculation of this emission
ra-tio is based on maximum enhancements rara-tio in the plume. This is in line with the results of Andreae and Merlet (2001) who obtained the value 0.56±0.19 g BC kg−1. In
constructing their inventory, Lavou´e et al. (2000) used the value 0.75 g BC kg−1 for boreal forests, slightly higher
than the values reported here. Our data suggests a total of 0.05–0.09 t BC (ha burned)−1may have been emitted during
the period. ∆ E B C (µ g m − 3) (a) y=2.76 exp(−t/0.90) R2=0.63
0 0.5 1 1.5 2 ∆N 3 − 20 0 ( c m − 3)
( b )
y = 3 7 9 2 e x p ( − t / 2 . 2 7 ) R2= 0 . 8 8
0 1 0 0 0 2 0 0 0 3 0 0 0 4 0 0 0
∆ E B C / ∆ C O (x1 0 − 3µg m − 3pp b − 1) Age (days) (c) y=0.005 exp(−t/5.10) R2=0.43
0 5 10 15
0 2 4 6 8 ∆N 3 − 20 0 / ∆ C O (cm − 3pp b − 1) Age (days) (d) y=26.5 exp(−t/5.53) R2=0.59
0 5 10 15
0 10 20 30 40
Fig. 9. Aerosol concentration enhancements observed during flight 17 as a function of FLEXPART transport time for(a)1EBC, (b)1N3−200(ultrafine and accumulation mode particles), and en-hancement ratios for (c) 1EBC/1CO, (d) 1N3−200/1CO as a function of transport time. An exponential function is fitted to the data (red line).
3.5 Aerosol removal time scales
As we have shown in Fig. 4, the aircraft sampled several smoke plumes that were emitted in the same fire region, between Lake Baikal and Yakutsk. However, these plumes have different ages ranging between 1 and 13 days, and a de-crease in EBC mass concentration and particle number con-centration is expected due to removal and mixing processes. Figure 9 shows aerosol number concentration enhancement
1N, black carbon concentration enhancement1EBC as well as the enhancement ratios1N/1CO and1EBC/1CO as a function of plume age (Table 1). EBC concentrations de-crease exponentially with time. The exponential fit model explainsR2=63% of the variance of the signal for1EBC (Fig. 9a text inset). Over 10 days, 1EBC decreases by slightly less than two orders of magnitude and1EBC/1CO enhancement ratio by roughly one order of magnitude. The e-folding lifetime of EBC against removal processes is esti-mated at 5.1 days (see text inset in Fig. 9c) using the expo-nential fit of1EBC/1CO (R2=0.43). The stronger reduction of EBC concentrations relative to enhancement ratios is due to plume dilution by mixing with background air, which af-fects both EBC and CO.
valid for BC particles in the submicron range. Our estimated EBC lifetime of 5.1 days supports assumed BC lifetime in other studies. Stohl (2006) reviewed lifetimes used in three modelling studies ranging between 3 and 7 days (respectively 6±2 days (Park et al., 2005), 3–4 days (Liu et al., 2005), and 7.3 days (Koch and Hansen, 2005)).
Ultrafine particle number concentrations are also decreas-ing with plume age (Fig. 9b and d), with an exponential fit that explainsR2=0.59 of the variance between age and the
1N/1CO ratio. The lifetime implied by the exponential fit is 5.5 days (Fig. 9d). Possible sinks for particles in this size range are coagulation onto pexisting larger particles or re-moval processes. The slightly faster decrease of EBC con-centration (5.1 days) relative to the decrease in total aerosol number concentration is due to the difference between size-limited sensitivities of the two measurement techniques. The intercept indicates that the ultra fine particle emission ratio was∼26 cm−3ppb−1. The values found for1N/1CO are consistent with other estimates at various plume ages, ob-tained essentially in the tropics (Andreae et al., 1994, 2001). For example Andreae et al. (1994) found for plumes of age 2–6 days a1N/1CO=2–8 for sizes above 0.1 µm and 8–18 for Aitken nuclei (more comparable to our case). In our es-timates of lifetimes, the error in the regression of the con-centration ratios is linked to the imprecision of airmass age determination (error estimated to ±1 day) and to the value chosen as a background for particles concentrations (within
±50 cm−3).
4 Conclusions
In the framework of the YAK-AEROSIB/POLARCAT exper-iments we carried out intensive airborne campaigns to mea-sure the tropospheric distribution of trace gases and aerosols including equivalent black carbon (EBC). The background mixing ratios of trace gases were generally similar to pre-vious YAK-AEROSIB summer campaigns. However, sev-eral layers with high CO, aerosol and BC concentrations were observed on three flights, which were caused by for-est fires in Eastern Siberia near Yakutsk. During one flight, on 11 July 2008, several plumes were observed that all orig-inated from the same fires but took different atmospheric transport routes.
Based on the data acquired during a vertical profile close to the fires, we derived an average CO emission factors of 65.5±10.8 g CO per kilogram of dry matter burned. This CO emission factor, although rather low compared to val-ues in the literature, suggests that fires in Siberia could cause an increase in northern hemispheric CO mixing ratios of 3.0–7.2 ppb per million hectares (Mha) burned, with up to
∼10 Mha burning annually in Siberia. For EBC we obtained an emission factor of 0.52±0.07 g BC kg−1. The
emis-sion ratio of ultra-fine particles (3.5–200 nm) was 26 cm−3
(ppb CO)−1, consistent with other airborne studies.
A variety of plumes were encountered during the 11 July flight. Their ages ranged from less than 1 day to 13 days, as determined from backward simulations with the La-grangian particle dispersion model FLEXPART. The most aged plumes were found in the free troposphere near the Siberian Arctic coast at approximately 70◦N, while the
freshest plumes were found near Yakutsk, not far from the fires. Smoke plumes were lifted by several frontal systems passing through the study area.
High EBC concentrations were observed near the fire (up to 1.5 µg m−3), whereas aged plumes had near-background
EBC concentrations (0.02 µg m−3). Using an exponential
fit to the observed time dependence of EBC and ultrafine particle enhancement ratios with CO, our observations sug-gest lifetimes in the Siberian troposphere of 5.1 days for EBC and 5.5 days for ultrafine particles. The most aged plume (13 days) had a strong negative correlation between CO and O3 (R2=0.78) with a O3/CO regression slope of −0.04 ppb O3/ppb CO, indicating that O3 destruction
dom-inated over photochemical production in this aged plume.
Acknowledgements. We thank the scientific and flight crews for
carrying out successfully the campaigns. Burnt area product was provided by A. I. Sukhinin. Thanks to D. McRae and B. J. Stocks for useful discussions and support. M. Ramonet, J.-L. Teffo, I. G. Granberg and G. S. Golitsyn are acknowledged for their contribution to the YAK-AEROSIB project. This study was funded by ANR as a part of POLARCAT France (grant BLAN06-1 137670), by the Norwegian Research Council as part of POLARCAT-Norway, and by CEA, CNRS, French Ministry of Foreign Affairs, the Russian Foundation for Basic Research (grants 07-05-00645, 08-05-10033 and 08-05-92499), and the Russian Academy of Science.
Edited by: J. W. Bottenheim
The publication of this article is financed by CNRS-INSU.
References
Andreae, M. O., Anderson, B. E., Blake, D. R., Bradshaw, J. D., Collins, J. E., Gregory, G. L., Sachse, G. W., and Shipham, M. C.: Influence of plumes from biomass burning on atmospheric chemistry over the equatorial and tropical South Atlantic during CITE 3, J. Geophys. Res.-Atmos., 99(D6), 12793–12808, 1994. Andreae, M. O. and Merlet, P.: Emission of trace gases and aerosols from biomass burning, Global Biogeochem. Cy., 15(4), 955–966, 2001.
Lelieveld, J., Lindinger, W., Longo, K., Peters, W., de Reus, M., Scheeren, B., Dias, M. A. F. S., Strom, J., van Velthoven, P. F. J., and Williams, J.: Transport of biomass burning smoke to the upper troposphere by deep convection in the equatorial region, Geophys. Res. Lett., 28(6), 951–954, 2001.
Arshinov M., Belan, B. D., Nedelec, P., Paris, J.-D., and Machida, T.: Spatial distribution of nanoparticles in the free tropo-sphere over Siberia, in: Nucleation and Atmospheric Physics, 17th International Conference on Nucleation and Atmospheric Aerosols, edited by: O’Dowd, C. D. and Wagner, P. E., Springer, 819–823, 2007.
Cahoon Jr., D. R., Stocks, B. J., Levine, J. S., Cofer III, W. R., and Pierson, J. M.: Satellite analysis of the severe 1987 forest fires in northern China and southeastern Siberia, J. Geophys. Res.-Atmos., 99, 18627–18638, 1994.
Cofer III, W. R., Levine J. S., Sebacher, D. I., Winstead, E. L., Rig-gan, P. J., Stocks, B. J., Brass, J. A., Ambrosia, V. G., and Boston, P. J.: Trace gas emissions from chaparral and boreal forest fires, J. Geophys. Res.-Atmos., 94, 2255–2259, 1989.
Cofer III, W. R., Winstead, E. L., Stocks B. J., Overbay, L. W., Goldammer, J. G., Cahoon, D. R., and Levine, J. S.: Emissions from boreal forest fires: are the atmospheric impacts underesti-mated?, in: Global Biomass Burning and Global Change, edited by: Levine, J. S., MIT Press, Cambridge, Mass., 834–839, 1996. Cofer III, W. R., Winstead, E. L. Stocks, B. J., Goldammer, J. G., and Cahoon, D. R.: Crown fire emissions of CO2, CO, H2, CH4, and TNMHC from a dense jack pine boreal forest fire, Geophys. Res. Lett., 25, 3919–3922, 1998.
Conard, S. G., Sukhinin, A. I., Stocks, B. J., Cahoon, D. R., Davi-denko, E. P., and Ivanova, G. A.: Determining effects of area burned and fire severity on carbon cycling and emissions in Siberia, Clim. Change, 55, 197–211, 2002.
FIRESCAN Science Team: Fire in Ecosystems of Boreal Eura-sia: The Bor Forest Island Fire Experiment, Fire Research Campaign Asia-North (FIRESCAN), in: Biomass Burning and Global Change, edited by: Levine, J. S., MIT Press, Cambridge, Mass., 848–873, 1996.
Flanner, M. G., Zender, C. S., Randerson, J. T., and Rasch, P. J.: Present day climate forcing and response from black carbon in snow, J. Geophys. Res.-Atmos., 112, D11202, doi:10.1029/2006JD008003, 2007.
Generoso, S., Bey, I., Atti´e, J.-L., and Br´eon, F.-M.: A satellite-and model-based assessment of the 2003 Russian fires: Impact on the Arctic region, J. Geophys. Res.-Atmos., 112, D15302, doi:10.1029/2006JD008344, 2007.
Giglio, L., Descloitres, J., Justice, C. O., and Kaufman, Y.: An en-hanced contextual fire detection algorithm for MODIS, Remote Sens. Environ., 87, 273–282, 2003.
Jacobson, M. Z.: Strong radiative heating due to the mixing state of black carbon in atmospheric aerosols, Nature, 409, 695–697, 2001.
Jain, A. K., Tao, Z., Yang, X., and Gillespie, C.: Estimates of global biomass burning emissions for reactive greenhouse gases (CO, NMHCs, and NOx) and CO2, J. Geophys. Res.-Atmos., 111, D06304, doi:10.1029/2005JD006237, 2006.
Kajii, Y., Kato, S., Streets, D. G. Tsai, N. Y., Shvidenko, A., Nils-son, S., McCallum, I., Minko, N. P., Abushenko, N., Altyntsev, D., and Khodzer, T. V.: Boreal forest fires in Siberia in 1998: Es-timation of area burned and emissions of pollutants by advanced
very high resolution radiometer satellite data, J. Geophys. Res.-Atmos., 107(D24), 4745, doi:10.1029/2001JD001078, 2002. Kasischke, E. S., Hyer, E. J., Novelli, P. C., Bruhwiler, L. P., French,
N. H. F., Suckhinin, A. I., Hewson, J. H., and Stocks, B. J.: In-fluences of boreal fire emissions on Northern Hemisphere atmo-spheric carbon and carbon monoxide, Global Biogeochem. Cy., 19, GB1012, doi:10.1029/2004GB002300, 2005.
Koch, D. and Hansen, J.: Distant origins of Arctic Black Car-bon: A GISS ModelE experiment, J. Geophys. Res.-Atmos., 110, D04204, doi:10.1029/2004JD005296, 2005.
Lavou´e, D. C., Liousse, C., Cachier, H., Stocks, B. J., and Goldammer, J. G.: Modelling of carbonaceous particles emitted by boreal and temperate wildfires at northern latitudes, J. Geo-phys. Res.-Atmos., 105, 26871–26890, 2000.
Lehsten, V., Tansey, K., Balzter, H., Thonicke, K., Spessa, A., We-ber, U., Smith, B., and Arneth, A.: Estimating carbon emissions from African wildfires, Biogeosciences, 6, 349–360, 2009, http://www.biogeosciences.net/6/349/2009/.
Liu, X. H., Penner, J. E., and Herzog, M.: Global modeling of aerosol dynamics: Model description, evaluation, and interac-tions between sulfate and nonsulfate aerosols, J. Geophys. Res.-Atmos., 110(D18), D18206, doi:10.1029/2004JD005674, 2005. McRae, D. J., Conard, S. G., Ivanova, G. A., Sukhinin, A. I.,
Baker, S. P., Samsonov, Y. N., Blake, T. W., Ivanov, V. A., Ivanov, A. V., Churkina, T. V., Hao, W. M., Koutzenogij, K. P., and Kovaleva, N.: Variability of fire behavior, fire effects, and emissions in scotch pine forests of Central Siberia, Mitiga-tion and AdaptaMitiga-tion Strategies for Global Change, 11(1), 45–74, doi:10.1007/s11027-006-1008-4, 2006.
Nakazawa, T., Sugawara, S., Inoue, G., Machida, T., Makshyutov, S., and Mukai, H.: Aircraft measurements of the concentrations of CO2, CH4, N2O, and CO and the carbon and oxygen isotopic ratios of CO2in the troposphere over Russia, J. Geophys. Res.-Atmos., 102(D3), 3843–3859, 1997.
N´ed´elec, P., Cammas, J.-P., Thouret, V., Athier, G., Cousin, J.-M., Legrand, C., Abonnel, C., Lecoeur, F., Cayez, G., and Marizy, C.: An improved infrared carbon monoxide analyser for routine measurements aboard commercial Airbus aircraft: technical val-idation and first scientific results of the MOZAIC III programme, Atmos. Chem. Phys., 3, 1551–1564, 2003,
http://www.atmos-chem-phys.net/3/1551/2003/.
N´ed´elec, P., Thouret, V., Brioude, J., Sauvage, B., Cammas, J. P., and Stohl, A.: Extreme CO concentrations in the upper tro-posphere over northeast Asia in June 2003 from the in situ MOZAIC aircraft data, Geophys. Res. Lett., 32(14), L14807, doi:10.1029/2005GL023141, 2005.
Olivier, J. G. J. and Berdowski, J. J. M.: Global emissions sources and sinks, in: The Climate System, edited by: Berdowski, J., Guicherit, R., and Heij, B. J., A. A. Balkema Publishers/Swets & Zeitlinger Publishers, Lisse, The Netherlands, ISBN 905809255-0, 33–78, 2001.
Panchenko, M. V., Kozlov, V. S., Terpugova, S. A., Shmargunov, V. P., and Burkov, V. V.: Simultaneous measurements of sub-micron aerosol and absorbing substance in the height range up to 7 km, in: Tenth ARM Science Team Meeting Proceeding, San Antonio, Texas, 13–17 March, www.arm.gov/publications/ proceedings/conf10/extended abs/panchenko mv.pdf, 2000. Paris, J.-D., Arshinov, M., Ciais, P., Belan, B., and Nedelec,
par-ticle concentrations in the remote Siberian troposphere: New particle formation studies, Atmos. Environ., 43(6), 1302–1309, doi:10.1016/j.atmosenv.2008.11.032, 2009a.
Paris, J.-D., Stohl, A., Ciais, P., N´ed´elec, P., Belan, B. D., Arshi-nov, M. Y., and Ramonet, M.: Source-receptor relationships for airborne measurements of CO2, CO and O3 above Siberia: a cluster-based approach, Atmos. Chem. Phys. Discuss., 9, 6207– 6245, 2009b,
http://www.atmos-chem-phys-discuss.net/9/6207/2009/. Paris, J.-D., P. Ciais, P. N´ed´elec, M. Ramonet, B. D. Belan, M.
Yu. Arshinov, G. S. Golitsyn, I. Granberg, A. Stohl, G. Cayez, G. Athier, F. Boumard, and J.-M. Cousin: The YAK-AEROSIB transcontinental aircraft campaigns: new insights on the trans-port of CO2, CO and O3across Siberia, Tellus B, 60(4), 551– 568, doi:10.1111/j.1600-0889.2008.00369.x, 2008.
Park, R. J., Jacob, D. J., Palmer, P. I., Clarke, A. D., Weber, R. J., Zondlo, M. A., Eisele, F. L., Bandy, A. R., Thornton, D. C., Sachse, G. W., and Bond, T. C.: Export efficiency of black carbon aerosol in continental outflow: global implications, J. Geophys. Res.-Atmos., 110, D11205, doi:10.1029/2004JD005432, 2005. Pommier, M., Turquety, S., Clerbaux, C., et al.: Pollution plume
transport to the Arctic as seen by IASI during summer 2008, At-mos. Chem. Phys. Discuss., in preparation, 2009.
Quinn, P. K., Bates, T. S., Baum, E., Doubleday, N., Fiore, A. M., Flanner, M., Fridlind, A., Garrett, T. J., Koch, D., Menon, S., Shindell, D., Stohl, A., and Warren, S. G.: Short-lived pollutants in the Arctic: their climate impact and possible mitigation strate-gies, Atmos. Chem. Phys., 8, 1723–1735, 2008,
http://www.atmos-chem-phys.net/8/1723/2008/.
Real, E., Law, K. S., Weinzierl, B., Fiebig, M., Petzold, A., Wild, O., Methven, J., Arnold, S., Stohl, A., Huntrieser, H., Roiger, A., Schlager, H., Stewart, D., Avery, M., Sachse, G., Brow-ell, E., Ferrare, R., and Blake D.: Processes in?uencing ozone levels in Alaskan forest fire plumes during long-range transport over the North Atlantic, J. Geophys. Res.-Atmos., 112, D10S41, doi:10.1029/2006JD007576, 2007.
Reid, J. S., Koppmann, R., Eck, T. F., and Eleuterio, D. P.: A review of biomass burning emissions part II: intensive physical proper-ties of biomass burning particles, Atmos. Chem. Phys., 5, 799– 825, 2005,
http://www.atmos-chem-phys.net/5/799/2005/.
Seibert, P. and Frank, A.: Source-receptor matrix calculation with a Lagrangian particle dispersion model in backward mode, Atmos. Chem. Phys., 4, 51–63, 2004,
http://www.atmos-chem-phys.net/4/51/2004/.
Stohl, A.: Characteristics of atmospheric transport into the Arctic troposphere, J. Geophys. Res.-Atmos. 111, D11306, doi:10.1029/2005JD006888, 2006.
Stohl, A., Forster, C., Frank, A., Seibert, P., and Wotawa, G.: Tech-nical note: The Lagrangian particle dispersion model FLEX-PART version 6.2, Atmos. Chem. Phys., 5, 2461–2474, 2005, http://www.atmos-chem-phys.net/5/2461/2005/.
Stohl, A., Berg, T., Burkhart, J. F., Fjae’raa, A. M., Forster, C., Herber, A., Hov, Ø., Lunder, C., McMillan, W. W., Oltmans, S., Shiobara, M., Simpson, D., Solberg, S., Stebel, K., Str¨om, J., Tørseth, K., Treffeisen, R., Virkkunen, K., and Yttri, K. E.: Arctic smoke – record high air pollution levels in the European Arctic due to agricultural fires in Eastern Europe in spring 2006, Atmos. Chem. Phys., 7, 511–534, 2007,
http://www.atmos-chem-phys.net/7/511/2007/.
Stohl, A., Andrews, E., Burkhart, J. F., Forster, C., Herber, A., Hoch, S. W. , Kowal, D., Lunder, C., Mefford, T., Ogren, J. A., Sharma, S., Spichtinger, N., Stebel, K., Stone, R., Str¨om, J., Tørseth, K., Wehrli, C., and Yttri, K. E.: Pan-Arctic enhance-ments of light absorbing aerosol concentrations due to North American boreal forest fires during summer 2004, J. Geophys. Res.-Atmos., 111, D22214, doi:10.1029/2006JD007216, 2006. Sukhinin, A. I., French, N. H. F., Kasischke, E. S., Hewson, J. H.,
Soja, A. J., Csiszar, I. A., Hyer, E. J., Loboda, T., Conrad, S. G., Romasko, V. I., Pavlichenko, E. A., Miskiv, S. I., and Slinkina, O. A.: AVHRR-based mapping of fires in Russia: New prod-ucts for fire management and carbon cycle studies, Remote Sens. Environ., 93, 546–564, 2004.
Turquety, S., Logan, J. A., Jacob, D. J., Hudman, R. C., Leung, F. Y., Heald, C. L., Yantosca, R. M., Wu, S. L., Emmons, L. K., Edwards, D. P., and Sachse, G. W.: Inventory of boreal fire emis-sions for North America in 2004: Importance of peat burning and pyroconvective injection, J. Geophys. Res.-Atmos., 112, D1203, doi:10.1029/2006JD007281, 2007.
Val Martin, M., Honrath, R. E., Owen, R. C., Pfister, G., Fialho, P., and Barata, F.: Significant enhancements of nitrogen oxides, black carbon, and ozone in the North Atlantic lower free tropo-sphere resulting from North American boreal wildfires, J. Geo-phys. Res.-Atmos., 111, D23S60, doi:10.1029/2006JD007530, 2006.
van der Werf, G. R., Randerson, J. T., Giglio, L., Collatz, G. J., Kasibhatla, P. S., and Arellano Jr., A. F.: Interannual variability in global biomass burning emissions from 1997 to 2004, Atmos. Chem. Phys., 6, 3423–3441, 2006,
http://www.atmos-chem-phys.net/6/3423/2006/.
Ward, D. E., Setzer, A., Kaufman, Y. J., and Rasmussen, R. A.: Characteristics of smoke emissions from biomass fires of the Amazon region-Base-A experiment, in: Global Biomass Burn-ing, edited by: Levine, J. S., MIT Press, Cambridge MA, 394– 402, 1991.
Warneke, C., Bahreini, R., Brioude, J., Brock, C. A., De Gouw, J., Fahey, D. W., Froyd, K. D., Holloway, J. S., Middlebrook, A., Miller, L., Montzka, S., Murphy, D. M., Peischl, J.,. Ryerson, T. B, Schwarz, J. P., Spackman, J. R., and Veres, P.: Biomass burning in Siberia and Kazakhstan as an important source for haze over the Alaskan Arctic in April 2008, Geophys. Res. Lett., 36, L02813, doi:10.1029/2008GL036194, 2009.
Wofsy, S. C., Fan, S.-M., Blake, D. R., Bradshaw, J. D., Sandholm, S. T., Singh, H. B., Sachse, G. W., and Harriss, R. C.: Factors in-fluencing atmospheric composition over subarctic North Amer-ica during summer, J. Geophys. Res.-Atmos., 99(D1), 1887– 1897, 1994.