ACPD
13, 26841–26891, 2013Global peroxyacetyl
nitrate (PAN) budget
E. V. Fischer et al.
Title Page
Abstract Introduction
Conclusions References
Tables Figures
◭ ◮
◭ ◮
Back Close
Full Screen / Esc
Printer-friendly Version
Interactive Discussion
Discussion
P
a
per
|
D
iscussion
P
a
per
|
Discussion
P
a
per
|
Discuss
ion
P
a
per
|
Atmos. Chem. Phys. Discuss., 13, 26841–26891, 2013 www.atmos-chem-phys-discuss.net/13/26841/2013/ doi:10.5194/acpd-13-26841-2013
© Author(s) 2013. CC Attribution 3.0 License.
Atmospheric
Chemistry
and Physics
Open Access
Discussions
This discussion paper is/has been under review for the journal Atmospheric Chemistry and Physics (ACP). Please refer to the corresponding final paper in ACP if available.
Atmospheric peroxyacetyl nitrate (PAN):
a global budget and source attribution
E. V. Fischer
1, D. J. Jacob
2, R. M. Yantosca
2, M. P. Sulprizio
2, D. B. Millet
3,
J. Mao
4, F. Paulot
1, H. B. Singh
5, A.-E. Roiger
6, L. Ries
8, R. W. Talbot
7,
K. Dzepina
9, and S. Pandey Deolal
101
Department of Atmospheric Science, Colorado State University, Fort Collins, CO, USA
2
School of Engineering and Applied Sciences, Harvard University, Cambridge, MA, USA
3
Department of Soil, Water and Climate, University of Minnesota, St. Paul, MN, USA
4
Princeton University, GFDL, Princeton, NJ, USA
5
NASA Ames Research Center, Moffett Field, CA, USA
6
German Aerospace Center, Institute of Atmospheric Physics, Atmospheric Trace Gases, Oberphaffenhofen, Germany
7
Federal Environment Agency, GAW Global Station Zugspitze/Hohenpeissenberg, Zugspitze, Germany
8
Department of Earth and Atmospheric Sciences, University of Houston, Houston, TX, USA
9
Department of Chemistry, Michigan Technological University, Houghton, MI USA
10
ACPD
13, 26841–26891, 2013Global peroxyacetyl
nitrate (PAN) budget
E. V. Fischer et al.
Title Page
Abstract Introduction
Conclusions References
Tables Figures
◭ ◮
◭ ◮
Back Close
Full Screen / Esc
Printer-friendly Version
Interactive Discussion
Discussion
P
a
per
|
D
iscussion
P
a
per
|
Discussion
P
a
per
|
Discuss
ion
P
a
per
Received: 25 August 2013 – Accepted: 6 September 2013 – Published: 15 October 2013
Correspondence to: E. V. Fischer ([email protected])
ACPD
13, 26841–26891, 2013Global peroxyacetyl
nitrate (PAN) budget
E. V. Fischer et al.
Title Page
Abstract Introduction
Conclusions References
Tables Figures
◭ ◮
◭ ◮
Back Close
Full Screen / Esc
Printer-friendly Version
Interactive Discussion
Discussion
P
a
per
|
D
iscussion
P
a
per
|
Discussion
P
a
per
|
Discuss
ion
P
a
per
|
Abstract
Peroxyacetyl nitrate (PAN) formed in the atmospheric oxidation of non-methane volatile
organic compounds (NMVOCs), is the principal tropospheric reservoir for nitrogen
ox-ide radicals (NO
x=
NO
+
NO
2). PAN enables the transport and release of NO
xto the
re-mote troposphere with major implications for the global distributions of ozone and OH,
5the main tropospheric oxidants. Simulation of PAN is a challenge for global models
be-cause of the dependence of PAN on vertical transport as well as complex and uncertain
NMVOC sources and chemistry. Here we use an improved representation of NMVOCs
in a global 3-D chemical transport model (GEOS-Chem) and show that it can simulate
PAN observations from aircraft campaigns worldwide. The immediate carbonyl
precur-10sors for PAN formation include acetaldehyde (44 % of the global source), methylglyoxal
(30 %), acetone (7 %), and a suite of other isoprene and terpene oxidation products
(19 %). A diversity of NMVOC emissions is responsible for PAN formation globally
in-cluding isoprene (37 %) and alkanes (14 %). Anthropogenic sources are dominant in
the extratropical Northern Hemisphere outside the growing season. Open fires appear
15to play little role except at high northern latitudes in spring, although results are very
sensitive to plume chemistry and plume rise. Lightning NO
xis the dominant contributor
to the observed PAN maximum in the free troposphere over the South Atlantic.
1
Introduction
Peroxyacetyl nitrate (PAN, CH
3COO
2NO
2) is the principal tropospheric reservoir
20species for nitrogen oxide radicals (NO
x=
NO
+
NO
2) with important implications for
the production of tropospheric ozone (O
3) and of the hydroxyl radical OH (the main
atmospheric oxidant) (Singh and Hanst, 1981). PAN is formed by oxidation of
non-methane volatile organic compounds (NMVOCs) in the presence of NO
x. NMVOCs
and NO
xhave both natural and anthropogenic sources. Fossil fuel combustion is the
25ACPD
13, 26841–26891, 2013Global peroxyacetyl
nitrate (PAN) budget
E. V. Fischer et al.
Title Page
Abstract Introduction
Conclusions References
Tables Figures
◭ ◮
◭ ◮
Back Close
Full Screen / Esc
Printer-friendly Version
Interactive Discussion
Discussion
P
a
per
|
D
iscussion
P
a
per
|
Discussion
P
a
per
|
Discuss
ion
P
a
per
soils (van der A et al., 2008). The organic side of PAN formation involves many stages
of NMVOC oxidation. Most NMVOCs can serve as PAN precursors but the yields vary
widely (Roberts, 2007).
PAN enables the long-range transport of NO
xat cold temperatures, and PAN
decom-position releases NO
xin the remote troposphere where it is most e
ffi
cient at producing
5O
3and OH (Singh and Hanst, 1981; Hudman et al., 2004; Fischer et al., 2010; Singh,
1987). NO
xabundance controls the balance of O
3production and destruction.
With-out PAN formation the distributions of tropospheric NO
x, O
3and OH would be very
di
ff
erent, with higher values in NO
xsource regions and lower values in the remote
troposphere (Kasibhatla et al., 1993; Moxim et al., 1996; Wang et al., 1998a). PAN
10chemistry can also be important for oxidant formation on a regional scale. In polluted
environments, PAN formation is a sink for both NO
xand hydrogen oxide radicals (HO
x).
Observations show that O
3concentrations increase when temperature increases, and
this has been in part related to PAN thermal instability (Sillman and Samson, 1995).
Observations also show that the production of PAN becomes more e
ffi
cient relative to
15O
3in highly polluted air masses (Roberts et al., 1995). Thus a comprehensive
under-standing of PAN is needed to understand oxidant distributions on a spectrum of scales.
A large body of PAN observations worldwide has accumulated over the years,
includ-ing in particular from aircraft platforms and mountaintop sites. There have also been
re-cent retrievals of PAN conre-centrations in the upper troposphere from satellites (Glatthor
20et al., 2007; Tereszchuk et al., 2013). Concentrations vary from pptv levels in warm
remote locations such as tropical oceans to ppbv levels in polluted source regions.
De-spite the relatively large database of measurements compared to other photochemical
indicators, simulation of PAN in global chemical transport models (CTMs) has been
a di
ffi
cult challenge because of the complexity of PAN chemistry. Recent model
inter-25ACPD
13, 26841–26891, 2013Global peroxyacetyl
nitrate (PAN) budget
E. V. Fischer et al.
Title Page
Abstract Introduction
Conclusions References
Tables Figures
◭ ◮
◭ ◮
Back Close
Full Screen / Esc
Printer-friendly Version
Interactive Discussion
Discussion
P
a
per
|
D
iscussion
P
a
per
|
Discussion
P
a
per
|
Discuss
ion
P
a
per
|
Here we exploit a worldwide collection of PAN observations to improve the PAN
sim-ulation in the GEOS-Chem CTM, which has been used extensively in global studies
of tropospheric oxidants (Bey et al., 2001; Sauvage et al., 2007; Murray et al., 2012).
The earliest global models that included PAN chemistry (Kasibhatla et al., 1993; Moxim
et al., 1996) relied on highly simplified NMVOC budgets. Our improvements involve new
5treatments of NMVOC sources and chemistry, a well-known weakness even in current
CTMs (Williams et al., 2013; Ito et al., 2007). Our new simulation, which captures the
major features of the existing observations, a
ff
ords a new opportunity to understand
the factors driving the global PAN distribution and the essential chemistry that needs
to be described. A detailed analysis of how PAN shapes the global distributions of the
10atmospheric oxidants and nitrogen deposition will be the focus of a subsequent paper.
2
Model description
We use the GEOS-Chem global 3-D CTM including detailed ozone-NO
x-VOC-aerosol
chemistry (version 9.01.01, www.geos-chem.org) with significant modifications as
de-scribed below.
15
2.1
Chemistry
GEOS-Chem uses a chemical scheme originally described by Horowitz et al. (1998)
and Bey et al. (2001), with recent updates outlined in Mao et al. (2010). Following
Marais et al. (2012) we have updated the rate coe
ffi
cients for the reactions of HO
2with
the
>
C
2peroxy radicals to Eq. (iv) in Saunders et al. (2003). We also include
night-20ACPD
13, 26841–26891, 2013Global peroxyacetyl
nitrate (PAN) budget
E. V. Fischer et al.
Title Page
Abstract Introduction
Conclusions References
Tables Figures
◭ ◮
◭ ◮
Back Close
Full Screen / Esc
Printer-friendly Version
Interactive Discussion
Discussion
P
a
per
|
D
iscussion
P
a
per
|
Discussion
P
a
per
|
Discuss
ion
P
a
per
PAN is produced reversibly by reaction of the peroxyacetyl (PA) radical CH
3C(O)OO
with NO
2:
CH
3C(O)OO
+
NO
2+
M
⇆
PAN
+
M
(1)
where
M
is a third body (typically N
2or O
2). The dominant sources of CH
3C(O)OO are
the oxidation of acetaldehyde (CH
3CHO) and the photolysis of acetone (CH
3C(O)CH
3)
5and methylglyoxal (CH
3COCHO):
CH
3CHO
+
OH
O2−→
CH
3C(O)OO
+
H
2O
(2)
CH
3C(O)CH
3+
h
υ
O2−→
CH
3C(O)OO
+
CH
3(3)
CH
3COCHO
+
h
υ
O2−→
CH
3C(O)OO
+
HCO
(4)
10
PAN can also be produced at night via reaction of acetaldehyde with the nitrate radical.
Acetaldehyde, acetone and methylglyoxal are both directly emitted (“primary” sources)
and produced in the atmosphere from oxidation of primary emitted NMVOCs
(“sec-ondary” sources). These di
ff
erent sources will be discussed below. There are also other
minor sources of the PA radical, again to be discussed below.
15
Higher acyl peroxy nitrates (RC(O)OONO
2) are similarly formed from the oxidation of
NMVOCs, but their yields are much lower than that for PAN. We focus on PAN because
observations show that it typically accounts for 75–90 % of total acyl peroxy nitrates
(Roberts, 2007; Roberts et al., 1998, 2002; Wolfe et al., 2007) and there are an
abun-dance of measurements of PAN. Closure on measurements of total reactive nitrogen
20oxides (NO
y) confirms the dominant role of PAN as an organic nitrate reservoir for NO
x(Roberts et al., 1995; Bertram et al., 2013).
The main sink of PAN is thermal decomposition (Reverse of Reaction 1), and the
e
ff
ective PAN lifetime depends on whether the released PA radical reacts with NO
2to
return PAN, or with another species (mainly NO or HO
2) leading to permanent loss.
25ACPD
13, 26841–26891, 2013Global peroxyacetyl
nitrate (PAN) budget
E. V. Fischer et al.
Title Page
Abstract Introduction
Conclusions References
Tables Figures
◭ ◮
◭ ◮
Back Close
Full Screen / Esc
Printer-friendly Version
Interactive Discussion
Discussion
P
a
per
|
D
iscussion
P
a
per
|
Discussion
P
a
per
|
Discuss
ion
P
a
per
|
the cycling between PAN and the PA radical, which is taken from Bridier et al. (1991)
and Sehested et al. (1998). The parameters recommended by Bridier et al. (1991) are
consistent with later studies of PAN decomposition by Roberts and Bertman (1992),
Orlando et al. (1992), and Grosjean et al. (1994). The rate coe
ffi
cient for the reaction
of the PA radical with NO is also from Tyndall et al. (2001).
5
Primary NMVOCs in the standard GEOS-Chem mechanism that contribute to PAN
formation include ethane, propane,
>
C
3alkanes (lumped),
>
C
2alkenes (lumped),
isoprene, acetaldehyde, methylglyoxal, acetone, and
>
C
3ketones (lumped). Our
ex-tended mechanism adds several additional primary NMVOCS including ethanol,
ben-zene, toluene and ethylbenzene (lumped), xylenes and trimethyl benzenes (lumped),
10and monoterpenes (lumped). The additions were partially motivated by the work of Ito
et al. (2007) who extended the GEOS-Chem mechanism within the IMPACT CTM to
include a broader suite of NMVOCs. One result of this exercise was a dramatic
in-crease in PAN formation through methylglyoxal and hydroxyacetone. Liu et al. (2010)
found aromatics to be a major source of PAN in urban China through the production of
15methylglyoxal. We calculate the associated yield of methylglyoxal using recommended
values for the individual aromatic species (toluene, o-xylene, m-xylene, p-xylene,
1,2,3-trimethylbenzene, 1,2,4-1,2,3-trimethylbenzene, and 1,3,5-trimethylbenzene) from Nishino
et al. (2010) and the observed mean aromatic speciation for Chinese cities from
Bar-letta et al. (2006).
20
We adopted the treatment of monoterpene oxidation from the RACM2 chemical
mechanism (Goli
ff
et al., 2013), lumping terpenes with one double bond (alpha-pinene,
beta-pinene, sabinene and delta-3-carene) into one proxy. Unlike Ito et al. (2007),
hy-droxyacetone is not a product of terpene oxidation in the revised RACM2 mechanism
used here.
25
ACPD
13, 26841–26891, 2013Global peroxyacetyl
nitrate (PAN) budget
E. V. Fischer et al.
Title Page
Abstract Introduction
Conclusions References
Tables Figures
◭ ◮
◭ ◮
Back Close
Full Screen / Esc
Printer-friendly Version
Interactive Discussion
Discussion
P
a
per
|
D
iscussion
P
a
per
|
Discussion
P
a
per
|
Discuss
ion
P
a
per
that of O
3(Shepson et al., 1992), but we explore the sensitivity to this choice. Photolysis
and deposition account globally for 1.8 % and 1.2 % of the global PAN sink respectively.
Photolysis of PAN is important in the upper troposphere where the lifetime against loss
via photolysis is on the order of a month (Talukdar et al., 1995). We find that assuming
PAN reactivity with surfaces is more similar to O
3rather than NO
2, decreases surface
5PAN concentrations over Northern Hemisphere continents by 15–20 % in spring.
Re-action of PAN with both the OH radical and Cl atoms is slow, and these are both minor
loss pathways, unnecessary to include in global models (Wallington et al., 1990;
Taluk-dar et al., 1995). Uptake on ice particles in convective clouds (Marecal et al., 2010)
and on organic aerosols (Roberts, 2005) are both thought to be negligible and are not
10included here. PAN is only sparingly soluble, but hydrolysis of the PA radical is thought
to explain observed PAN loss in fog (Villalta et al., 1996; Roberts et al., 1996). We do
not consider this to be a significant loss process for PAN on a global scale (Jacob,
2000).
2.2
Emissions
15
Production of PAN can be limited by either the supply of NO
xor NMVOCs, as discussed
below. Global fossil fuel emissions of NO
xin GEOS-Chem are from the EDGAR
in-ventory (Oliver and Berdowski, 2001) and are overwritten with regional inventories for
Europe (EMEP) (Vestreng and Klein, 2002), Mexico (BRAVO) (Kuhns et al., 2003),
East Asia (Zhang, Q. et al., 2009), Canada (NPRI, http://www.ec.gc.ca/inrp-npri/), and
20the United States (EPA/NEI2005, http://www.epa.gov/ttnchie1/net/2005inventory.html).
All anthropogenic NO
xemissions are scaled to 2008 based on energy statistics (van
Donkelaar et al., 2008). Soil NO
xemissions in GEOS-Chem are based on Yienger
and Levy (1995) as implemented by Wang et al. (1998b). Lightning NO
xemissions are
described by Sauvage et al. (2007).
25
ACPD
13, 26841–26891, 2013Global peroxyacetyl
nitrate (PAN) budget
E. V. Fischer et al.
Title Page
Abstract Introduction
Conclusions References
Tables Figures
◭ ◮
◭ ◮
Back Close
Full Screen / Esc
Printer-friendly Version
Interactive Discussion
Discussion
P
a
per
|
D
iscussion
P
a
per
|
Discussion
P
a
per
|
Discuss
ion
P
a
per
|
emissions aside from ethane and propane. Ethane and propane emissions in RETRO
were far too low compared to the GEOS-Chem inventories from Xiao et al. (2008),
which are unbiased relative to observations. Emissions of both species appeared to be
missing from the major natural gas production region in Russia. We used the ethane
and propane emission inventories which were developed as in Xiao et al. (2008). The
5RETRO emission inventory is for 2000, and we scaled it to 2008 following van
Donke-laar et al. (2008). RETRO includes anthropogenic emissions for benzene, xylene and
toluene. Based on the observed CO to benzene ratio for TRACE-P, we increased
ben-zene emissions over China by 25 %. We then scaled xylene and toluene emissions to
benzene based on measurements from 43 Chinese cities from Barletta et al. (2006).
10Thus RETRO emissions of toluene were increased by a factor of 4 over China to create
our lumped toluene, and RETRO emissions of xylene were increased by a factor of 8
over China to create our lumped xylene species. Observations show large abundances
of reactive aromatics over southern and eastern China (Ran et al., 2009; Wang et al.,
2002, 2013; Zhang et al., 2007).
15
Terrestrial biogenic emissions of acetone, acetaldehyde, isoprene, ethanol, terpenes,
and
>
C
2alkenes from metabolism and decay are calculated locally using the Model of
Emissions of Gases and Aerosols from Nature (MEGAN v2.0) (Guenther et al., 2006).
Specific other sources and sinks for acetone and acetaldehyde are described in Fischer
et al. (2012) and Millet et al. (2010) respectively. The atmospheric budget of ethanol is
20also as described by Millet et al. (2010).
New estimates indicate that fires emit significantly more NMVOCs than previously
thought (Wiedinmyer et al., 2011), and there is a large contribution from oxygenated
species, many of which are unidentified (Warneke et al., 2011). Observations show
rapid conversion of NO
xto PAN in fire plumes, seemingly due to the oxidation of
25ACPD
13, 26841–26891, 2013Global peroxyacetyl
nitrate (PAN) budget
E. V. Fischer et al.
Title Page
Abstract Introduction
Conclusions References
Tables Figures
◭ ◮
◭ ◮
Back Close
Full Screen / Esc
Printer-friendly Version
Interactive Discussion
Discussion
P
a
per
|
D
iscussion
P
a
per
|
Discussion
P
a
per
|
Discuss
ion
P
a
per
emission factor for extratropical fires is approximately a factor of three lower, and the
emission factors for the NMVOCs are generally higher. Following Alvarado et al. (2010)
we directly partition 40 % and 20 % NO
xemissions from fires directly to PAN and HNO
3respectively. The Alvarado et al. (2010) partitioning is based on an observation of fresh
boreal fire plumes, but we apply it here to all fire types. To support PA radical
for-5mation on faster timescales we also added GFED3 emissions of several shorter lived
hydrocarbons to the suite of species emitted from fires (terpenes, aromatics) along with
additional oxygenated species (hydroxyacetone, methylgloyxal) as given in Table 1.
The standard version of GEOS-Chem releases all fire emissions in the boundary
layer; however, previous studies have pointed out that a significant fraction of biomass
10burning emissions can be injected to the free troposphere because of buoyancy
(Tur-quety et al., 2007; Val Martin et al., 2010). This is especially important for PAN
be-cause lower temperatures above the boundary layer enhance its stability. Val Martin
et al. (2010) showed that a substantial fraction of plumes from North American fires
are injected into the free troposphere. Smoke plumes over the boreal region reached
15the highest altitudes. Analysis of smoke clouds, which are a later stage of plume
evolu-tion, indicated that
∼
35 % were above the boundary layer. Here we distribute 35 % of
biomass burning emissions by mass in the 10 sigma layers (4 km) above the boundary
layer, and this improves our comparison with PAN observations at high latitudes.
Kaiser et al. (2012) and Yue et al. (personal communication, 2013) find that GFED3
20underestimates fire emissions by not accounting for small fires, particularly at boreal
latitudes. Following their work, we increased wild fire emissions by 60 % in North Asia
(30–75
◦N, 60–190
◦E), 25 % in Canada and 50 % in Alaska. Increasing fire emissions
over Russian and North American boreal regions improves the PAN simulation over the
Arctic, particularly above the surface.
25
2.3
Model configuration
res-ACPD
13, 26841–26891, 2013Global peroxyacetyl
nitrate (PAN) budget
E. V. Fischer et al.
Title Page
Abstract Introduction
Conclusions References
Tables Figures
◭ ◮
◭ ◮
Back Close
Full Screen / Esc
Printer-friendly Version
Interactive Discussion
Discussion
P
a
per
|
D
iscussion
P
a
per
|
Discussion
P
a
per
|
Discuss
ion
P
a
per
|
olution. We degrade the horizontal resolution to 2
◦×
2.5
◦for input into our GEOS-Chem
simulation. We use a 1 yr simulation for 2008, preceded by a 1 yr spin-up to remove
the e
ff
ect of initial conditions. We also present a number of sensitivity simulations
con-ducted at 4
◦×
5
◦horizontal resolution, which yields results very similar to the 2
◦×
2.5
◦resolution. The largest di
ff
erences in the two resolutions occur over regions of biomass
5burning. Over these locations, the finer horizontal resolution produces 10–20 % more
PAN.
Throughout the paper we present results using 2008 GEOS-5 assimilated
meteorol-ogy. However we have compared results using both GEOS-4 and GEOS-5 for 2006,
the last year of overlap for these two meteorological datasets. The lifetime of PAN
dou-10bles for every 4 K decrease in temperature. PAN is also sensitive to biogenic emissions,
lightning NO
xemissions and vertical transport (Labrador et al., 2005), parameters that
also depend on the underlying meteorological field. We found that di
ff
erences in the
monthly mean PAN produced using di
ff
erent assimilated meteorological grids are
sub-stantial in some locations (
<
100 pptv). Higher upper-tropospheric PAN mixing ratios
15over the tropical Pacific in GEOS-5 appear to be driven by slower convective
overturn-ing in GEOS-5 than GEOS-4. GEOS-4 agrees better with data from PEM-Tropics B
(Maloney et al., 2001). The PEM-Tropics B dataset suggests very low (
<
50 pptv) PAN
mixing ratios in the Pacific tropical UT. Di
ff
erences between the simulated and
ob-served O
3profiles for the PEM-Tropics B regions are consistent with the view that
20di
ff
erences in vertical motion are driving the PAN di
ff
erences. There are limited
op-portunities to chemically constrain convective overturning in data assimilation models.
However, existing analyses suggest substantial di
ff
erences between overturning rates
derived from in situ measurements and those in GEOS-4 (Bertram et al., 2007).
Mito-viski et al. (2012) assessed the impact of convection on O
3in GEOS-Chem and found
25ACPD
13, 26841–26891, 2013Global peroxyacetyl
nitrate (PAN) budget
E. V. Fischer et al.
Title Page
Abstract Introduction
Conclusions References
Tables Figures
◭ ◮
◭ ◮
Back Close
Full Screen / Esc
Printer-friendly Version
Interactive Discussion
Discussion
P
a
per
|
D
iscussion
P
a
per
|
Discussion
P
a
per
|
Discuss
ion
P
a
per
3
Global PAN distribution
We used a large database of recent PAN observations from surface sites and airborne
campaigns to evaluate the model, and these are presented in Table 2. For comparison
to the model, we averaged the aircraft observations over the coherent regions in Fig. 1.
The measurements either relied on gas chromatography with electron capture detector
5(GC-ECD) (Flocke et al., 2005) or thermal decomposition chemical ionization mass
spectrometry (TD-CIMS) (Zheng et al., 2011).
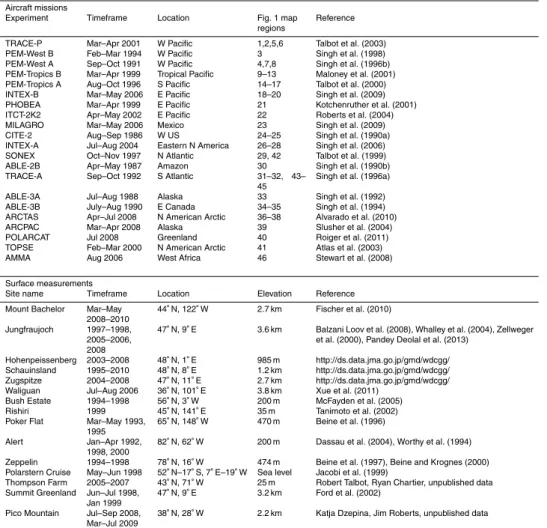
Figures 2 and 3 compare the observed global distribution of PAN to that simulated by
GEOS-Chem. Mean observations from the studies compiled in Table 2 are shown as
filled circles. Model fields are background contours. Full vertical profiles (median and
10mean) for the aircraft campaigns and seasonal cycles for several European mountain
top datasets are in the Supplement. We compare model output from 2008 to
obser-vations collected over many years. Interannual variability in the model is smaller than
other sources of error. There are relatively few in situ observations that can be used to
assess interannual variability in PAN (Bottenheim et al., 1994). Observations at Mount
15Bachelor (Oregon, USA) indicate interannual variability of 20 % during the spring
max-imum (Fischer et al., 2011). Recent trends in PAN in many regions of the atmosphere
are also hard to assess given a paucity of consistent data (Parrish et al., 2004). As
shown later PAN is highly sensitive to NO
xand NMVOC emissions, both of which have
changed considerably in some regions (Pollack et al., 2013).
20
Figure 2 indicates that spring and summer Northern Hemisphere average PAN
abun-dances below 6 km are comparable over polluted continental regions. The Northern
Hemisphere springtime maximum, previously attributed to photochemical production
at a time when PAN has a long thermal lifetime (Penkett and Brice, 1986; Brice et al.,
1988), is primarily a feature of remote air. Long term PAN measurements from the
25ACPD
13, 26841–26891, 2013Global peroxyacetyl
nitrate (PAN) budget
E. V. Fischer et al.
Title Page
Abstract Introduction
Conclusions References
Tables Figures
◭ ◮
◭ ◮
Back Close
Full Screen / Esc
Printer-friendly Version
Interactive Discussion
Discussion
P
a
per
|
D
iscussion
P
a
per
|
Discussion
P
a
per
|
Discuss
ion
P
a
per
|
PAN spring maximum at the Jungfraujoch is mainly attributable to airmasses advected
from the polluted European boundary layer, and PAN formation in the free troposphere
does not play a dominant role. Both the model and surface observations indicate that
the springtime maximum is pronounced over the Arctic, and this has previously been
attributed to transport of northern mid-latitudes pollution (Moxim et al., 1996). We find
5that springtime fires in Russia and China also contribute to this feature, and this is
discussed later in the context of our sensitivity simulations.
Successful simulation of PAN in Asian outflow is contingent on the inclusion of
emis-sions of aromatic species. These account for 30 % of the PAN in that region in the
model. Even with the addition of aromatics, the model is biased low for this region. This
10could suggest missing NMVOC emissions in China, as suggested by Fu et al. (2007) or
unrealistically low PA radical yields from aromatics in the chemical scheme. The model
largely reproduces the average vertical profiles observed during TRACE-P (see
verti-cal profiles in the Supplement, Fig. 1, Panel 1), but these were collected in 2001 and
the model output is for 2008. Chinese NO
xand NMVOCs emissions have increased by
15more than 55 % and 29 % over this period respectively (Zhang, Q. et al., 2007, 2009).
PAN is also sensitive to the parameterization of the uptake of the hydroperoxyl radical
(HO
2) by aerosols. Recent work (Mao et al., 2013a) suggests that the reactive uptake
of HO
2is a much more e
ffi
cient sink of HO
xthan previously thought (Thornton et al.,
2008) and implemented in the version of GEOS-Chem used here. We tested the impact
20of more e
ffi
cient uptake of HO
2by aerosols on PAN by setting the reactive uptake
coe
ffi
cient of HO
2to 1 and eliminating conversion of HO
2to H
2O
2on aerosols. We
found that the faster uptake of HO
2drastically reduced (50 %) springtime PAN over
East Asia. The faster uptake produces springtime PAN outflow in the model that is
inconsistent with observations in that region, and would imply a large missing source
25of PAN.
ACPD
13, 26841–26891, 2013Global peroxyacetyl
nitrate (PAN) budget
E. V. Fischer et al.
Title Page
Abstract Introduction
Conclusions References
Tables Figures
◭ ◮
◭ ◮
Back Close
Full Screen / Esc
Printer-friendly Version
Interactive Discussion
Discussion
P
a
per
|
D
iscussion
P
a
per
|
Discussion
P
a
per
|
Discuss
ion
P
a
per
Jungfraujoch (3580 m) reflect terrain-induced injections of PAN rich boundary layer air
(Zanis et al., 2003, 2007; Zellweger et al., 2000; Carpenter et al., 2000; Pandey Deolal
et al., 2013), and this transport scale is not captured in the model. However, Fig. 3
indicates that the observations are also higher than the model output below the altitude
of the measurements.
5
In Northern Hemisphere summer, both the model and observations show a strong
contrast between high concentrations over source continents and adjacent oceans
(Fig. 3), reflecting the short lifetime of PAN against thermal decomposition. PAN
con-centrations in the model are generally higher aloft, consistent with INTEX-A aircraft
observations over the eastern US (90
◦W–45
◦W, Panel 3, Fig. 3) and measurements
10from the Azores (Val Martin et al., 2008), reflecting the longer PAN lifetime. As we see
in Supplement, Fig. 1, Panels 26 and 27, the INTEX-A observations indicate that PAN
mixing ratios begin to decrease with altitude above 8 km over the northeastern US and
the western Atlantic, but not over the southeastern US where lightning and convection
support PAN production aloft (Hudman et al., 2007).
15
The lowest three panels of Fig. 3 show that outside of winter months, there is a
reser-voir of 200–400 pptv PAN between 5–8 km over northern mid-latitudes. A similar PAN
reservoir aloft has also been observed over the Arctic during aircraft campaigns in
spring and summer (Singh et al., 1994). PAN can be 80–90 % of total NO
yin the cold
arctic atmosphere (Atlas et al., 2003; Ja
ff
e et al., 1997; Bottenheim et al., 1986). Liang
20et al. (2011) note that the 2008 ARCTAS PAN observations are not notably di
ff
erent
from either the 1988 ABLE or 2000 TOPSE observations, despite dramatic changes to
NO
xemissions in the major anthropogenic source regions. In the upper troposphere,
Northern Hemisphere PAN mixing ratios peak in summer, with contributions from
an-thropogenic sources, biomass burning and lightning. This summertime upper
tropo-25ACPD
13, 26841–26891, 2013Global peroxyacetyl
nitrate (PAN) budget
E. V. Fischer et al.
Title Page
Abstract Introduction
Conclusions References
Tables Figures
◭ ◮
◭ ◮
Back Close
Full Screen / Esc
Printer-friendly Version
Interactive Discussion
Discussion
P
a
per
|
D
iscussion
P
a
per
|
Discussion
P
a
per
|
Discuss
ion
P
a
per
|
The Polarstern Cruise data from Germany to South Africa in summer reveals a sharp
meridional gradient with mixing ratios dropping below the detection limit (25 pptv)
out-side northern mid-latitudes (Fig. 2) (Jacobi et al., 1999). The meridional gradient is
much less defined in the free troposphere, reflecting biogenic and fire contributions in
the southern tropics with e
ffi
cient convective lofting (Fig. 2).
5
We see from Fig. 2 that the Southern Hemisphere features a spring PAN maximum in
the upper troposphere, similar to the remote northern extra-tropics. Moore and
Reme-dios (2010) observed a spring PAN maximum in the upper troposphere at 0–35
◦S from
MIPAS retrievals and attributed it to seasonal biomass burning over Central Africa.
Moxim et al. (1999) also simulated the Southern Hemisphere springtime free
tropo-10spheric PAN maximum, but suggested that it is driven by convective transport rapidly
mixing PAN upward from continental surface production regions. As discussed below,
our model suggests that much of the PAN in the austral free troposphere is due to
continental convective injection of biogenic NMVOCs together with the lightning NO
xsource.
15
4
Contributions of di
ff
erent NMVOCs to PAN formation
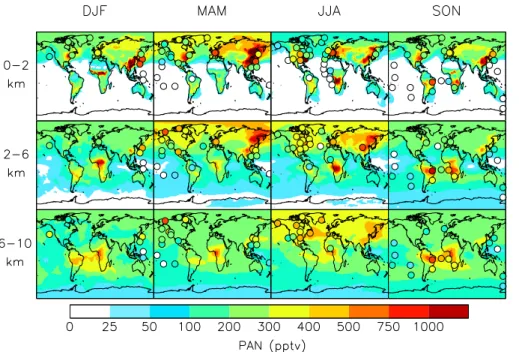
PAN depends on NMVOCs and NO
xin nonlinear ways. To diagnose this dependence
and identify the most critical precursor, we conducted two sensitivity studies where NO
xand NMVOC emissions were separately reduced by 20 % across all sectors. The
re-sults are presented in Fig. 4. We see that PAN concentration depends in general more
20strongly on NMVOC than NO
xemissions. Exceptions are fire-dominated regions at
northern high latitudes, reflecting the very low NO
x/
NMVOCs emission ratio from fires.
This result is also partially an artifact of partitioning 40 % of GFED fire NO
xemissions
directly to PAN. A remarkable result is that PAN responds supra-linearly to NMVOC
emissions in many locations, with the strongest e
ff
ect over the North Pacific in spring
25ACPD
13, 26841–26891, 2013Global peroxyacetyl
nitrate (PAN) budget
E. V. Fischer et al.
Title Page
Abstract Introduction
Conclusions References
Tables Figures
◭ ◮
◭ ◮
Back Close
Full Screen / Esc
Printer-friendly Version
Interactive Discussion
Discussion
P
a
per
|
D
iscussion
P
a
per
|
Discussion
P
a
per
|
Discuss
ion
P
a
per
in O
3, in turn decreasing the [NO
2]/[NO] ratio and thus reducing the e
ff
ective lifetime
of PAN. This chemical feedback amplifies the sensitivity of PAN to NMVOC emission
changes. Another chemical feedback in source regions is that reducing NMVOC
emis-sions increases the concentration of OH and hence the conversion of NO
xto nitric
acid.
5
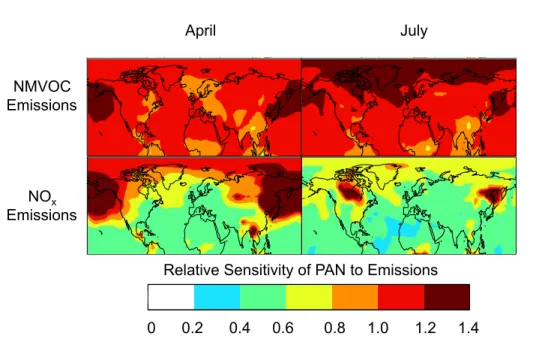
In order to understand the contributions of di
ff
erent NMVOC precursors to PAN
for-mation, we conducted 14 sensitivity simulations where the emissions of each precursor
in the leftmost column of Table 1 were turned o
ff
individually. The change in the total
burden of PAN was compared to a standard simulation with all emissions switched on.
In the case of isoprene where the e
ff
ect is large, we reduced emissions by 20 % (and
10multiplied the change by 5) in order to minimize non-linear e
ff
ects. Figure 5 presents
a schematic of the relative contributions of individual NMVOCs to global PAN formation
through the major carbonyl species (acetaldehyde, acetone, methylglyoxal) serving as
precursors of PAN (Reactions R2–R4). The absolute contributions are in Table 1.
An-thropogenic, biogenic and biomass burning emissions make significant contributions
15to all three of the most important immediate PAN precursors (acetaldehyde, acetone,
and methylglyoxal). We track PA radical formation via four di
ff
erent chemical pathways,
from acetaldehyde, acetone, methylglyoxal and via all other intermediate species. The
bottom pie chart in Fig. 5 summarizes the relative importance of these four pathways
for global annual total PA radical production.
20
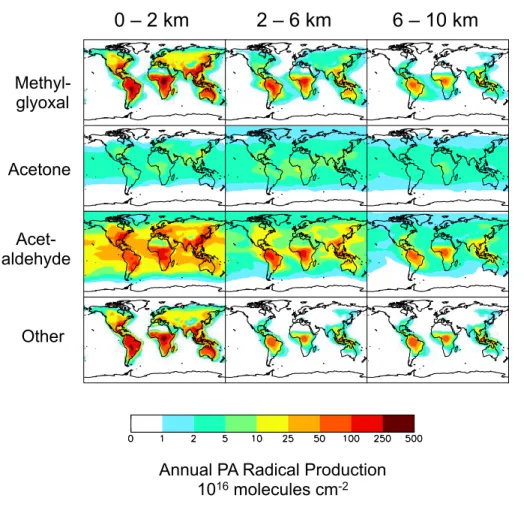
Figure 6 summarizes the geographical distribution of annual total PA radical
produc-tion for the lower, mid- and upper troposphere. PA producproduc-tion is strongest in NMVOC
source regions, propagating to the free troposphere in the tropics through deep
con-vection. The patterns in Fig. 6 reflect the dominant sources and lifetime for each PA
radical precursor: mean lifetimes 1–2 h for methylglyoxal, 0.8 days for acetaldehyde
25rad-ACPD
13, 26841–26891, 2013Global peroxyacetyl
nitrate (PAN) budget
E. V. Fischer et al.
Title Page
Abstract Introduction
Conclusions References
Tables Figures
◭ ◮
◭ ◮
Back Close
Full Screen / Esc
Printer-friendly Version
Interactive Discussion
Discussion
P
a
per
|
D
iscussion
P
a
per
|
Discussion
P
a
per
|
Discuss
ion
P
a
per
|
ical formation predominantly via photolysis. We traced PA radical formation via these
species together with all other intermediates.
Figures 5 and 6 reveal that acetaldehyde is the most important PA radical precursor
globally, responsible for
∼
40 % of total PA radical production at all altitudes.
Photo-chemical production is the dominant source of acetaldehyde, with large contributions
5from both biogenic and anthropogenic primary emissions (Fig. 5). There is also PA
pro-duction from acetaldehyde in the marine boundary layer, partially reflecting the ocean
acetaldehyde source (Millet et al., 2010). The alkanes,
>
C
2alkenes and ethanol all
have high molar yields for acetaldehyde (Table 1). Though most originate over
conti-nents, the lifetimes of the primary precursors of acetaldehyde range from hours
(iso-10prene) to months (ethane). Thus there is significant production of the PA radical from
acetaldehyde at all altitudes over both continental regions and the downwind oceans
(Millet et al., 2010).
Based on global simulations with and without acetone, Singh et al. (1995) estimated
that up to 50 % of observed PAN in the mid-upper troposphere could be formed from
15acetone. However, they assumed a photolysis rate for acetone now known to be too
high. Using a similar approach and the acetone budget from Fischer et al. (2012), we
find that that the contribution of acetone to PAN is 25 % in the upper troposphere over
the Northern Hemisphere during summer and less under other conditions. Acetone is
the most important PA precursor only in the most remote regions of the upper
tropo-20sphere.
Isoprene and monoterpenes are also important precursors for PAN formation through
methylgyoxal and other intermediates. Due to relatively short lifetimes, their role is
largest in continental boundary layers (Fig. 6). von Kuhlmann et al. (2004) showed that
PAN formation in models is highly sensitive to the treatment of isoprene chemistry, and
25ACPD
13, 26841–26891, 2013Global peroxyacetyl
nitrate (PAN) budget
E. V. Fischer et al.
Title Page
Abstract Introduction
Conclusions References
Tables Figures
◭ ◮
◭ ◮
Back Close
Full Screen / Esc
Printer-friendly Version
Interactive Discussion
Discussion
P
a
per
|
D
iscussion
P
a
per
|
Discussion
P
a
per
|
Discuss
ion
P
a
per
formation (Galloway et al., 2011). Implementation of the Paulot et al. (2009a, b)
oxida-tion scheme in GEOS-Chem improves the simulaoxida-tion of summertime observaoxida-tions over
the southeastern US (Mao et al., 2013b). It also substantially increases surface PAN
mixing ratios over the Amazon and Central Africa, where there is very little
observa-tional data (Angelo, 2012). In these regions surface PAN increases by 100–300 pptv
5with the Paulot et al. (2009a, b) scheme, but the impact is more modest above the
boundary layer, generally less than 50 pptv. In the model, most of the free tropospheric
PAN in convective regions is produced above the boundary layer.
5
Contributions from di
ff
erent source types to PAN formation
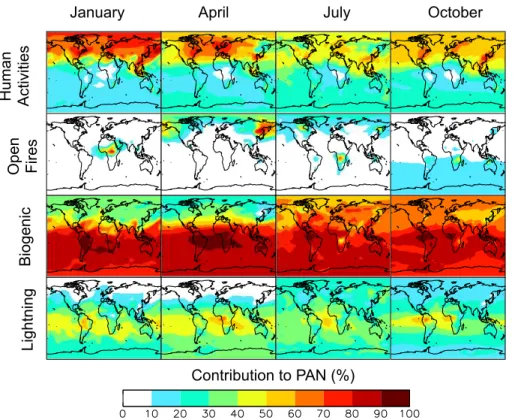
Figure 7 presents the sensitivity of PAN concentrations to di
ff
erent emission types, as
10diagnosed by the relative decrease in a sensitivity simulation with that emission type
shut o
ff
. Contributions do not add up to 100 % because of non-linearity.
During Northern Hemisphere spring, shutting o
ff
anthropogenic emissions
de-creases the integrated PAN burden by
∼
50 %. Alkanes are the most important class of
anthropogenic NMVOC precursors for PAN in northern mid-latitudes. Their role is more
15important in spring when NMVOC emissions from the biosphere are smaller. In spring,
the time of the surface PAN maximum, biogenic and anthropogenic NMVOCs species
each support
∼
50 % of the PAN burden.
Though most biomass burning occurs primarily in the tropics, the e
ff
ect of fires on
PAN appears to be largest at northern latitudes. Shutting o
ff
emissions from springtime
20fires located in Russia and China decreases the hemispheric burden by
∼
25 %, but
the decrease in PAN mixing ratios is 30–40 % at high latitudes. These springtime fires,
which exhibit strong variability in magnitude and location, contribute to the observed
spring PAN maximum. Russian fires likely accentuated this feature in April 2008, an
unusually strong fire season (Vivchar, 2010; Warneke et al., 2009, 2010). PAN in fire
25ACPD
13, 26841–26891, 2013Global peroxyacetyl
nitrate (PAN) budget
E. V. Fischer et al.
Title Page
Abstract Introduction
Conclusions References
Tables Figures
◭ ◮
◭ ◮
Back Close
Full Screen / Esc
Printer-friendly Version
Interactive Discussion
Discussion
P
a
per
|
D
iscussion
P
a
per
|
Discussion
P
a
per
|
Discuss
ion
P
a
per
|
up to 20 ppbv were observed during this time from Alaska to California (Oltmans et al.,
2010). Spring 2008 was an extreme burning year, but Macdonald et al. (2011) also
attribute elevated monthly mean O
3concentrations at Whistler Mountain, BC in fall
2002 and spring 2003 to fires in the Russian Federation.
As stated earlier, the treatment of PAN formation in fires plays an important role
5in determining the global impact of this PAN source. Past model studies have found
that reproducing observed free tropospheric CO and O
3downwind from boreal fires
requires injecting a fraction of the emissions above the boundary layer (Leung et al.,
2007; Turquety et al., 2007; Generoso et al., 2007; Colarco et al., 2004). Tereszchuk
et al. (2013) show that PAN in the upper troposphere at high latitudes is mainly from
10large boreal fires in summer. Emitting a fraction of the smoke above the boundary
layer is an important model update that improves the simulation of the 2–6 km PAN
reservoir at high latitudes. The fraction of NO
xin the springtime Russian fires that
is immediately partitioned to PAN also has a large impact on springtime PAN over
high latitudes because PAN has a long lifetime during this season. The combination of
15model updates chosen here best reproduces the evolution of the springtime PAN profile
as observed during TOPSE (Wang et al., 2003). Specifically, PAN remains relatively
constant (150–200 pptv) with altitude in February and March, and the 2–6 km PAN
reservoir forms in April. Springtime PAN in the model is acutely sensitive to the amount
of NO
xthat is immediately partitioned to PAN in fires. Given that O
3production in the
20Arctic lower troposphere is sensitive to the abundance of PAN (Walker et al., 2012;
Beine et al., 1997), more work is warranted to determine the best way to incorporate
the chemistry that rapidly produces PAN in fires.
We find that biogenic species drive PAN production in summer and fall. From June
to October, shutting o
ff
biogenic emissions decreases the Northern Hemisphere
inte-25iso-ACPD
13, 26841–26891, 2013Global peroxyacetyl
nitrate (PAN) budget
E. V. Fischer et al.
Title Page
Abstract Introduction
Conclusions References
Tables Figures
◭ ◮
◭ ◮
Back Close
Full Screen / Esc
Printer-friendly Version
Interactive Discussion
Discussion
P
a
per
|
D
iscussion
P
a
per
|
Discussion
P
a
per
|
Discuss
ion
P
a
per
prene contribution to PAN formation is 1.6 to 4 times larger than the anthropogenic
NMVOC contribution in the northeastern US in summer.
The austral spring mid-to-upper tropospheric PAN maximum (
>
400 pptv) spanning
the Atlantic (Fig. 2) is also apparent in MIPAS PAN retrievals (Glatthor et al., 2007;
Moore and Remedios, 2010; Wiegele et al., 2012). Figure 7 shows that this feature is
5more sensitive to emissions of NO
xfrom lightning than emissions from either biomass
burning or anthropogenic sources. Biomass burning takes place from July to October
in the part of Africa located in the Southern Hemisphere. Singh et al. (1996a) found
that PAN correlated with tracers of biomass combustion in the eastern South Atlantic
in the lower and middle troposphere, but not in the upper troposphere. To explain
ob-10served NO
xat higher altitudes, they had to invoke a large contribution from lightning
(Smyth et al., 1996). Our simulation reproduces the TRACE-A vertical PAN profiles for
the South Atlantic (This sentence refers to Supplement, Fig. 1, Panels 43–45.) and the
correlation between PAN and CO (not shown). We find that fires are responsible for
ap-proximately 30 % of the PAN over the tropical Atlantic between 2 and 4 km. Above 6 km,
15the contribution from fires is small. In the upper troposphere, the oxidation of biogenic
NMVOCs (lifted by convection; Murphy et al., 2010; Bechara et al., 2010; Warneke
et al., 2001) in the presence of lightning NO
xis a large source of PAN (Tie et al., 2001;
Labrador et al., 2005). Compared to the previous version of GEOS-Chem, the
sensitiv-ity of upper tropospheric PAN to lightning is reduced by 30 %. We attribute this change
20to increased OH in the boundary layer through the use of the Paulot et al. (2009a,
b) isoprene scheme, that reduces the amount of NMVOC injected into the free
tro-posphere (Paulot et al., 2012). Boundary layer and upper tropospheric chemistry in
the tropics are tightly coupled (Paulot et al., 2012). Hence the simulation of upper
tro-pospheric PAN is sensitive to the representation of boundary layer chemistry, which
25ACPD
13, 26841–26891, 2013Global peroxyacetyl
nitrate (PAN) budget
E. V. Fischer et al.
Title Page
Abstract Introduction
Conclusions References
Tables Figures
◭ ◮
◭ ◮
Back Close
Full Screen / Esc
Printer-friendly Version
Interactive Discussion
Discussion
P
a
per
|
D
iscussion
P
a
per
|
Discussion
P
a
per
|
Discuss
ion
P
a
per
|
6
Conclusions
We utilized a worldwide collection of observations to improve a global simulation of PAN
in the GEOS-Chem model. This new simulation, which includes an improved
represen-tation of numerous NMVOCs and a di
ff
erent treatment of biomass burning emissions,
a
ff
ords the opportunity to understand the factors driving the PAN distribution on the
5global scale.
1. We find that PAN is generally more sensitive to NMVOC emissions than NO
xemis-sions. In many regions of the atmosphere, changes to NMVOC emissions produce
a supra-linear change in PAN through feedbacks to remote NO
xand O
3budgets. A
dif-ferent mixture of NMVOCs supports PAN formation in each region and season.
Con-10siderable improvement of the PAN simulation for the Asian outflow region is achieved
by including aromatics. Our results stress the need for global CTMs, which can yield
di
ff
erent results for PAN (Singh et al., 2007), to include and evaluate budgets for many
NMVOCs that are routinely ignored.
2. In order to reproduce the observed PAN reservoir at 3–6 km over high northern
lat-15itudes, we have changed the way emissions from fires are incorporated into the model.
We increased the simulated PAN reservoir over high latitudes by (1) adding biomass
burning emissions of shorter lived NMVOCs (monoterpenes, aromatics), (2) emitting
a fraction of the biomass burning NO
xdirectly as PAN (Alvarado et al., 2010), (3)
emit-ting a portion of the smoke above the boundary layer, (4) updaemit-ting the emission factors
20for NMVOCs and NO
x(Akagi et al., 2011), and increasing emissions to account for
undetected small fires at high latitudes (Kaiser et al., 2012). We find that PAN over
the Arctic is very sensitive to fires, and particularly sensitive to the amount of NO
xthat
is immediately partitioned to PAN in fires and to the altitude of the emissions. Given
that O
3production in the Arctic lower troposphere is very sensitive to NO
xabundance
25ACPD
13, 26841–26891, 2013Global peroxyacetyl
nitrate (PAN) budget
E. V. Fischer et al.
Title Page
Abstract Introduction
Conclusions References
Tables Figures
◭ ◮
◭ ◮
Back Close
Full Screen / Esc
Printer-friendly Version
Interactive Discussion
Discussion
P
a
per
|
D
iscussion
P
a
per
|
Discussion
P
a
per
|
Discuss
ion
P
a
per
3. The principal carbonyl precursors of PAN are acetaldehyde (44 % of the global
source), methylglyoxal (30 %) and acetone (7 %). Acetaldehyde is produced by a large
suite of NMVOCs and also directly emitted. Methylglyoxal is mostly from isoprene.
Iso-prene oxidation products, other than methylglyoxal, are also significant. With updated
(lower) photolysis yields, acetone is a substantially less important pathway for PAN
5formation than previously thought (Singh et al., 1995).
4. Isoprene accounts for 37 % of the global PAN burden. Many other NMVOC
emis-sions contribute to the balance, with no single species contributing more than 10 %
(Table 1). At Northern Hemisphere mid-latitudes, alkanes contribute to a third of PAN
formation during the springtime maximum.
10
5. A springtime upper troposphere PAN maximum across the tropical Atlantic is the
major feature of the Southern Hemisphere PAN distribution. Lightning is the most
im-portant NO
xsource for PAN formation in this region of the atmosphere. A cascade of
isoprene oxidation products, delivered to the upper troposphere by deep convection,
provides the PA radical source. This finding is sensitive to the description of boundary
15layer chemistry under low NO
xconditions.
The work presented here has increased confidence in our ability to simulate the
observed distribution of PAN within the GEOS-Chem CTM. In a follow-up paper we
will examine the importance of PAN in a
ff
ecting global tropospheric O
3and OH, and
the implications for intercontinental transport of pollution, the oxidizing power of the
20atmosphere, and climate forcing.
Supplementary material related to this article is available online at
http://www.atmos-chem-phys-discuss.net/13/26841/2013/
acpd-13-26841-2013-supplement.pdf.
Acknowledgements. This work was supported by the NASA Atmospheric Composition
Mod-25
ACPD
13, 26841–26891, 2013Global peroxyacetyl
nitrate (PAN) budget
E. V. Fischer et al.
Title Page
Abstract Introduction
Conclusions References
Tables Figures
◭ ◮
◭ ◮
Back Close
Full Screen / Esc
Printer-friendly Version
Interactive Discussion
Discussion
P
a
per
|
D
iscussion
P
a
per
|
Discussion
P
a
per
|
Discuss
ion
P
a
per
|
and Global Change Postdoctoral Fellowship Program, administered by UCAR, and by a Har-vard University Center for the Environment Postdoctoral Fellowship. The contribution of PAN data from the GAW Global Station Hohenbeissenberg by Stefan Gilge, German Meteorological Service, is greatly acknowledged. The contribution of PAN data from the Jungfraujoch Moun-tain Site by Christoph Zellweger (EMPA) is greatly acknowledged. We thank Hiroshi Tanimoto
5
for providing the data from Rishiri, Japan. Pico PAN data were collected under the leadership of Richard Honrath with funding from the National Science Foundation grant ATM-0720955. Funding for the analysis of the Pico PAN measurements by Katja Dzepina and Lynn Mazzoleni was provided by the National Science Foundation through grant AGS-1110059. We also ap-preciate the contribution of unpublished PAN data from the Thompson Farm AIRMAP Site by
10
Ryan Chartier. Finally, we thank Martin Steinbacher and Jim Roberts for helpful comments on the manuscript.
References
Akagi, S. K., Yokelson, R. J., Wiedinmyer, C., Alvarado, M. J., Reid, J. S., Karl, T., Crounse, J. D., and Wennberg, P. O.: Emission factors for open and domestic biomass burning for use in
15
atmospheric models, Atmos. Chem. Phys., 11, 4039–4072, doi:10.5194/acp-11-4039-2011, 2011.
Alvarado, M. J., Logan, J. A., Mao, J., Apel, E., Riemer, D., Blake, D., Cohen, R. C., Min, K.-E., Perring, A. E., Browne, E. C., Wooldridge, P. J., Diskin, G. S., Sachse, G. W., Fuelberg, H., Sessions, W. R., Harrigan, D. L., Huey, G., Liao, J., Case-Hanks, A., Jimenez, J. L.,
Cu-20
bison, M. J., Vay, S. A., Weinheimer, A. J., Knapp, D. J., Montzka, D. D., Flocke, F. M., Pol-lack, I. B., Wennberg, P. O., Kurten, A., Crounse, J., Clair, J. M. St., Wisthaler, A., Mikoviny, T., Yantosca, R. M., Carouge, C. C., and Le Sager, P.: Nitrogen oxides and PAN in plumes from boreal fires during ARCTAS-B and their impact on ozone: an integrated analysis of aircraft and satellite observations, Atmos. Chem. Phys., 10, 9739–9760,
doi:10.5194/acp-10-9739-25
2010, 2010.
ACPD
13, 26841–26891, 2013Global peroxyacetyl
nitrate (PAN) budget
E. V. Fischer et al.
Title Page
Abstract Introduction
Conclusions References
Tables Figures
◭ ◮
◭ ◮
Back Close
Full Screen / Esc
Printer-friendly Version
Interactive Discussion
Discussion
P
a
per
|
D
iscussion
P
a
per
|
Discussion
P
a
per
|
Discuss
ion
P
a
per
Atlas, E. L., Ridley, B. A., and Cantrell, C. A.: The Tropospheric Ozone Production about the Spring Equinox (TOPSE) experiment: introduction, J. Geophys. Res., 108, 8353, doi:10.1029/2002jd003172, 2003.
Balzani Loov, J. M., Henne, S., Legreid, G., Staehelin, J., Reimann, S., Prevut, A. S. H., Steinbacher, M., and Vollmer, M. K.: Estimation of background concentrations of trace
5
gases at the Swiss Alpine site Jungfraujoch (3580 m a.s.l.), J. Geophys. Res., 113, D22305, doi:10.1029/2007jd009751, 2008.
Barletta, B., Meinardi, S., Simpson, I. J., Sherwood Rowland, F., Chan, C.-Y., Wang, X., Zou, S., Chan, L. Y., and Blake, D. R.: Ambient halocarbon mixing ratios in 45 Chinese cities, Atmos. Environ., 40, 7706–7719, doi:10.1016/j.atmosenv.2006.08.039, 2006.
10
Bechara, J., Borbon, A., Jambert, C., Colomb, A., and Perros, P. E.: Evidence of the impact of deep convection on reactive Volatile Organic Compounds in the upper tropical tropo-sphere during the AMMA experiment in West Africa, Atmos. Chem. Phys., 10, 10321–10334, doi:10.5194/acp-10-10321-2010, 2010.
Beine, H. J. and Krognes, T.: The seasonal cycle of peroxyacetyl nitrate (PAN) in the European
15
Arctic, Atmos. Environ., 34, 933–940, doi:10.1016/s1352-2310(99)00288-5, 2000.
Beine, H. J., Jaffe, D. A., Blake, D. R., Atlas, E., and Harris, J.: Measurements of PAN, alkyl nitrates, ozone, and hydrocarbons during spring in interior Alaska, J. Geophys. Res., 101, 12613–12619, doi:10.1029/96jd00342, 1996.
Beine, H., Jaffe, D., Herring, J., Kelley, J., Krognes, T., and Stordal, F.: High-latitude springtime
20
photochemistry. Part I: NOx, PAN and ozone relationships, J. Atmos. Chem., 27, 127–153, doi:10.1023/a:1005869900567, 1997.
Bertram, T. H., Perring, A. E., Wooldridge, P. J., Crounse, J. D., Kwan, A. J., Wennberg, P. O., Scheuer, E., Dibb, J., Avery, M., Sachse, G., Vay, S. A., Crawford, J. H., McNaughton, C. S., Clarke, A., Pickering, K. E., Fuelberg, H., Huey, G., Blake, D. R., Singh, H. B.,
25
Hall, S. R., Shetter, R. E., Fried, A., Heikes, B. G., and Cohen, R. C.: Direct mea-surements of the convective recycling of the upper troposphere, Science, 315, 816–820, doi:10.1126/science.1134548, 2007.
Bertram, T. H., Perring, A. E., Wooldridge, P. J., Dibb, J., Avery, M. A., and Cohen, R. C.: On the export of reactive nitrogen from Asia: NOx partitioning and effects on ozone, Atmos. Chem.
30
Phys., 13, 4617–4630, doi:10.5194/acp-13-4617-2013, 2013.
assimi-ACPD
13, 26841–26891, 2013Global peroxyacetyl
nitrate (PAN) budget
E. V. Fischer et al.
Title Page
Abstract Introduction
Conclusions References
Tables Figures
◭ ◮
◭ ◮
Back Close
Full Screen / Esc
Printer-friendly Version
Interactive Discussion
Discussion
P
a
per
|
D
iscussion
P
a
per
|
Discussion
P
a
per
|
Discuss
ion
P
a
per
|
lated meteorology: model description and evaluation, J. Geophys. Res., 106, 23073–23095, doi:10.1029/2001jd000807, 2001.
Bottenheim, J. W., Gallant, A. G., and Brice, K. A.: Measurements of NOY species and O3 at 82◦N latitude, Geophys. Res. Lett, 13, 113–116, doi:10.1029/GL013i002p00113, 1986.
Bottenheim, J. W., Sirois, A., Brice, K. A., and Gallant, A. J.: Five years of continuous
observa-5
tions of PAN and ozone at a rural location in eastern Canada, J. Geophys. Res., 99, 5333– 5352, doi:10.1029/93jd02716, 1994.
Brice, K. A., Bottenheim, J. W., Anlauf, K. G., and Wiebe, H. A.: Long-term measure-ments of atmospheric peroxyacetylnitrate (PAN) at rural sites in Ontario and Nova Scotia; seasonal variations and long-range transport, Tellus B, 40, 408–425.
doi10.1111/j.1600-10
0889.1988.tb00113.x, 1988.
Bridier, I., Caralp, F., Loirat, H., Lesclaux, R., Veyret, B., Becker, K. H., Reimer, A., and Zabel, F.: Kinetic and theoretical studies of the reactions of acetylperoxy+nitrogen diox-ide+M⇆acetyl peroxynitrate+M between 248 and 393 K and between 30 and 760 torr, J. Phys. Chem., 95, 3594–3600, doi:10.1021/j100162a031, 1991.
15
Carpenter, L. J., Green, T. J., Mills, G. P., Bauguitte, S., Penkett, S. A., Zanis, P., Schuep-bach, E., Schmidbauer, N., Monks, P. S., and Zellweger, C.: Oxidized nitrogen and ozone production efficiencies in the springtime free troposphere over the Alps, J. Geophys. Res., 105, 14547–14559, doi:10.1029/2000jd900002, 2000.
Colarco, P. R., Schoeberl, M. R., Doddridge, B. G., Marufu, L. T., Torres, O., and
Wel-20
ton, E. J.: Transport of smoke from Canadian forest fires to the surface near Washing-ton, D. C.: injection height, entrainment, and optical properties, J. Geophys. Res., 109, D06203, doi:10.1029/2003jd004248, 2004.
Dassau, T. M., Shepson, P. B., Bottenheim, J. W., and Ford, K. M.: Peroxyacetyl nitrate photochemistry and interactions with the Arctic surface, J. Geophys. Res., 109, D18302,
25
doi:10.1029/2004jd004562, 2004.
Fischer, E. V., Jaffe, D. A., Reidmiller, D. R., and Jaegle, L.: Meteorological controls on observed peroxyacetyl nitrate at Mount Bachelor during the spring of 2008, J. Geophys. Res., 115, D03302, doi:10.1029/2009jd012776, 2010.
Fischer, E. V., Jaffe, D. A., and Weatherhead, E. C.: Free tropospheric peroxyacetyl nitrate
30