www.atmos-chem-phys.net/15/1289/2015/ doi:10.5194/acp-15-1289-2015
© Author(s) 2015. CC Attribution 3.0 License.
Evidence for an unidentified non-photochemical ground-level source
of formaldehyde in the Po Valley with potential implications for
ozone production
J. Kaiser1, G. M. Wolfe1,*,**, B. Bohn2, S. Broch2, H. Fuchs2, L. N. Ganzeveld3, S. Gomm2, R. Häseler2,
A. Hofzumahaus2, F. Holland2, J. Jäger2, X. Li2, I. Lohse2, K. Lu2,***, A. S. H. Prévôt4, F. Rohrer2, R. Wegener2, R. Wolf4, T. F. Mentel2, A. Kiendler-Scharr2, A. Wahner2, and F. N. Keutsch1
1Chemistry, University of Wisconsin-Madison, Madison, WI, USA
2Institut für Energie- und Klimaforschung Troposphäre IEK-8, Forschungszentrum Jülich GmbH, Jülich, Germany 3Earth System Science and Climate Change, Wageningen University and Research Center, Wageningen, Netherlands 4Laboratory of Atmospheric Chemistry, Paul Scherrer Institute, Villigen, Switzerland
*now at: Joint Center for Earth Systems Technology, University of Maryland Baltimore County, Baltimore, MD, USA **now at: Atmospheric Chemistry and Dynamics Laboratory, NASA Goddard Space Flight Center, Greenbelt, MD, USA ***now at: College of Environmental Sciences & Engineering, Peking University, Beijing, China
Correspondence to:F. N. Keutsch ([email protected])
Received: 18 July 2014 – Published in Atmos. Chem. Phys. Discuss.: 1 October 2014 Revised: 19 December 2014 – Accepted: 12 January 2015 – Published: 6 February 2015
Abstract.Ozone concentrations in the Po Valley of northern Italy often exceed international regulations. As both a source of radicals and an intermediate in the oxidation of most volatile organic compounds (VOCs), formaldehyde (HCHO) is a useful tracer for the oxidative processing of hydrocarbons that leads to ozone production. We investigate the sources of HCHO in the Po Valley using vertical profile measurements acquired from the airship Zeppelin NT over an agricultural region during the PEGASOS 2012 campaign. Using a 1-D model, the total VOC oxidation rate is examined and dis-cussed in the context of formaldehyde and ozone production in the early morning. While model and measurement discrep-ancies in OH reactivity are small (on average 3.4±13 %), HCHO concentrations are underestimated by as much as 1.5 ppb (45 %) in the convective mixed layer. A similar un-derestimate in HCHO was seen in the 2002–2003 FORMAT Po Valley measurements, though the additional source of HCHO was not identified. Oxidation of unmeasured VOC precursors cannot explain the missing HCHO source, as mea-sured OH reactivity is explained by meamea-sured VOCs and their calculated oxidation products. We conclude that local direct emissions from agricultural land are the most likely source of missing HCHO. Model calculations demonstrate that
rad-icals from degradation of this non-photochemical HCHO source increase model ozone production rates by as much as 0.6 ppb h−1(12 %) before noon.
1 Introduction
Stagnant air masses, abundant solar radiation, and high an-thropogenic emissions make northern Italy’s Po Valley one of Europe’s most polluted regions. Previous measurements have shown that the regional O3background can reach as high as
90 ppb (Liu et al., 2007). Photochemical ozone production is tied to the reactions of NOx(NO+NO2), HOx(OH+HO2),
and volatile organic compounds (VOCs). In the troposphere, NO2 photodissociates to form oxygen atoms (Reaction 1),
which then react with molecular oxygen to generate O3
(Re-action 2). The partitioning of NOx between NO and NO2
determines the production rate of O3. The hydroxyl-radical
(OH) initiated oxidation of VOCs creates peroxy radicals (XO2= HO2+RO2) (Reaction 3). These radicals shift the
partitioning of NOxradicals towards NO2(Reaction 4), thus
1290 J. Kaiser et al.: An unidentified non-photochemical ground-level source of formaldehyde in the Po Valley
NO2+hν→NO+O (R1)
O+O2→O3 (R2)
OH+VOC→nXO2+oxidized VOC (R3)
NO+XO2→NO2+XO (R4)
In this analysis, we define the net ozone production rate (P(O3)) as the calculated difference between the NO2
photol-ysis rate (Reaction 1) and the rate of NO to NO2conversion
by O3.
While measuring all VOCs and their oxidation products is non-trivial, formaldehyde (HCHO) is formed in the oxi-dation of nearly every VOC and thus provides a downstream constraint on this chemistry. In addition, photolysis of HCHO constitutes an important source of HO2radicals without
con-suming OH, effectively accelerating O3production via
Re-action (4), followed by reRe-actions (1) and (2).
In 2002–2003, the FORMAT (FORMaldehyde as A Tracer of oxidation in the troposphere) campaign aimed to use HCHO to trace the effect of VOC oxidation on ozone pro-duction in the Po Valley. Though modeling efforts focused primarily on the Milan urban plume, an agricultural region upwind of the city was also investigated in the 2003 FOR-MAT study (Liu et al., 2007). There, HCHO mixing ratios were up to 2 times higher than those predicted by regional chemistry transport models. Primary emissions were esti-mated to be a minor source of HCHO in the agricultural region (∼10 %), and OH-initiated oxidation of underrepre-sented local biogenic or anthropogenic VOC emissions was cited as the likely cause of underpredicted HCHO. Because the morning increase in HCHO was not well represented, and because the regional background was not well understood, the effect of anthropogenic emissions on the diurnal cycle un-der polluted conditions could not be reproduced by the model (Junkermann, 2009).
While HCHO measurements provide a product-based view of VOC oxidation, direct measurements of OH reac-tivity, the inverse lifetime of OH, can provide further insight into the instantaneous VOC oxidation rate. OH reactivity is calculated as
OH reactivity(s−1)=X
i
kXi+OH[Xi], (1)
wherekXi+OHare the rate coefficients for the reaction of all species X with OH. Field measurements of OH reactivity have been available since 2001, and Edwards et al. (2013) and Lou et al. (2010) provide summaries of recent compar-isons of modeled and measured reactivity in a variety of en-vironments. Notably, measurements in Paris demonstrated
that more than half of the measured reactivity in highly aged continental air masses could not be explained by available measurements (Dolgorouky et al., 2012). The authors con-cluded that the missing OH sink was likely (multi)oxidized compounds from processed anthropogenic emissions. Pre-vious work has examined the effect of discrepancies be-tween modeled and measured OH reactivity on calculated O3 production potentials (Sadanaga et al., 2005; Yoshino
et al., 2012). In one study in Tokyo, including unmeasured VOC precursors indicated by OH reactivity, measurements increased the calculated ozone production potential by as much as 8 ppb h−1(55 %) (Yoshino et al., 2012).
Measurements of OH reactivity provide an upper bound on total VOC oxidation and, in conjunction with measurements of OH concentration, the total RO2 production rate.
Simi-larly, as HCHO is a major source of HO2, measurements of
HCHO place a lower bound on calculated HO2production
rates. Correcting for any missing OH reactivity or missing HCHO can increase model XO2production rates, in turn
in-creasing P(O3).
Here, we provide an analysis of HCHO, OH reactivity, and O3 production using an extensive set of measurements
ac-quired onboard a Zeppelin airship during the Pan-European Gas-AeroSOls Climate Interaction Study (PEGASOS) in the Po Valley region. Through the Zeppelin’s slow flight speed, highly spatially and temporally resolved trace gas measure-ments were acquired (Li et al., 2014). The Zeppelin’s unique flight abilities enabled vertical profiling flight tracks from as low as 50 m up to an altitude of∼750 m, making possible assessment of the role of exchange between the nocturnal boundary layer, residual layer, and growing mixed layer. In this study, we focus the analysis on one flight for which a clear delineation between those layers occurred (Li et al., 2014). Using a 1-D chemical transport model, we examine the structure and chemical evolution of HCHO vertical pro-files. By combining measurements of OH reactivity and VOC precursors, we investigate sources of HCHO in the agricul-tural regions of the Po Valley. Finally, we discuss the effects of HCHO sources on calculated ozone production rates as a function of time and altitude.
2 Methods
2.1 Zeppelin NT payload and 12 July flight
Figure 1. (a)Po Basin, with the 12 July 2012 flight track shown in the box and enlarged in(b).(c)Zeppelin altitude during flight.
which is a background urban site according to the Euro-pean Monitoring and Evaluation Programme (EMEP) cri-teria (http://www.nilu.no/projects/ccc/manual/). The nearest urban areas include Bologna 25 km to the southwest and Fer-rara 20 km to the north. The more immediate region consists primarily of wheat and corn fields that experienced intense harvesting activities during the campaign.
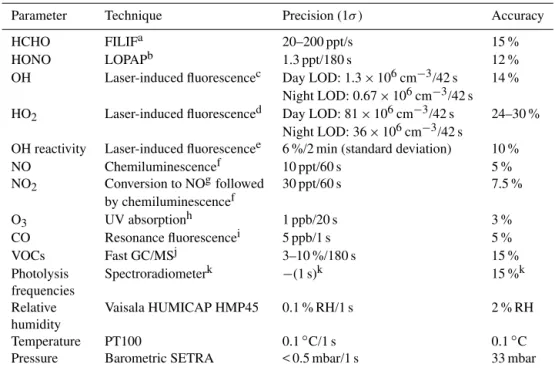
The instrumentation, time resolution, accuracy, and pre-cision of the measurements are fully described in Li et al. (2014) and are summarized here (Table 1). Specifically, HCHO was measured at the Zeppelin nose boom using fiber laser-induced fluorescence (FILIF) (Hottle et al., 2009; Di-Gangi et al., 2011; Kaiser et al., 2014). The time resolu-tion, precision, and accuracy of the measurement are 1 s, 20–200 ppt, and 15 %, respectively. The 2σ detection limit is 40 ppt. OH reactivity was measured from a platform on top of the Zeppelin by flash photolysis of ozone combined with time-resolved OH detection in a flow tube. The instrument is an improved, more compact version of the instrument de-scribed by Lou et al. (2010). The accuracy of the OH reactiv-ity data is 10 %, with a±0.5 s−1systematic error of the zero-air decay rate coefficients (Gomm, 2014). Speciated C4–C11 VOCs, acetonitrile, and select oxygenated VOCs were mea-sured by a fast gas chromatograph / mass spectrometer sys-tem with a time resolution of 180 s and 1σprecision between 3 and 10 % (Jäger, 2014). In addition, OH, HO2, NO, NO2,
O3, CO, HONO, particle concentration/size distribution,
so-lar actinic flux densities, temperature, pressure, relative hu-midity, and 3-D wind were measured simultaneously.
2.2 Model simulations
The Chemistry of Atmosphere-Forest Exchange (CAFE) model is a 1-D chemical transport model that has previ-ously been used in steady-state analysis of trace gas fluxes above a pine forest (Wolfe and Thornton, 2011; Wolfe et al., 2011). For this study, the CAFE framework has been adapted to run in a time-dependent manner and, as the region is not forested, no canopy structure is included. The chemical mechanism generated by the Master Chemical Mechanism (MCM) v3.2 (Jenkin et al., 1997; Saunders et al., 2003; Bloss et al., 2005) contains near-explicit degradation schemes for all constrained VOCs as well as all relevant inorganic chem-istry (more information available at http://mcm.leeds.ac.uk/ MCM). The model was run with seven evenly spaced alti-tude bins, with altialti-tudes from 50 to 150 m for the lowest box and from 650 to 750 m for the highest box. Measurements acquired during Zeppelin ascents were averaged into these 100 m altitude bins. Because descents were performed much more quickly than ascents, data acquired during the ascents have a higher spatial resolution than descent data. Where in-strument time resolution limits data availability, concentra-tions are interpolated from data at surrounding altitude and time bins. In all model scenarios, measured photolysis fre-quencies are used where available. Otherwise, MCM calcu-lated values are scaled according to the ratio of the calcucalcu-lated and measured photolysis rates of NO2.
While methane was not measured at the SPC ground site or from the Zeppelin, measurements of CH4 were
1292 J. Kaiser et al.: An unidentified non-photochemical ground-level source of formaldehyde in the Po Valley
Table 1.Zeppelin-based measurements used for the analysis of O3and HCHO production.
Parameter Technique Precision (1σ ) Accuracy
HCHO FILIFa 20–200 ppt/s 15 %
HONO LOPAPb 1.3 ppt/180 s 12 %
OH Laser-induced fluorescencec Day LOD: 1.3×106cm−3/42 s 14 %
Night LOD: 0.67×106cm−3/42 s
HO2 Laser-induced fluorescenced Day LOD: 81×106cm−3/42 s 24–30 %
Night LOD: 36×106cm−3/42 s
OH reactivity Laser-induced fluorescencee 6 %/2 min (standard deviation) 10 %
NO Chemiluminescencef 10 ppt/60 s 5 %
NO2 Conversion to NOgfollowed 30 ppt/60 s 7.5 %
by chemiluminescencef
O3 UV absorptionh 1 ppb/20 s 3 %
CO Resonance fluorescencei 5 ppb/1 s 5 %
VOCs Fast GC/MSj 3–10 %/180 s 15 %
Photolysis Spectroradiometerk −(1 s)k 15 %k
frequencies
Relative Vaisala HUMICAP HMP45 0.1 % RH/1 s 2 % RH
humidity
Temperature PT100 0.1◦C/1 s 0.1◦C
Pressure Barometric SETRA < 0.5 mbar/1 s 33 mbar
aFiber laser-induced fluorescence (Hottle et al., 2009).bLong path absorption photometry (Li et al., 2014).cHolland et al. (2003).dFuchs et al. (2011).eLou et al. (2010).fECOPHYSICS (type TR780).gPhotolytic blue light converter (Droplet
Technologies type BLC).hENVIRONNEMENT S.A (type O342M).iGerbig et al. (1999).jGas chromatography/mass
spectrometry (Jäger, 2014).kBohn et al. (2008). Accuracy and precision are dependent on conditions and the photolysis process. The 15 % accuracy is a conservative estimate covering important photolysis frequencies.
(Measurements Of Spatial QUantitative Immissions of Trace gases and Aerosols: MOSQUITA; Bukowiecki et al., 2002; Mohr et al., 2011), which was equipped with a Picarro cavity ring-down spectroscopy analyzer (model G2401). MOSQUITA-based CH4measurements were acquired from
8 June 2012 to 9 July 2012. Though measurements are not available for the day of the flight studied here, the average measurement acquired in the flight region of the Zeppelin (2355 ppb) is likely applicable to this study.
In the base case scenario, the model is constrained to all measurements, with the exception of HCHO. Given the extensive constraints, deposition, emission, and ad-vection are not treated explicitly. Because deposition can be a non-negligible sink for many oxidized species (in-cluding HCHO), model results represent an upper limit on calculated mixing ratios. Turbulent diffusion is repre-sented using K-theory, where diffusion coefficients are calcu-lated using the single-column chemistry and climate model ECHAM4(SCM) (Ganzeveld et al., 2002). Further discus-sion of the eddy diffudiscus-sion coefficient, uncertainty associated with turbulent diffusion, and the potential influence of depo-sition is available in the Supplement.
To initialize non-measured species (e.g., speciated RO2
and organic nitrates), a “spin-up” 0-D diurnal model run was performed constraining all species to a combination of the lowest altitude Zeppelin measurements and available mea-surements from the nearby SPC ground site acquired
be-tween 12 June and 10 July 2012. This includes average diur-nal profiles of CO, O3, benzene, toluene, NOx, and relevant
meteorological parameters. An average methane concentra-tion of 2355 ppb from the MOSQUITA mobile laboratory was assumed. Anthropogenic VOCs were scaled to ground benzene measurements according to their observed relation-ship with benzene measurements acquired on the Zeppelin. To mimic the temperature dependence of isoprene emission rates, isoprene mixing ratios were assumed to be proportional to the cosine of the solar zenith angle and scaled to avail-able Zeppelin measurements. As isoprene concentrations are small (< 100 ppt), the diurnal cycle has a negligible impact on modeled results. For 1-D model simulations, non-measured species are initialized to the output of the spin-up model at 06:00 LT on the fourth day scaled to HCHO measured on the Zeppelin as a function of altitude.
3 Results and discussion
3.1 Observed HCHO and OH reactivity
Figure 2.Flight pattern colored by selected measurements.
the delineation between the residual layer, nocturnal bound-ary layer, and mixed layer can be found in Li et al. (2014).
Figure 2 shows measured HCHO, OH reactivity, and se-lected VOCs as a function of time and altitude. Primary bio-genic VOC concentrations were low throughout the entire flight (isoprene < 60 ppt), which is consistent with previous measurements at Verzago, an agriculture site downwind of Milan (Steinbacher et al., 2005a). Anthropogenic VOCs such as toluene and benzene were around an order of magnitude lower than at Verzago in 2003 (Steinbacher et al., 2005b). In contrast to primary biogenic and anthropogenic VOCs, oxi-dized VOCs were abundant (reaching HCHO > 3.8 ppb, ac-etaldehyde > 1.0 ppb). The overall magnitude and morning rise of HCHO observed were similar to those observed pre-viously in Spessa in 2002 (Junkermann, 2009).
Before sunrise, elevated levels of toluene and other an-thropogenic VOCs were observed in the residual layer com-pared to lower altitudes. Accumulation of VOC oxidation products including HCHO, methacrolein, and acetaldehyde was observed in the nocturnal boundary and in the residual layer. These oxidation products are either built up overnight or remain elevated from the previous day. After sunrise (05:45 LT), both biogenic and anthropogenic primary VOC increase in the developing mixed layer. The observed in-crease in HCHO mixing ratios lags that of primary VOCs, so that higher HCHO concentrations were observed ∼4 h after sunrise. The general vertical structure of the observed OH reactivity tracks well with HCHO, with elevated values in nocturnal boundary and growing mixed layers. Based on the vertical structure of the observed HCHO and other trace gasses, potential sources of HCHO are discussed further in Sect. 3.3.
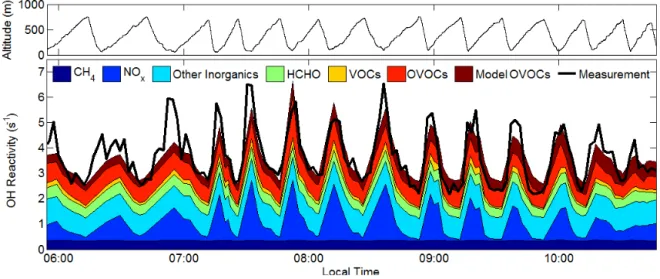
3.2 Base scenario modeled OH reactivity and HCHO The top panel of Fig. 3 shows the measured and modeled OH reactivity as a function of time and altitude. Overall, the magnitude and vertical structure is well captured by mea-sured VOCs and their oxidation products. Where underes-timated, the average discrepancy is less than 7 %, with larger discrepancies at lower altitudes. Speciated model contribu-tions to OH reactivity are shown in Fig. 4, calculated with all species (including HCHO) constrained to observations. Largely, NOx dominates the modeled OH reactivity,
con-tributing 40 % to modeled reactivity at 100 m and 08:45 LT. The contribution of measured VOCs and OVOCs is most sig-nificant in the mixed layer (26 % at 100 m, 08:45 LT). HCHO consistently contributes the largest portion of calculated OH reactivity (HCHO reactivity∼ 0.2 s−1ppb−1, 8 % of total
modeled reactivity at 100 m and 08:45 LT).
1294 J. Kaiser et al.: An unidentified non-photochemical ground-level source of formaldehyde in the Po Valley
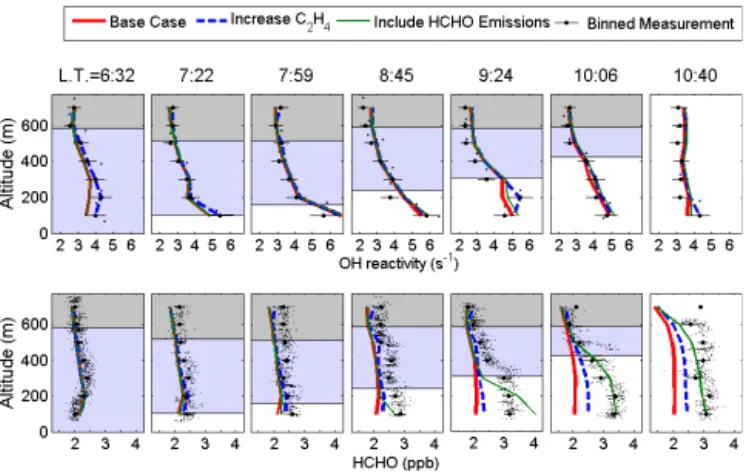
Figure 3.Measured and calculated OH reactivity and HCHO ver-tical profiles for every other Zeppelin ascent. Error bars on OH re-activity represent the measurement precision. Error bars on HCHO represent the standard deviation of the measurements in the given altitude bin. The gray, blue, and white areas represent the residual layer, the nocturnal boundary layer, and the mixed layer, respec-tively. Layer height was determined by the observed steep gradients in O3mixing ratios, as detailed in Li et al. (2014). Model scenarios are described in more detail in Sects. 3.2 and 3.3.
3.3 Potential sources of HCHO
The oxidation of additional non-measured VOCs is often cited as a possible source of missing HCHO production in models (compared to the FORMAT study; Junkermann, 2009). Using OH reactivity measurements, one can place an upper bound on the overall VOC oxidation rate in the at-mosphere. As discussed above, measured VOCs and their modeled oxidation products explain the majority of observed OH reactivity, though a small discrepancy is occasionally observed. To investigate the possibility of non-measured HCHO precursors, an additional model scenario is con-structed in which the missing OH reactivity is assumed to be comprised entirely of ethene (C2H4). C2H4 was chosen
as a surrogate species because it produces HCHO from OH and O3oxidation with respective yields of 160 % (Niki et al.,
1981) and 154 % (Alam et al., 2011). Thus, the increase in modeled HCHO per increase in calculated OH reactivity is maximized.
Figure 3 shows the effect of increasing C2H4on HCHO
and OH reactivity. While measured mixed-layer HCHO in-creases by as much as 1.3 ppb between 06:30 and 10:00 LT, model HCHO increases by only 300 ppt. In order to gener-ate the required HCHO, modeled C2H4 would need to be
increased such that calculated OH reactivity is up to 56 % greater than the measurements. While the model vertical pro-file at 10:40 LT is in better agreement with measurements, at the 09:24 LT vertical profile, additional VOC precursors can explain no more than 0.26 ppb, or 23 %, of the miss-ing HCHO budget. We therefore conclude that non-measured
VOCs cannot explain the discrepancy in measured and mod-eled HCHO.
Another possible source of HCHO is transport from nearby urban centers. In the early morning, the average wind speed was less than 1.2 m s−1, and the average HCHO life-time was∼3.5 h. Between 06:00 and 10:30 LT, the bottom-most layer in contact with the surface grows from less than 50 m to more than 600 m in height. Accounting for this di-lution, and the HCHO lifetime and wind speed, and assum-ing a nighttime concentration in Bologna of 6 ppb (near the maximum nocturnal concentration reported in Milan; Junker-mann, 2009), the amount of HCHO advected could be no more than 90 ppt, or 7 % of the missing HCHO budget. Ad-ditionally, no other long-lived tracers of anthropogenic in-fluence (i.e., CO, xylenes) show a rise in the late morning. Finally, the vertical profile of the missing HCHO suggests a strong source near the ground, which is convectively incorpo-rated into the growing mixed layer. As advection of HCHO, e.g., from Bologna, would more likely affect the mixed layer as a whole, transport is an unlikely source of HCHO.
As the air aloft initially has slightly elevated levels of HCHO, entrainment of air from the residual layer into the mixed layer is an additional potential source of HCHO. Us-ing ECHAM4(SCM) to investigate observations from the October 2005 field campaign over the Atlantic Ocean, French Guyana, and Suriname, Ganzeveld et al. (2008) demon-strated that the assessment of daytime HCHO requires a thorough evaluation of the morning turbulent transport. The model-predicted entrainment of HCHO would affect the day-time radical budget and resulting oxidative chemistry; how-ever, limited observations in the residual layer did not al-low for comparison of SCM simulations with measurements. If entrainment was the primary cause of measurement and model discrepancy, the missing HCHO would be larger near the top of the boundary layer and when HCHO concentra-tions aloft are the highest. In this study, the largest discrep-ancies occur at the lowest altitudes and later in the morning. The highly resolved vertical measurements enabled by the Zeppelin aircraft demonstrate that, for this study, entrainment is unlikely to be the primary cause of model/measurement discrepancies at low altitudes.
Figure 4.Contributions to calculated OH reactivity as a function of time. Only data acquired during the ascents are used in the calcu-lated reactivity. The VOC category consists of isoprene, toluene, benzene, xylenes, ethylbenzene, C4–C9 straight chain alkanes, styrene, trimethylbenzene, 1-pentene, cis-2-pentene, cyclohexanone, propylbenzene, isopropylbenzene, isopentane, benzaldehyde, and 1-butene. The OVOC category consists of C2–C6 straight chain aldehydes, acetone, methanol, ethanol, methyl acetate, ethyl acetate, methacrolein, methyl ethyl ketone, methyl vinyl ketone, and 1-propanol. The inorganics category consists of CO, H2, HONO, HO2, and O3. Model OVOCs are non-measured oxidation products calculated by the MCM.
Houston, Texas (Rappenglueck et al., 2013), the increase of 19 ppb in CO between 06:20 and 10:00 LT, if wholly from traffic emissions, could account for only 57 ppt (4 %) of the observed increase in HCHO. We therefore conclude that nei-ther biomass burning nor traffic can account for the relatively high levels of observed HCHO.
Finally, the soil, decaying plant matter from harvesting, or wheat or other crops in the region of the Zeppelin spirals may be a source of local direct HCHO emission. Measure-ments of oxygenated VOCs (OVOCs) from agricultural crops are limited. Konig et al. (1995) reported that total OVOC emission rates from wheat were 10.9 ng g−1h−1, though speciated measurements of formaldehyde were not avail-able. Dry weight HCHO emission rates from tree species in Italy are much higher, ranging from 382 to 590 ng g−1h−1 (Kesselmeier et al., 1997). Oxygenated VOC emissions are expected to respond differently to light and tempera-ture than terpenoids (Rinne et al., 2007); nevertheless, the classic terpenoid exponential model is often extended to OVOC emissions. For example, for ground emissions of HCHO in a ponderosa pine forest, DiGangi et al. (2011) ap-plied an emission algorithm ofEHCHO=A·exp(βT ), where
A=740 ng m−2h−1andβ=0.07◦C−1. The emissions were scaled by photosynthetically active radiation, with night-time emissions fixed to 15 % of daytime emissions.
A final model scenario was constructed that incorpo-rates direct emissions of HCHO according to the sunlight-weighted exponential emission function similar to DiGangi et al. (2011), employing a much smaller prefactor of A=375 ng m−2h−1 to best capture the observed HCHO mixing ratios. These emissions are added as a direct HCHO
source for the model’s surface layer (0–50 m), with all other surface layer concentrations constrained to their lowest al-titude measurement. The results are shown in Fig. 3. The vertical profile is mostly consistent with measurements, with possible discrepancies arising from uncertainty in eddy diffu-sion constants (see Supplement). Due to the good agreement of this model result and the improbability of other HCHO sources, we conclude that local direct emissions from agri-cultural land are the most likely source of additional HCHO. The finding that direct biogenic emission could account for a large percentage of the observed increase in the HCHO mixing ratio is in contrast with the Liu et al. (2007) assump-tion that direct emissions account for only∼10 % of HCHO sources in the agricultural Po Valley. Due to scarce data avail-ability, limited information on chemical speciation, and only rough estimates of emission rates, models often assume a default emission rate for all oxygenated VOCs independent of land use or plant type (Karl et al., 2009). To realize the full potential of these oxidized VOCs as tracers of the pho-tochemistry that forms secondary pollutants, and to under-stand their effects on such chemistry, thorough studies of di-rect emission are needed.
3.4 Implications for ozone production
1296 J. Kaiser et al.: An unidentified non-photochemical ground-level source of formaldehyde in the Po Valley
Figure 5.HCHO and CO in the mixed layer. Error bars represent instrument accuracy. There is little variation in mixed layer CO, and the correlation with HCHO is low (r2=0.29).
P(O3)=kHO2+NO[HO2][NO] (2)
+X
i
kRO2i+NO[RO2i][NO],
where NO2is assumed to photodissociate, leading to
imme-diate ozone production (reactions 1 and 2). In our MCM-based calculations, the formation of organic nitrates is ac-counted for in the RO2+NO reaction rates. As direct
mea-surements of RO2 were not available on the Zeppelin, the
analysis presented here relies on speciated modeled RO2
con-centrations and reaction rates. Typical model RO2
concentra-tions are between 10 and 30 % of the sum of modeled RO2
and measured HO2, such that HO2accounts for the majority
of the modeled NO to NO2conversion. Because HCHO
pho-tolysis and oxidation account for as much as 39 % of model HO2production, failing to include all sources of HCHO has
significant effects on calculated HO2concentrations. Though
not probable in this analysis, if oxidation of unmeasured VOCs contributes significantly to the HCHO budget, RO2
concentrations would likely be underestimated.
Because the effects of transport on O3may be large, we
do not explicitly compare measured and modeled O3
con-centrations in this study. Instead, two model scenarios were constructed to estimate the impact of missing HCHO on HO2
mixing ratios and therefore ozone production. Both simula-tions were carried out with HO2unconstrained, and HCHO
was either fixed to observations or calculated by the model. Constraining HO2has a negligible effect on modeled HCHO
concentrations. Because the difference in the concentration of HO2 between the two model scenarios is smaller than
the measurement uncertainty (∼12 % compared to 30 %), and because both model scenarios reproduce HO2
concen-tration within the measurement uncertainty, measured and modeled HO2 are not compared. At the observed mixed
layer NO concentrations of ∼1 ppb and a rate constant of
Local Time
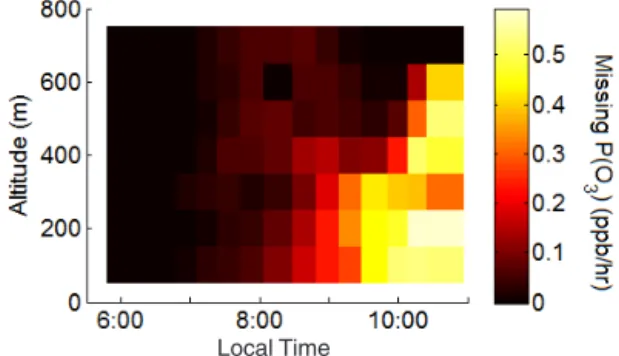
Figure 6.Underestimate in ozone production rate caused by the modeled underestimate in HCHO as a function of time and alti-tude. Missing P(O3) is defined as P(O3) calculated using measured
HCHO minus P(O3) calculated using modeled HCHO.
kHO2+NO=8.6×10
−12cm3molec−1s−1, an increase of just
1 ppt HO2 corresponds to an additional 0.7 ppb h−1 (14 %)
of ozone production. Figure 6 shows the difference in P(O3)
driven by differences in calculated HO2concentrations.
As-suming that the trend in the discrepancy in HCHO will con-tinue to increase throughout the day, an increasing underpre-diction of the local ozone production rate is expected for this agricultural region.
4 Conclusions
Using a near-explicit 1-D model and a comprehensive set of trace gas measurements acquired from a Zeppelin airship, we have examined VOC oxidation and its relationship to ozone production in the Po Valley. As in previous work in the re-gion, our model was largely unable to reproduce the morning rise and high levels of observed HCHO. Measured OH reac-tivity, however, was explained by measured VOCs and their calculated oxidation products. The most probable source of missing HCHO is direct emission from the soil and plant matter beneath the Zeppelin. As a result of the underestimate in HCHO, model ozone production rates based on HO2
con-centrations are underestimated by as much as 12 % before noon, and the underestimate is expected to increase. When considering photochemical models of O3 production, even
small underestimates in HCHO can lead to large underes-timates of local ozone production rates. For that reason, and considering the large portion of land used globally for similar agricultural purposes, direct measurements of OH reactivity and HCHO as well as improved OVOC emission inventories would aid in the prediction of high ozone events.
Acknowledgements. This work is within the PEGASOS project, which is funded by the European Commission under Framework Programme 7 (FP7-ENV-2010-265148). The authors would like to acknowledge all members of the PEGASOS flight and science teams. We also acknowledge Zeppelin Luftschifftechnik (ZLT) and Deutsche Zeppelin Reederei (DZR) for their cooperation. J. Jäger, R. Wegener, I. Lohse, and B. Bohn would like to thank the Deutsche Forschungsgemeinschaft for funding within priority program HALO (WE-4384/2-2 and BO1580/4-1). J. Kaiser, G. M. Wolfe, and F. Keutsch would like to thank Maria Cazorla for helping with the calibration of the HCHO measurements and NSF-AGS (1051338) and Forschungszentrum Jülich for support. G. Wolfe acknowledges support from the NOAA Climate and Global Change Postdoctoral Fellowship Program. J. Kaiser acknowledges support from the National Science Foundation Grad-uate Research Fellowship Program under grant no. DGE-1256259. We would like to thank ARPA Emilia-Romagna (Region Agency for Environmental Protection in the Emilia-Romagna region Italy) and all participants in the Supersito Project for providing mea-surements at the SPC ground site. The authors also acknowledge Christos Kaltsonoudis and Spyros Pandis from the Laboratory of Air Quality Studies at the University of Patras for making CO data from the SPC ground site available.
Edited by: E. Nemitz
References
Alam, M. S., Camredon, M., Rickard, A. R., Carr, T., Wyche, K. P., Hornsby, K. E., Monks, P. S., and Bloss, W. J.: Total radical yields from tropospheric ethene ozonolysis, Phys. Chem. Chem. Phys., 13, 11002–11015, doi:10.1039/c0cp02342f, 2011. Bloss, C., Wagner, V., Jenkin, M. E., Volkamer, R., Bloss, W. J.,
Lee, J. D., Heard, D. E., Wirtz, K., Martin-Reviejo, M., Rea, G., Wenger, J. C., and Pilling, M. J.: Development of a detailed chemical mechanism (MCMv3.1) for the atmospheric oxidation of aromatic hydrocarbons, Atmos. Chem. Phys., 5, 641–664, doi:10.5194/acp-5-641-2005, 2005.
Bohn, B., Corlett, G. K., Gillmann, M., Sanghavi, S., Stange, G., Tensing, E., Vrekoussis, M., Bloss, W. J., Clapp, L. J., Kortner, M., Dorn, H.-P., Monks, P. S., Platt, U., Plass-Dülmer, C., Mi-halopoulos, N., Heard, D. E., Clemitshaw, K. C., Meixner, F. X., Prevot, A. S. H., and Schmitt, R.: Photolysis frequency measure-ment techniques: results of a comparison within the ACCENT project, Atmos. Chem. Phys., 8, 5373–5391, doi:10.5194/acp-8-5373-2008, 2008.
Bukowiecki, N., Dommen, J., Prévôt, A. S. H., Richter, R., Wein-gartner, E., and Baltensperger, U.: A mobile pollutant measure-ment laboratory – measuring gas phase and aerosol ambient con-centrations with high spatial and temporal resolution, Atmos. Environ., 36, 5569–5579, doi:10.1016/S1352-2310(02)00694-5, 2002.
DiGangi, J. P., Boyle, E. S., Karl, T., Harley, P., Turnipseed, A., Kim, S., Cantrell, C., Maudlin III, R. L., Zheng, W., Flocke, F., Hall, S. R., Ullmann, K., Nakashima, Y., Paul, J. B., Wolfe, G. M., Desai, A. R., Kajii, Y., Guenther, A., and Keutsch, F. N.: First direct measurements of formaldehyde flux via eddy covari-ance: implications for missing in-canopy formaldehyde sources,
Atmos. Chem. Phys., 11, 10565–10578, doi:10.5194/acp-11-10565-2011, 2011.
Dolgorouky, C., Gros, V., Sarda-Esteve, R., Sinha, V., Williams, J., Marchand, N., Sauvage, S., Poulain, L., Sciare, J., and Bonsang, B.: Total OH reactivity measurements in Paris during the 2010 MEGAPOLI winter campaign, Atmos. Chem. Phys., 12, 9593– 9612, doi:10.5194/acp-12-9593-2012, 2012.
Edwards, P. M., Evans, M. J., Furneaux, K. L., Hopkins, J., Ingham, T., Jones, C., Lee, J. D., Lewis, A. C., Moller, S. J., Stone, D., Whalley, L. K., and Heard, D. E.: OH reactivity in a South East Asian tropical rainforest during the Oxidant and Particle Pho-tochemical Processes (OP3) project, Atmos. Chem. Phys., 13, 9497–9514, doi:10.5194/acp-13-9497-2013, 2013.
Fuchs, H., Bohn, B., Hofzumahaus, A., Holland, F., Lu, K. D., Nehr, S., Rohrer, F., and Wahner, A.: Detection of HO2by
laser-induced fluorescence: calibration and interferences from RO2
radicals, Atmos. Meas. Tech., 4, 1209–1225, doi:10.5194/amt-4-1209-2011, 2011.
Ganzeveld, L., Lelieveld, J., Dentener, F., Krol, M., and Roelofs, G.: Atmosphere-biosphere trace gas exchanges simulated with a single-column model, J. Geophys. Res.-Atmos., 107, ACH8.1– ACH8.21, doi:10.1029/2001JD000684, 2002.
Ganzeveld, L., Eerdekens, G., Feig, G., Fischer, H., Harder, H., Königstedt, R., Kubistin, D., Martinez, M., Meixner, F. X., Scheeren, H. A., Sinha, V., Taraborrelli, D., Williams, J., Vilà-Guerau de Arellano, J., and Lelieveld, J.: Surface and boundary layer exchanges of volatile organic compounds, nitrogen oxides and ozone during the GABRIEL campaign, Atmos. Chem. Phys., 8, 6223–6243, doi:10.5194/acp-8-6223-2008, 2008.
Gerbig, C., Schmitgen, S., Kley, D., Volz-Thomas, A., Dewey, K., and Haaks, D.: An improved fast-response vacuum-UV reso-nance fluorescence CO instrument, J. Geophys. Res., 104, 1699– 1704, doi:10.1029/1998JD100031, 1999.
Gomm, S.: Luftgestützte Messung von
HOx-Radikalkonzentrationen mittels Laser-induzierter Fluoreszenz auf einem Zeppelin NT: Untersuchung der atmosphärischen Oxidationsstärke der unteren Troposphäre, PhD, Bergische-Universität Wuppertal, 2014.
Holland, F., Hofzumahaus, A., Schäfer, R., Kraus, A., and Pätz,
H. W.: Measurements of OH and HO2 radical concentrations
and photolysis frequencies during BERLIOZ, J. Geophys. Res.-Atmos., 108, PHO2.1–PHO2.23, doi:10.1029/2001jd001393, 2003.
Hottle, J., Huisman, A., Digangi, J., Kammrath, A., Gal-loway, M., Coens, K., and Keutsch, F.: A Laser Induced Fluorescence-Based Instrument for In-Situ Measurements of At-mospheric Formaldehyde, Environ. Sci. Technol., 43, 790–795, doi:10.1021/es801621f, 2009.
Jäger, J.: Airborne VOC measurements on board the Zeppelin NT during PEGASOS campaigns in 2012 deploying the improved Fast-GC-MSD System, PhD, Forschungszentrum Jülich GmbH, Jülich, Germany, 2014.
Jenkin, M., Saunders, S., and Pilling, M.: The tropospheric degra-dation of volatile organic compounds: A protocol for mechanism development, Atmos. Environ., 31, 81–104, doi:10.1016/S1352-2310(96)00105-7, 1997.
1298 J. Kaiser et al.: An unidentified non-photochemical ground-level source of formaldehyde in the Po Valley
Kaiser, J., Li, X., Tillmann, R., Acir, I., Holland, F., Rohrer, F., We-gener, R., and Keutsch, F. N.: Intercomparison of Hantzsch and fiber-laser-induced-fluorescence formaldehyde measurements, Atmos. Meas. Tech., 7, 1571–1580, doi:10.5194/amt-7-1571-2014, 2014.
Karl, M., Guenther, A., Köble, R., Leip, A., and Seufert, G.: A new European plant-specific emission inventory of biogenic volatile organic compounds for use in atmospheric transport models, Bio-geosciences, 6, 1059–1087, doi:10.5194/bg-6-1059-2009, 2009. Kesselmeier, J., Bode, K., Hofmann, U., Muller, H., Schafer, L., Wolf, A., Ciccioli, P., Brancaleoni, E., Cecinato, A., Frattoni, M., Foster, P., Ferrari, C., Jacob, V., Fugit, J. L., Dutaur, L., Simon, V., and Torres, L.: Emission of short chained organic acids, aldehydes and monoterpenes from Quercus ilex L. and Pi-nus pinea L. in relation to physiological activities, carbon bud-get and emission algorithms, Atmos. Environ., 31, 119–133, doi:10.1016/s1352-2310(97)00079-4, 1997.
Konig, G., Brunda, M., Puxbaum, H., Hewitt, C. N., Duckham, S. C., and Rudolph, J.: Relative contribution of oxygenated hydro-carbons to the total biogenic VOC emissions of selected Mid-European agricultural and natural plant-species, Atmos. Envi-ron., 29, 861–874, doi:10.1016/1352-2310(95)00026-u, 1995. Li, X., Rohrer, F., Hofzumahaus, A., Brauers, T., Häseler, R., Bohn,
B., Broch, S., Fuchs, H., Gomm, S., Holland, F., Jäger, J., Kaiser, J., Keutsch, F. N., Lohse, I., Lu, K., Tillmann, R., Wegener, R., Wolfe, G. M., Mentel, T. F., Kiendler-Scharr, A., and Wahner, A.: Missing Gas-Phase Source of HONO Inferred from Zep-pelin Measurements in the Troposphere, Science, 344, 292–296, doi:10.1126/science.1248999, 2014.
Liu, L., Andreani-Aksoyoglu, S., Keller, J., Ordonez, C., Junker-mann, W., Hak, C., Braathen, G., ReiJunker-mann, S., Astorga-Llorens, C., Schultz, M., Prevot, A., and Isaksen, I.: A photochemical modeling study of ozone and formaldehyde generation and bud-get in the Po basin, J. Geophys. Res.-Atmos., 112, D22303, doi:10.1029/2006JD008172, 2007.
Lou, S., Holland, F., Rohrer, F., Lu, K., Bohn, B., Brauers, T., Chang, C. C., Fuchs, H., Häseler, R., Kita, K., Kondo, Y., Li, X., Shao, M., Zeng, L., Wahner, A., Zhang, Y., Wang, W., and Hofzumahaus, A.: Atmospheric OH reactivities in the Pearl River Delta – China in summer 2006: measurement and model results, Atmos. Chem. Phys., 10, 11243–11260, doi:10.5194/acp-10-11243-2010, 2010.
Mohr, C., Richter, R., DeCarlo, P. F., Prévôt, A. S. H., and Bal-tensperger, U.: Spatial variation of chemical composition and sources of submicron aerosol in Zurich during wintertime using mobile aerosol mass spectrometer data, Atmos. Chem. Phys., 11, 7465–7482, doi:10.5194/acp-11-7465-2011, 2011.
Niki, H., Maker, P. D., Savage, C. M., and Breitenbach, L. P.: An FTIR study of mechanisms for the HO radical initiated oxidation of C2H4in the presence of NO: Detection of glycolaldehyde, Chem. Phys. Lett., 80, 499–503, 1981.
Rappenglueck, B., Lubertino, G., Alvarez, S., Golovko, J., Czader, B., and Ackermann, L.: Radical precursors and related species from traffic as observed and modeled at an urban high-way junction, JAPCA J. Air Waste Ma., 63, 1270–1286, doi:10.1080/10962247.2013.822438, 2013.
Rinne, J., Taipale, R., Markkanen, T., Ruuskanen, T. M., Hellén, H., Kajos, M. K., Vesala, T., and Kulmala, M.: Hydrocarbon fluxes above a Scots pine forest canopy: measurements and mod-eling, Atmos. Chem. Phys., 7, 3361–3372, doi:10.5194/acp-7-3361-2007, 2007.
Sadanaga, Y., Yoshino, A., Kato, S., and Kajii, Y.: Measure-ments of OH reactivity and photochemical ozone production in the urban atmosphere, Environ. Sci. Technol., 39, 8847–8852, doi:10.1021/es049457p, 2005.
Saunders, S. M., Jenkin, M. E., Derwent, R. G., and Pilling, M. J.: Protocol for the development of the Master Chemical Mech-anism, MCM v3 (Part A): tropospheric degradation of non-aromatic volatile organic compounds, Atmos. Chem. Phys., 3, 161–180, doi:10.5194/acp-3-161-2003, 2003.
Steinbacher, M., Dommen, J., Ordonez, C., Reimann, S., Gruebler, F., Staehelin, J., Andreani-Aksoyoglu, S., and Prevot, A. S. H.: Volatile organic compounds in the Po Basin. part B: Biogenic VOCs, J. Atmos. Chem., 51, 293–315, doi:10.1007/s10874-005-3577-0, 2005a.
Steinbacher, M., Dommen, J., Ordonez, C., Reimann, S., Gruebler, F. C., Staehelin, J., and Prevot, A. S. H.: Volatile organic com-pounds in the Po Basin. part A: Anthropogenic VOCs, J. Atmos. Chem., 51, 271–291, doi:10.1007/s10874-005-3576-1, 2005b. Wolfe, G. M. and Thornton, J. A.: The Chemistry of
Atmosphere-Forest Exchange (CAFE) Model – Part 1: Model descrip-tion and characterizadescrip-tion, Atmos. Chem. Phys., 11, 77–101, doi:10.5194/acp-11-77-2011, 2011.
Wolfe, G. M., Thornton, J. A., Bouvier-Brown, N. C., Goldstein, A. H., Park, J.-H., McKay, M., Matross, D. M., Mao, J., Brune, W. H., LaFranchi, B. W., Browne, E. C., Min, K.-E., Wooldridge, P. J., Cohen, R. C., Crounse, J. D., Faloona, I. C., Gilman, J. B., Kuster, W. C., de Gouw, J. A., Huisman, A., and Keutsch, F. N.: The Chemistry of Atmosphere-Forest Exchange (CAFE) Model – Part 2: Application to BEARPEX-2007 observations, Atmos. Chem. Phys., 11, 1269–1294, doi:10.5194/acp-11-1269-2011, 2011.